Home > Comparison > Industrials > DOV vs JBTM
The strategic rivalry between Dover Corporation and JBT Marel Corporation shapes the Industrials machinery landscape. Dover operates as a diversified industrial powerhouse with broad equipment and component offerings. JBT Marel specializes in high-tech processing solutions focused on food and beverage sectors. This contrast highlights a battle between industrial diversification and niche technological innovation. This analysis aims to identify which trajectory delivers superior risk-adjusted returns for a balanced, diversified portfolio.
Table of contents
Companies Overview
Dover Corporation and JBT Marel Corporation are pivotal players in the industrial machinery sector, shaping market dynamics through innovation and scale.
Dover Corporation: Diverse Industrial Solutions Leader
Dover Corporation commands a broad industrial machinery portfolio, generating revenue from equipment, software, and services across multiple sectors including aerospace, energy, and refrigeration. In 2026, Dover focuses strategically on expanding its Clean Energy & Fueling segment, targeting sustainable solutions alongside traditional industrial markets. Its diversified product lines and aftermarket services drive steady cash flow and market resilience.
JBT Marel Corporation: Food Industry Technology Innovator
JBT Marel Corporation specializes in advanced food and beverage processing technologies, serving global markets with value-added automation and packaging solutions. Its revenue hinges on high-tech systems for food production efficiency and safety. In 2026, JBT Marel sharpens its strategy on automation and digital integration, enhancing end-to-end food processing capabilities to meet rising demand for quality and speed in food manufacturing.
Strategic Collision: Similarities & Divergences
Both companies emphasize industrial machinery innovation but diverge in sector focus: Dover spans multiple industrial end-markets, while JBT Marel zeroes in on food and beverage technology. Their primary battleground lies in automation and software-driven efficiency improvements. Dover offers a diversified, stable investment profile; JBT Marel presents a niche, growth-oriented opportunity with a concentrated market footprint.
Income Statement Comparison
This data dissects the core profitability and scalability of both corporate engines to reveal who dominates the bottom line:
| Metric | Dover Corporation (DOV) | JBT Marel Corporation (JBTM) |
|---|---|---|
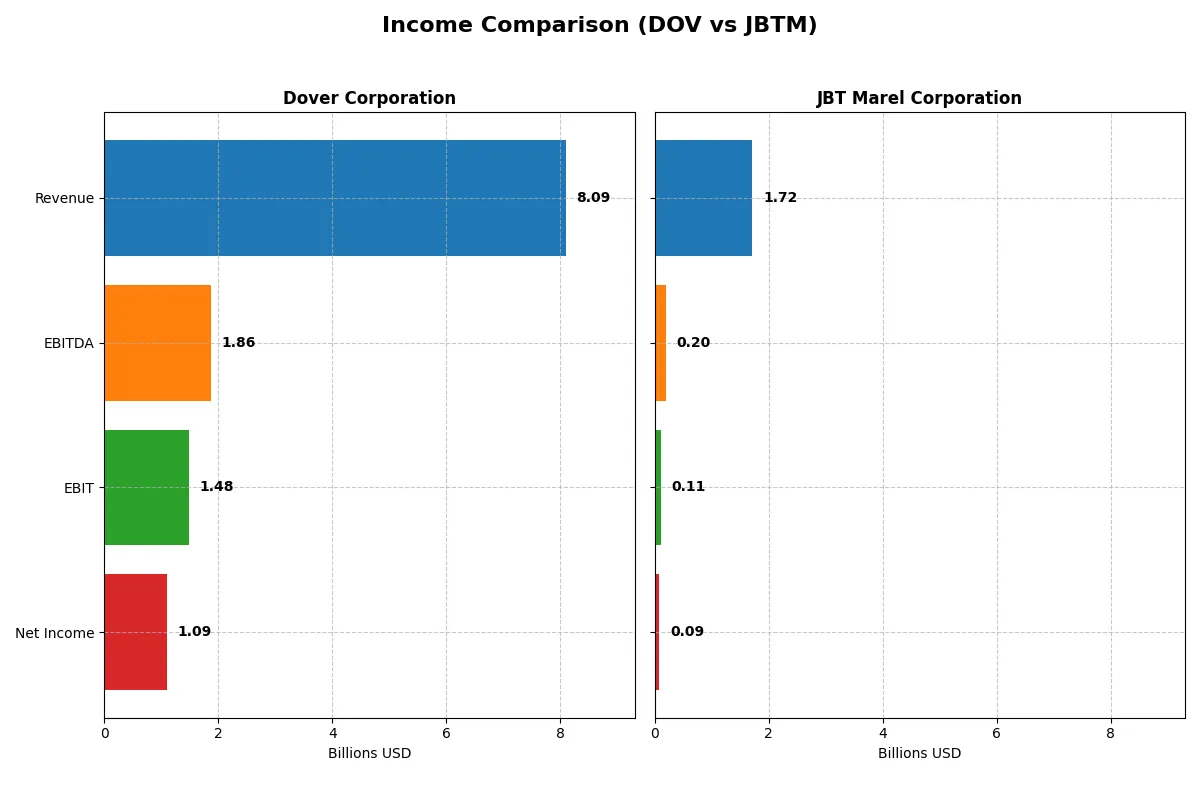
| Revenue | 8.1B | 1.7B |
| Cost of Revenue | 4.9B | 1.1B |
| Operating Expenses | 1.8B | 508M |
| Gross Profit | 3.2B | 627M |
| EBITDA | 1.9B | 204M |
| EBIT | 1.5B | 115M |
| Interest Expense | 110M | 19M |
| Net Income | 1.1B | 85M |
| EPS | 7.97 | 2.67 |
| Fiscal Year | 2025 | 2024 |
Income Statement Analysis: The Bottom-Line Duel
This income statement comparison reveals which company demonstrates stronger operational efficiency and profitability in their core business engines.
Dover Corporation Analysis
Dover’s revenue rose modestly to 8.1B in 2025, up 4.5% year-over-year, while net income declined sharply to 1.09B. Gross margin remains robust at nearly 40%, supporting solid profit generation. However, a 21% drop in EBIT and a 61% plunge in net margin signal weakening operational momentum and margin pressure despite stable revenues.
JBT Marel Corporation Analysis
JBT Marel’s revenue increased moderately to 1.72B in 2024, growing 3.1% year-over-year, but net income collapsed by 85% to 85M. Gross margin at 36.5% stays healthy, but EBIT margin at 6.7% weakens. The steep net margin and EPS declines reflect deteriorating profitability and efficiency under rising operating expenses.
Margin Strength vs. Earnings Stability
Dover commands higher margins and larger absolute profits, despite recent declines in earnings and margin momentum. JBT Marel shows consistent revenue growth but suffers from severe profitability erosion. Dover’s scale and margin profile offer a clearer fundamental advantage, while JBT’s earnings volatility and margin contraction suggest higher risk for investors seeking stable returns.
Financial Ratios Comparison
These vital ratios act as a diagnostic tool to expose the underlying fiscal health, valuation premiums, and capital efficiency of the companies compared below:
| Ratios | Dover Corporation (DOV) | JBT Marel Corporation (JBTM) |
|---|---|---|
| ROE | 20.7% (2023) | 39.1% (2023) |
| ROIC | 10.8% (2023) | 6.3% (2023) |
| P/E | 20.35 (2023) | 5.46 (2023) |
| P/B | 4.21 (2023) | 2.14 (2023) |
| Current Ratio | 1.40 (2023) | 2.27 (2023) |
| Quick Ratio | 0.90 (2023) | 1.78 (2023) |
| D/E | 0.72 (2023) | 0.43 (2023) |
| Debt-to-Assets | 32.4% (2023) | 23.8% (2023) |
| Interest Coverage | 9.29 (2023) | 6.78 (2023) |
| Asset Turnover | 0.68 (2023) | 0.61 (2023) |
| Fixed Asset Turnover | 7.45 (2023) | 6.71 (2023) |
| Payout ratio | 27.0% (2023) | 2.20% (2023) |
| Dividend yield | 1.32% (2023) | 0.40% (2023) |
| Fiscal Year | 2023 | 2023 |
Efficiency & Valuation Duel: The Vital Signs
Financial ratios act as a company’s DNA, revealing hidden risks and operational excellence that raw numbers alone cannot capture.
Dover Corporation
Dover posts a strong net margin of 13.52%, signaling solid profitability, but its ROE and ROIC are notably absent, raising caution on capital efficiency. The P/E of 24.49 suggests a fairly valued stock. Dover offers a modest 1.06% dividend yield, balancing shareholder returns with reinvestment into R&D at 1.93% of revenue, hinting at growth focus.
JBT Marel Corporation
JBTM exhibits weaker profitability with a net margin of 4.98% and a low 5.53% ROE, reflecting operational challenges. Its high P/E of 47.63 marks the stock as expensive relative to earnings. The dividend yield is minimal at 0.32%, and reinvestment appears limited, with no R&D ratio provided, signaling restrained growth initiatives.
Valuation Discipline vs. Profitability Concerns
Dover offers a more balanced profile with solid margins and a reasonable valuation, despite gaps in ROE and ROIC data. JBTM’s expensive valuation paired with weaker profitability raises questions. Investors prioritizing income and value may prefer Dover, while those seeking speculative growth may find JBTM’s risk profile fits their appetite.
Which one offers the Superior Shareholder Reward?
I see Dover Corporation (DOV) delivers a stronger shareholder reward than JBT Marel Corporation (JBTM). DOV yields ~1.1% with a conservative 26% payout, fully covered by free cash flow (~0.83 FCF/OCF ratio). It pairs dividends with steady buybacks, enhancing total returns sustainably. JBTM’s yield is a mere 0.32%, despite a modest payout ratio (~15%), signaling limited dividend focus. Its larger buyback program is offset by weaker margins and volatile free cash flow. Historically in industrials, dividend stability plus buybacks drive superior compounding. I favor DOV for a balanced, enduring total return profile in 2026.
Comparative Score Analysis: The Strategic Profile
The radar chart reveals the fundamental DNA and trade-offs of both Dover Corporation and JBT Marel Corporation:
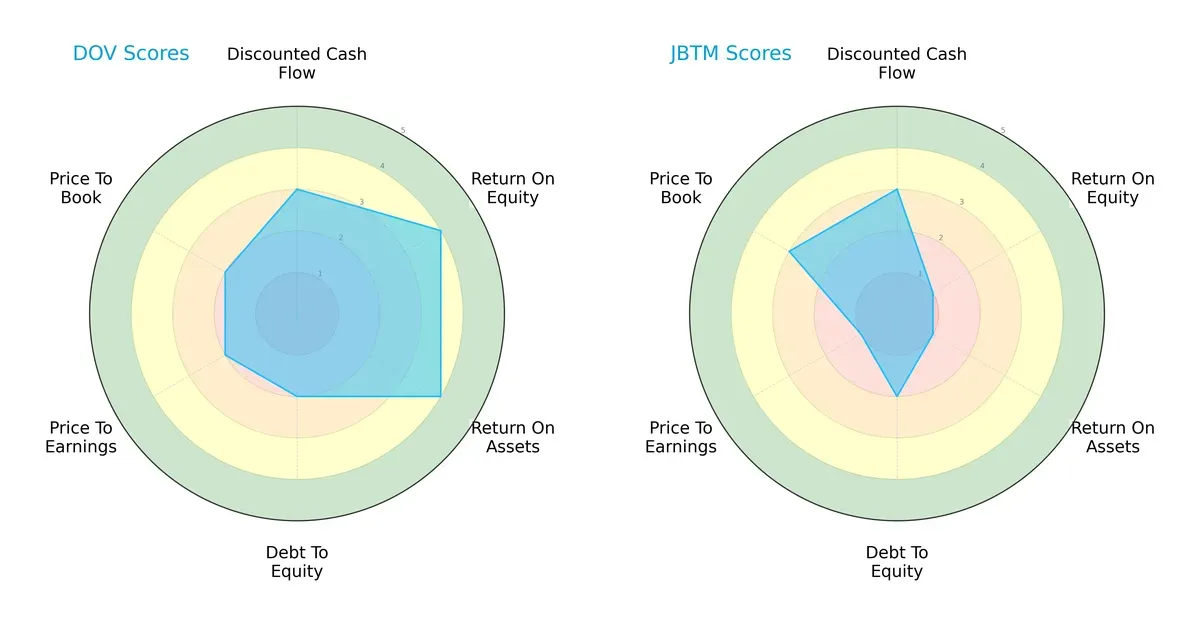
Dover shows a balanced profile with strong ROE and ROA scores (4 each), signaling efficient profit generation and asset utilization. JBT Marel relies heavily on a slightly better Price-to-Book score (3) but lags in profitability metrics, scoring 1 in both ROE and ROA. Dover’s moderate Debt/Equity and valuation scores (2) contrast with JBT’s similar leverage but weaker earnings multiples. Overall, Dover presents a more robust and balanced investment case.
Bankruptcy Risk: Solvency Showdown
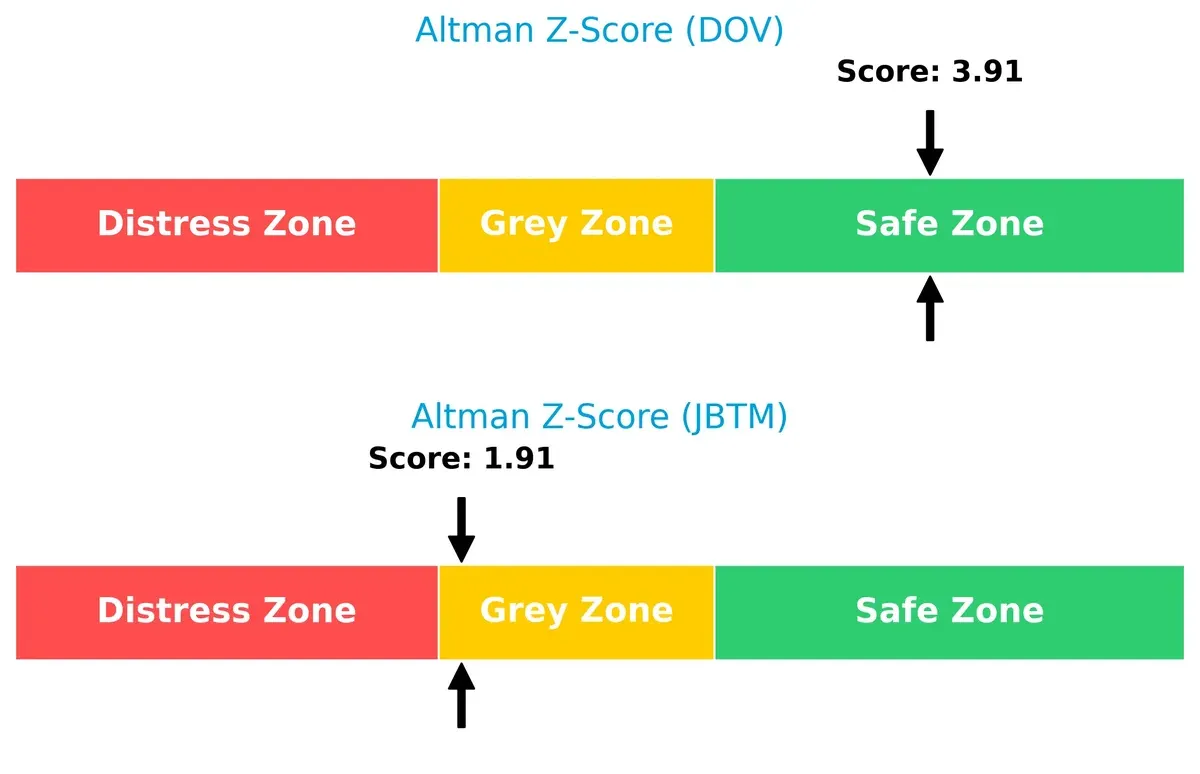
Dover’s Altman Z-Score of 3.91 places it securely in the safe zone, while JBT Marel’s 1.91 signals a grey zone risk, implying moderate bankruptcy risk amid current market pressures:
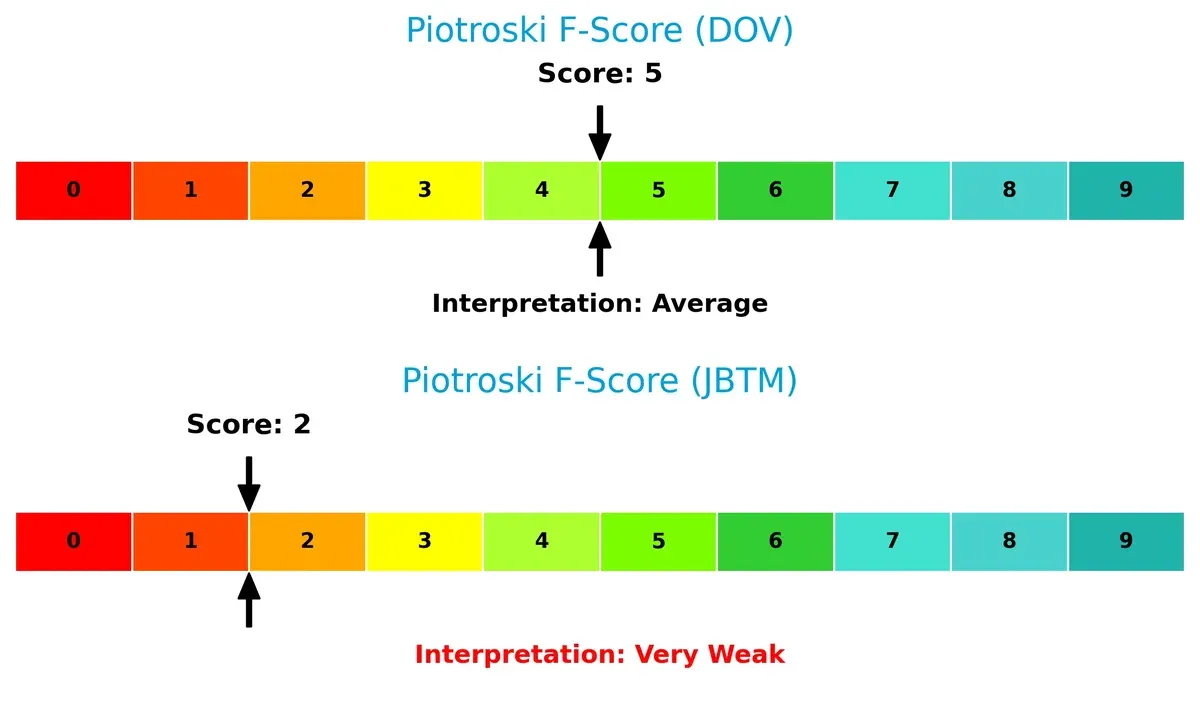
Financial Health: Quality of Operations
Dover’s Piotroski score of 5 indicates average financial health, outperforming JBT Marel’s very weak score of 2. This gap highlights potential red flags in JBT Marel’s internal operations and financial quality:
How are the two companies positioned?
This section dissects the operational DNA of Dover and JBT Marel by comparing their revenue distribution and internal strengths and weaknesses. The final goal is to confront their economic moats and identify which business model offers the most resilient competitive advantage today.
Revenue Segmentation: The Strategic Mix
This visual comparison dissects how Dover Corporation and JBT Marel Corporation diversify their income streams and where their primary sector bets lie:
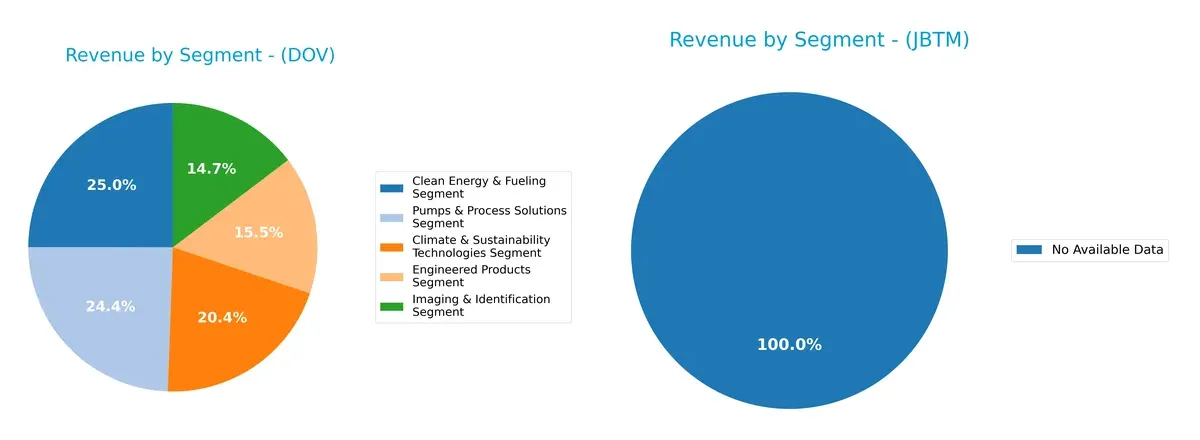
Dover Corporation shows a balanced revenue mix across five key segments, with Clean Energy & Fueling at $1.94B and Pumps & Process Solutions close behind at $1.89B. This diversification contrasts sharply with JBT Marel Corporation, which lacks segment data here. Dover’s broad base mitigates concentration risk and supports resilience, leveraging ecosystem lock-in across industrial and sustainability technologies. JBT’s absence of data prevents a direct comparison but suggests less transparency or narrower focus.
Strengths and Weaknesses Comparison
This table compares the Strengths and Weaknesses of Dover Corporation and JBT Marel Corporation:
Dover Corporation Strengths
- Diversified revenue streams across five segments
- Strong net margin at 13.52%
- Favorable debt-to-assets and interest coverage ratios
- Significant global presence including US, Europe, Asia
- Neutral P/E ratio indicates reasonable valuation
JBT Marel Corporation Strengths
- Favorable WACC at 7.53% supports efficient capital use
- Strong fixed asset turnover at 7.34 indicates productive assets
- Favorable quick ratio and interest coverage show liquidity and solvency
- Neutral debt-to-assets ratio reflects balanced leverage
Dover Corporation Weaknesses
- Unfavorable ROE and ROIC at 0% highlight return issues
- Unavailable WACC limits cost of capital insight
- Unfavorable current and quick ratios suggest liquidity concerns
- Unfavorable asset turnover metrics indicate inefficiency
- Zero PB ratio may reflect accounting or market valuation quirks
JBT Marel Corporation Weaknesses
- Low net margin at 4.98% limits profitability
- Unfavorable ROE and ROIC indicate weak returns
- High P/E ratio of 47.63 may imply overvaluation risk
- Unfavorable current ratio signals short-term liquidity weakness
- Low dividend yield at 0.32% may deter income investors
Dover’s broad diversification and strong margins contrast with JBT Marel’s asset efficiency and capital cost advantages. Both face profitability and liquidity challenges that may impact strategic flexibility.
The Moat Duel: Analyzing Competitive Defensibility
A structural moat is the only barrier protecting long-term profits from relentless competition erosion. Let’s dissect how Dover and JBT Marel defend their turf:
Dover Corporation: Diversified Industrial Solutions Moat
Dover’s moat stems from its broad portfolio and intangible assets, supporting steady gross margins near 40%. Margin stability faces pressure from slowing EBIT and net income growth in 2025, signaling potential challenges ahead.
JBT Marel Corporation: Specialized Food Technology Moat
JBT Marel’s moat relies on product specialization and niche market expertise, yet it suffers from a weaker EBIT margin (6.7%) and declining ROIC below WACC, indicating shrinking value creation and operational stress.
Verdict: Diversification Strength vs. Niche Vulnerability
Dover’s wider moat benefits from diversified industrial segments and stronger margin profiles. JBT Marel’s narrower moat shows vulnerability with deteriorating profitability and value destruction. Dover is better positioned to defend market share in evolving industrial landscapes.
Which stock offers better returns?
Over the past 12 months, both Dover Corporation and JBT Marel Corporation experienced significant price appreciation, with notable acceleration in their bullish trends and increasing trading volumes.
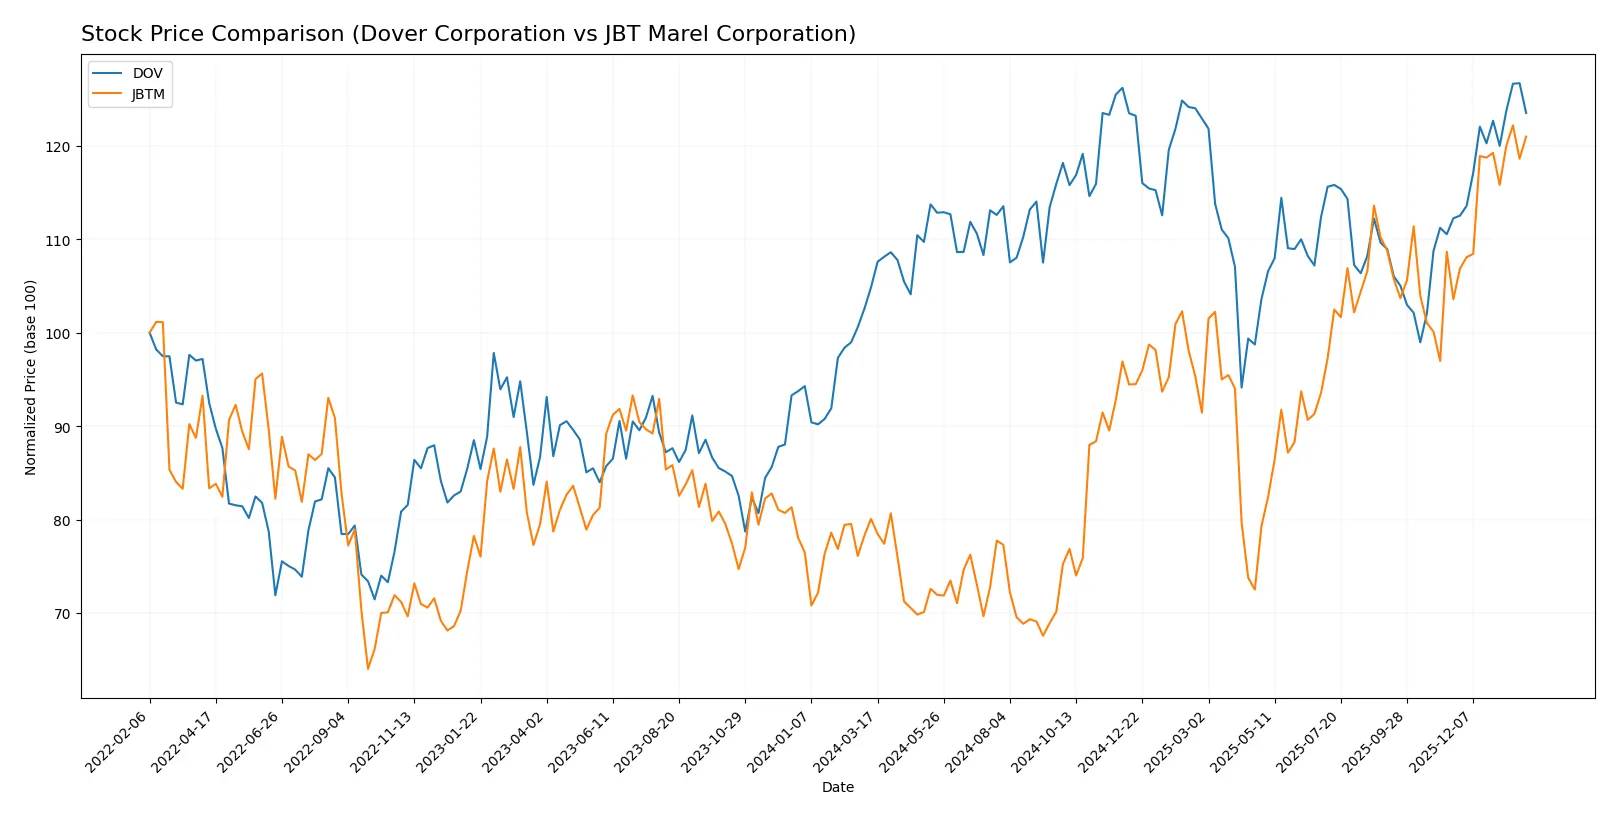
Trend Comparison
Dover Corporation’s stock rose 17.81% over the past year, showing acceleration in its bullish trend with a high of 206.71 and low of 153.55. Volatility remains moderate with an 11.33 standard deviation.
JBT Marel Corporation outperformed with a 51.1% price gain, also accelerating bullishly. It reached a high of 158.88 and low of 87.85, but with a higher volatility of 20.23 standard deviation.
JBT Marel delivered the stronger market performance, outperforming Dover by over 30 percentage points, despite its greater volatility over the past year.
Target Prices
Analysts present a clear target price consensus for Dover Corporation and JBT Marel Corporation.
| Company | Target Low | Target High | Consensus |
|---|---|---|---|
| Dover Corporation | 195 | 256 | 221.38 |
| JBT Marel Corporation | 169 | 180 | 174.5 |
The target consensus for Dover exceeds its current price of 201.49, signaling moderate upside potential. JBT Marel’s consensus at 174.5 also suggests room for price appreciation from 157.31.

Don’t Let Luck Decide Your Entry Point
Optimize your entry points with our advanced ProRealTime indicators. You’ll get efficient buy signals with precise price targets for maximum performance. Start outperforming now!
How do institutions grade them?
Dover Corporation Grades
The following table summarizes recent grades assigned to Dover Corporation by major firms.
| Grading Company | Action | New Grade | Date |
|---|---|---|---|
| JP Morgan | Maintain | Overweight | 2026-01-30 |
| Wells Fargo | Maintain | Equal Weight | 2026-01-30 |
| RBC Capital | Maintain | Sector Perform | 2026-01-30 |
| Oppenheimer | Maintain | Outperform | 2026-01-26 |
| JP Morgan | Maintain | Overweight | 2026-01-16 |
| Barclays | Maintain | Equal Weight | 2026-01-07 |
| Wells Fargo | Maintain | Equal Weight | 2026-01-07 |
| UBS | Upgrade | Buy | 2026-01-05 |
| Wells Fargo | Maintain | Equal Weight | 2025-12-15 |
| Oppenheimer | Maintain | Outperform | 2025-11-14 |
JBT Marel Corporation Grades
Below are the recent grading actions for JBT Marel Corporation by recognized firms.
| Grading Company | Action | New Grade | Date |
|---|---|---|---|
| Jefferies | Upgrade | Buy | 2025-12-10 |
| William Blair | Upgrade | Outperform | 2025-08-06 |
Which company has the best grades?
Dover Corporation shows a broader range of grading companies with mostly stable or positive ratings. JBT Marel has fewer grades but recent upgrades to Buy and Outperform. Investors may view Dover’s consistent Overweight and Outperform grades as a sign of steady confidence. JBT’s upgrades suggest improving sentiment but with less breadth in coverage.
Risks specific to each company
The following categories identify the critical pressure points and systemic threats facing both firms in the 2026 market environment:
1. Market & Competition
Dover Corporation
- Operates in diverse industrial segments, facing broad machinery sector competition.
JBT Marel Corporation
- Focused on food and beverage technology with niche competitors and evolving market needs.
2. Capital Structure & Debt
Dover Corporation
- Strong balance sheet with favorable debt-to-equity metrics and high interest coverage.
JBT Marel Corporation
- Moderate leverage with neutral debt-to-assets; interest coverage adequate but lower than Dover.
3. Stock Volatility
Dover Corporation
- Beta at 1.305 indicates above-market volatility; trading range wider and volume higher.
JBT Marel Corporation
- Beta near 1.0 suggests market-level volatility; narrower price range and lower liquidity.
4. Regulatory & Legal
Dover Corporation
- Exposure to industrial regulations, including clean energy and safety standards.
JBT Marel Corporation
- Subject to food safety and technology compliance across multiple international jurisdictions.
5. Supply Chain & Operations
Dover Corporation
- Complex supply chain across industrial automation and climate tech sectors may face disruption risks.
JBT Marel Corporation
- Global supply chain for food tech components vulnerable to raw material and logistics fluctuations.
6. ESG & Climate Transition
Dover Corporation
- Invests in clean energy solutions, positioning well for climate regulations.
JBT Marel Corporation
- ESG risks tied to food industry sustainability and packaging waste management.
7. Geopolitical Exposure
Dover Corporation
- Primarily US-based with global sales; moderate geopolitical risk.
JBT Marel Corporation
- Operates internationally with diverse regional exposure, increasing geopolitical complexity.
Which company shows a better risk-adjusted profile?
Dover’s strongest risk is its elevated stock volatility and operational complexity, while JBT Marel struggles with weaker profitability and financial health risks. Dover’s solid capital structure, higher Altman Z-Score (3.9 safe zone), and moderate Piotroski score contrast with JBT’s borderline distress signals (Altman 1.9 grey zone, Piotroski 2 very weak). Thus, Dover presents a better risk-adjusted profile despite market volatility. The recent Altman Z-Score divergence sharply highlights JBT’s elevated bankruptcy risk compared to Dover’s financial stability.
Final Verdict: Which stock to choose?
Dover Corporation’s superpower lies in its robust operational efficiency and strong cash generation despite recent margin pressures. Its point of vigilance is the declining profitability trend, which might weigh on growth. Dover fits well within a portfolio focused on steady industrial value and moderate risk tolerance.
JBT Marel Corporation boasts a strategic moat through its specialized equipment niche and solid asset turnover. Its safety profile appears more conservative than Dover’s but with weaker returns and growth signals. JBT suits portfolios targeting niche exposure with a tolerance for volatility and longer-term recovery.
If you prioritize operational strength and established cash flow, Dover outshines with more resilient fundamentals and market presence. However, if you seek niche innovation and are comfortable with a riskier turnaround story, JBT offers a compelling scenario despite value erosion. Both require careful monitoring of profitability trends and capital efficiency.
Disclaimer: Investment carries a risk of loss of initial capital. The past performance is not a reliable indicator of future results. Be sure to understand risks before making an investment decision.
Go Further
I encourage you to read the complete analyses of Dover Corporation and JBT Marel Corporation to enhance your investment decisions: