Home > Comparison > Industrials > IR vs DOV
The strategic rivalry between Ingersoll Rand Inc. and Dover Corporation shapes the industrial machinery sector’s evolution. Ingersoll Rand operates as a diversified industrial technologies provider, while Dover focuses on specialized engineered products and clean energy solutions. This head-to-head reflects a contest between broad industrial integration and niche innovation. This analysis aims to identify which company’s trajectory offers superior risk-adjusted potential for diversified portfolios amid evolving industrial demands.
Table of contents
Companies Overview
Ingersoll Rand and Dover Corporation hold pivotal roles in industrial machinery markets.
Ingersoll Rand Inc.: Industrial Technologies Leader
Ingersoll Rand Inc. dominates industrial air, fluid, and specialty vehicle technologies. It generates revenue through two segments: Industrial Technologies and Services, and Precision and Science Technologies. The company focuses on innovation in air compression, fluid transfer, and precision dosing systems, serving diverse sectors like medical, energy, and manufacturing globally. Its strategic emphasis in 2026 remains on expanding its integrated direct sales and distributor network.
Dover Corporation: Diversified Industrial Solutions Provider
Dover Corporation excels in equipment, software, and service solutions across multiple industrial sectors. Its revenue stems from five segments including Engineered Products, Clean Energy & Fueling, and Climate & Sustainability Technologies. Dover’s 2026 strategy prioritizes advancing clean energy transport, industrial automation, and climate control technologies. It leverages a broad direct and distributor sales model to reach markets worldwide.
Strategic Collision: Similarities & Divergences
Both companies pursue industrial machinery innovation but diverge in scope and focus. Ingersoll Rand emphasizes specialized air and fluid technologies, while Dover spans a wider industrial spectrum including clean energy and automation. Their primary battleground lies in aftermarket services and technological integration. Investment profiles differ: Ingersoll Rand bets on precision niche leadership; Dover aims for diversified growth across industrial ecosystems.
Income Statement Comparison
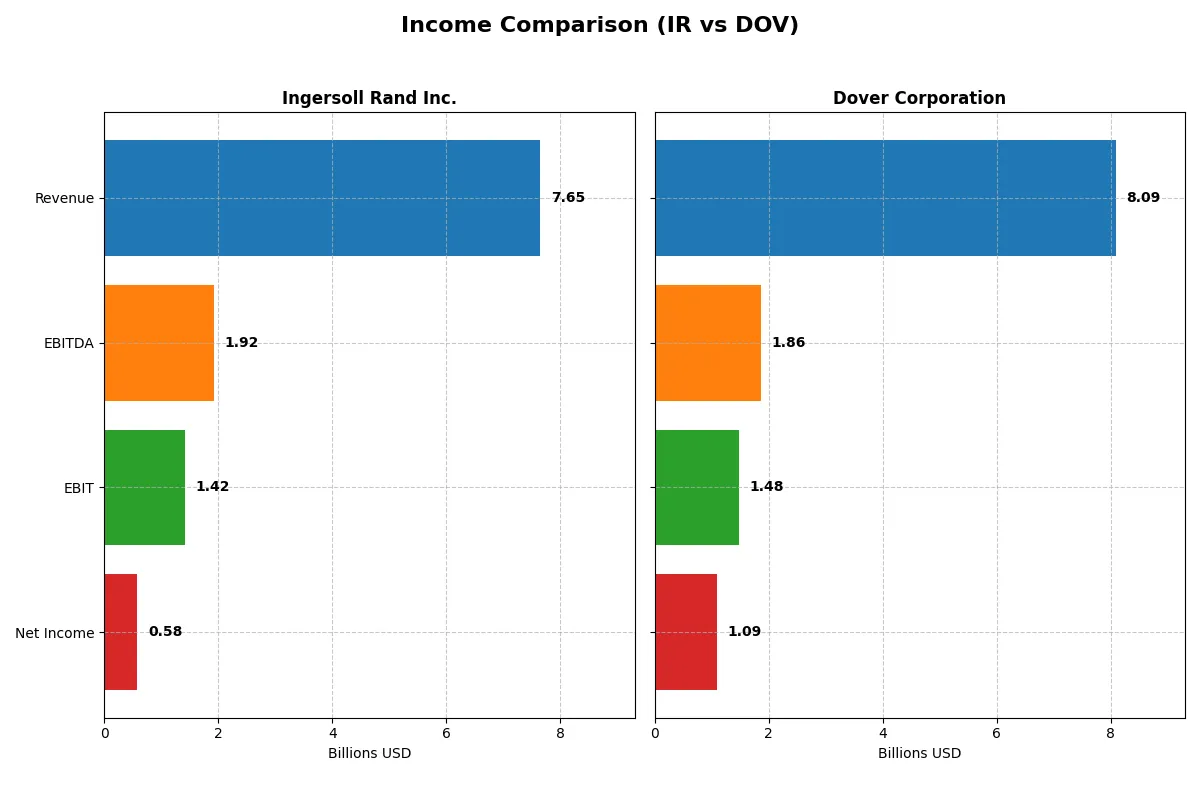
This data dissects the core profitability and scalability of both corporate engines to reveal who dominates the bottom line:
| Metric | Ingersoll Rand Inc. (IR) | Dover Corporation (DOV) |
|---|---|---|
| Revenue | 7.65B | 8.09B |
| Cost of Revenue | 4.70B | 4.87B |
| Operating Expenses | 1.53B | 1.84B |
| Gross Profit | 2.95B | 3.22B |
| EBITDA | 1.92B | 1.86B |
| EBIT | 1.42B | 1.48B |
| Interest Expense | 254M | 110M |
| Net Income | 581M | 1.09B |
| EPS | 1.46 | 7.97 |
| Fiscal Year | 2025 | 2025 |
Income Statement Analysis: The Bottom-Line Duel
This income statement comparison reveals which company’s financial engine runs more efficiently and delivers stronger shareholder value.
Ingersoll Rand Inc. Analysis
Ingersoll Rand’s revenue climbed steadily from $5.15B in 2021 to $7.65B in 2025, marking a 48.5% growth over five years. Net income showed modest growth, reaching $581M in 2025. Despite a dip in gross profit last year, the company maintains healthy gross (38.5%) and net margins (7.6%). Efficiency improved with EBIT rising 5.4% in 2025, though net margin contracted due to higher expenses.
Dover Corporation Analysis
Dover’s revenue increased slightly from $7.9B in 2021 to $8.1B in 2025, a modest 2.4% growth. Net income declined overall, falling to $1.09B in 2025 from a $2.7B peak in 2024 due to discontinued operations skewing prior results. The company sustains strong gross margin (39.8%) and net margin (13.5%), but EBIT dropped 21.4% last year, signaling margin pressure amidst rising operating costs.
Margin Stability vs. Revenue Growth
Ingersoll Rand leads with robust revenue growth and improving operating efficiency, despite some margin volatility. Dover shows stronger current margins but struggles with net income consistency and slower top-line growth. For investors, Ingersoll Rand offers a growth-oriented profile, while Dover presents a higher-margin but more volatile earnings history.
Financial Ratios Comparison
These vital ratios act as a diagnostic tool to expose the underlying fiscal health, valuation premiums, and capital efficiency of the companies analyzed:
| Ratios | Ingersoll Rand Inc. (IR) | Dover Corporation (DOV) |
|---|---|---|
| ROE | 5.8% | 14.8% |
| ROIC | 6.4% | 9.4% |
| P/E | 54.2x | 24.5x |
| P/B | 3.13x | 3.62x |
| Current Ratio | 2.06 | 1.79 |
| Quick Ratio | 1.49 | 1.28 |
| D/E (Debt-to-Equity) | 0.47 | 0.45 |
| Debt-to-Assets | 26.1% | 24.8% |
| Interest Coverage | 5.58x | 12.51x |
| Asset Turnover | 0.42 | 0.60 |
| Fixed Asset Turnover | 8.22 | 7.23 |
| Payout ratio | 5.5% | 25.9% |
| Dividend yield | 0.10% | 1.06% |
| Fiscal Year | 2025 | 2025 |
Efficiency & Valuation Duel: The Vital Signs
Financial ratios serve as a company’s DNA, exposing hidden risks and operational strengths that underpin investment decisions.
Ingersoll Rand Inc.
Ingersoll Rand posts a modest 5.76% ROE and a 7.6% net margin, signaling moderate profitability. The stock trades at a stretched P/E of 54.24, suggesting overvaluation versus peers. Shareholder returns remain limited with a low 0.1% dividend yield, reflecting a cautious reinvestment focus rather than aggressive buybacks.
Dover Corporation
Dover delivers robust profitability with a 14.77% ROE and a 13.52% net margin, highlighting operational efficiency. Its P/E of 24.49 appears reasonable, balancing valuation and growth prospects. Dover supports shareholders with a 1.06% dividend yield, indicating consistent income alongside potential reinvestment for steady expansion.
Valuation Stretch vs. Profitability Strength
Dover offers a superior blend of profitability and fair valuation, contrasting Ingersoll Rand’s stretched multiples and weaker returns. Investors favoring operational strength and income will likely lean toward Dover, while those wary of valuation risk might approach Ingersoll Rand with caution.
Which one offers the Superior Shareholder Reward?
I see that Dover Corporation delivers a far superior shareholder reward compared to Ingersoll Rand Inc. Dover pays a strong dividend yield above 1%, backed by a payout ratio near 26%, signaling a balanced distribution of cash. Its buyback activity complements dividends, boosting total returns sustainably. In contrast, Ingersoll Rand’s dividend yield barely hits 0.1% with a meager payout ratio under 6%, relying heavily on modest buybacks. Dover’s robust free cash flow coverage and capital allocation to dividends plus buybacks reveal a mature, shareholder-friendly policy. I conclude Dover offers the more attractive total return profile for 2026 investors seeking income and growth.
Comparative Score Analysis: The Strategic Profile
The radar chart reveals the fundamental DNA and trade-offs of Ingersoll Rand Inc. and Dover Corporation, highlighting their core financial strengths and weaknesses:
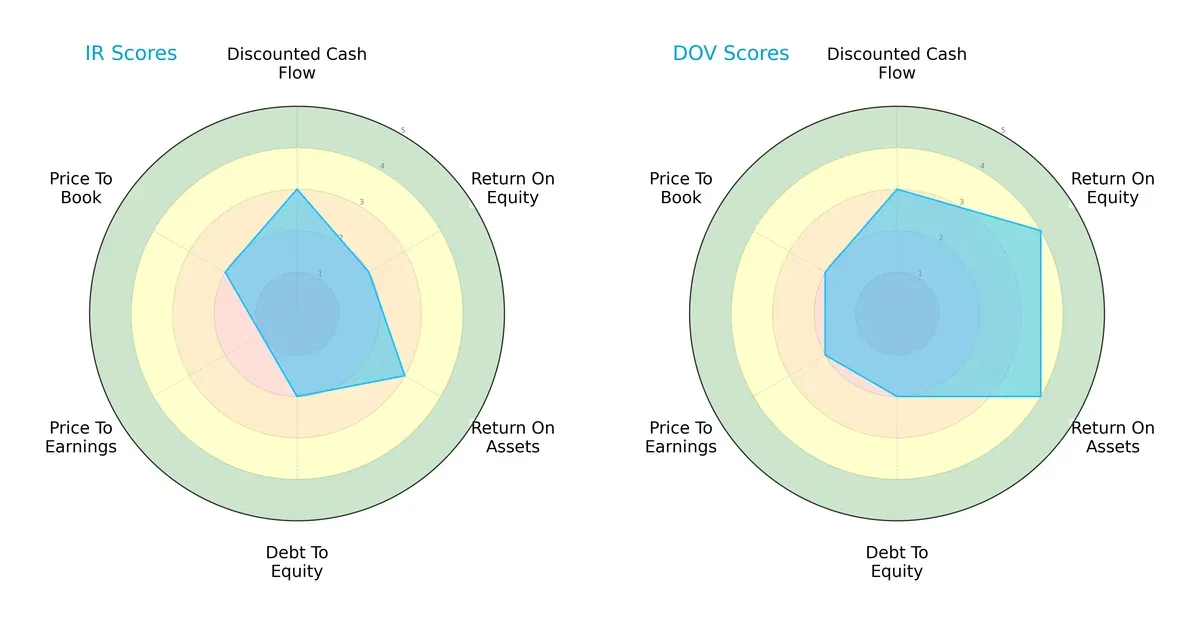
Dover presents a more balanced profile, excelling in profitability with ROE and ROA scores of 4 each, compared to Ingersoll Rand’s moderate 2 and 3. Both firms share similar DCF scores (3) and debt-to-equity risk (2), but Ingersoll Rand’s valuation metrics lag, notably with a very unfavorable P/E score of 1. Dover’s slightly better valuation scores suggest it manages market expectations more efficiently.
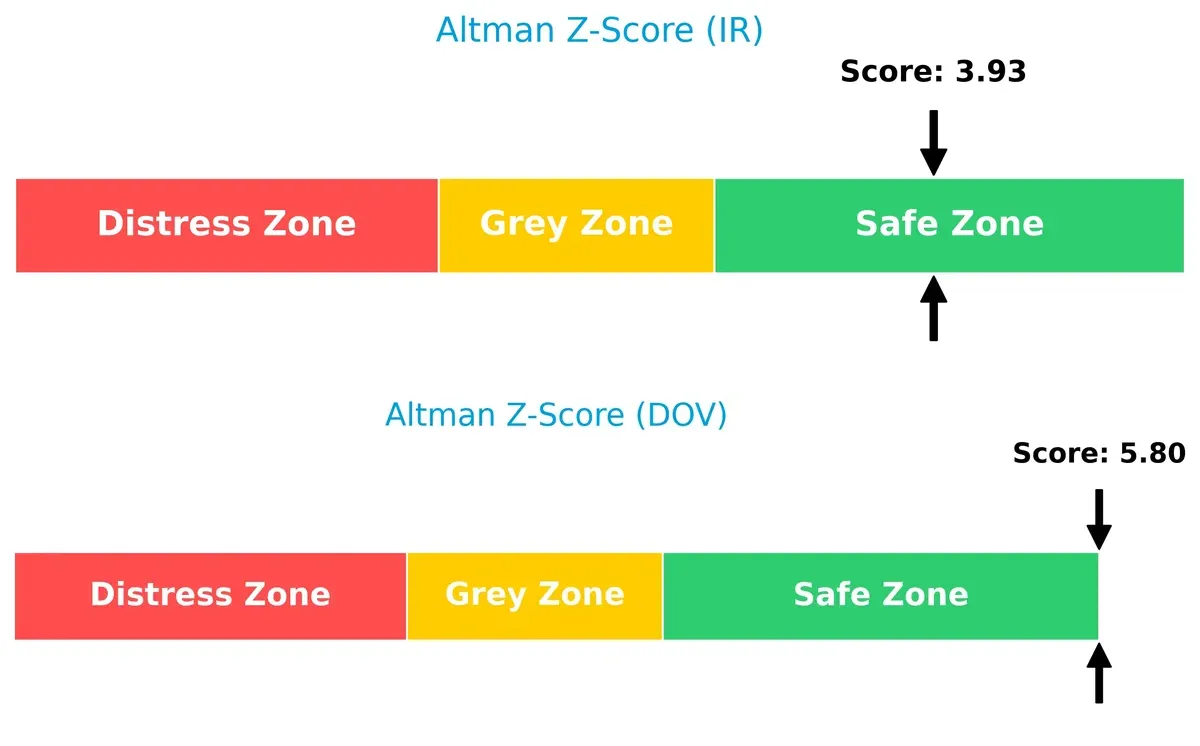
Bankruptcy Risk: Solvency Showdown
Dover’s Altman Z-Score of 5.8 firmly places it in the safe zone, surpassing Ingersoll Rand’s solid 3.9 score, indicating stronger long-term solvency for Dover in this economic cycle:
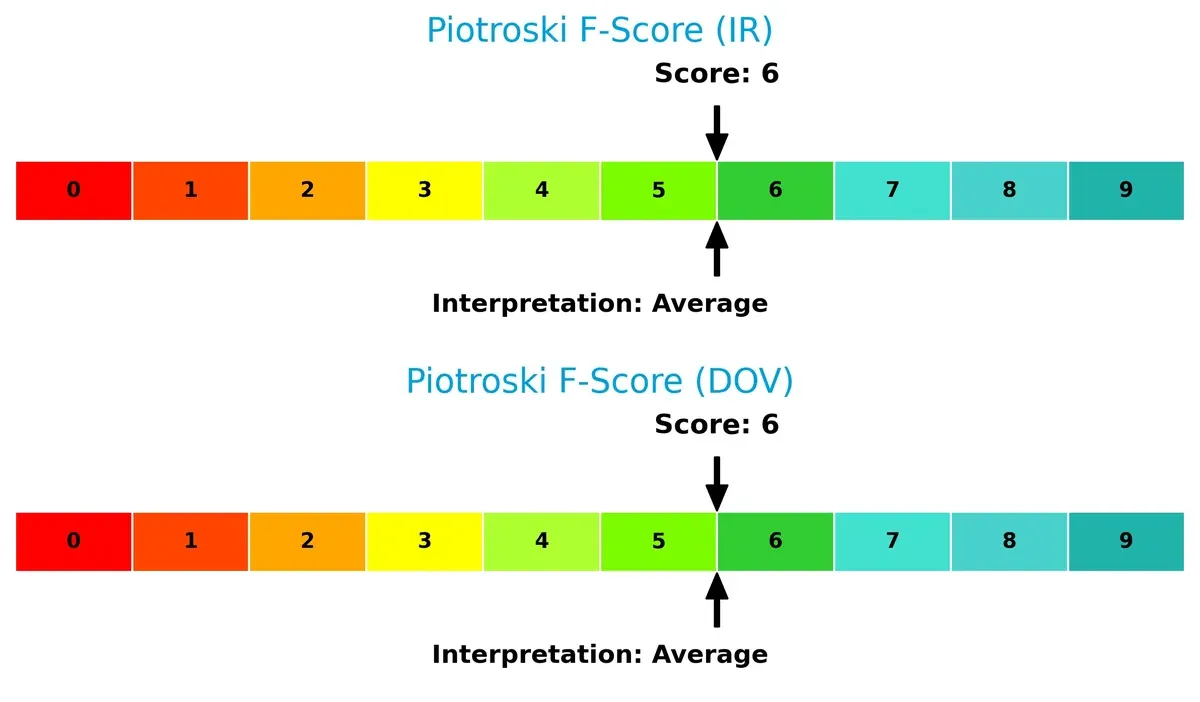
Financial Health: Quality of Operations
Both companies score an average 6 on the Piotroski F-Score, showing moderate financial health without glaring internal red flags. Neither firm demonstrates peak operational strength, suggesting room for improvement in efficiency and quality metrics:
How are the two companies positioned?
This section dissects IR and DOV’s operational DNA by comparing revenue distribution and internal dynamics. The goal is to confront their economic moats to reveal the more resilient, sustainable competitive advantage today.
Revenue Segmentation: The Strategic Mix
This visual comparison dissects how Ingersoll Rand and Dover diversify their income streams and where their primary sector bets lie:
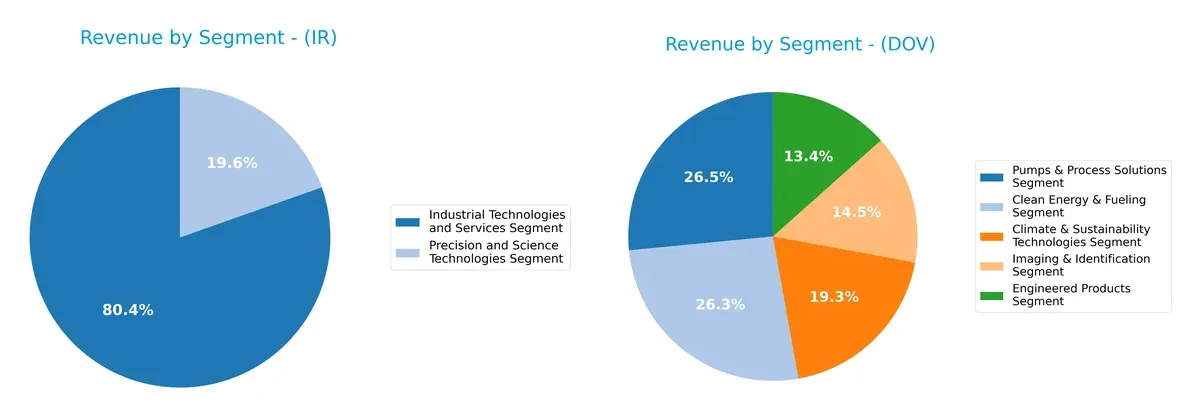
Ingersoll Rand anchors revenue in Industrial Technologies and Services with $5.8B in 2024, while its Precision and Science segment lags at $1.4B. Dover displays a far more diversified mix with five segments each contributing over $1B, ranging from Clean Energy & Fueling at $2.1B to Engineered Products at $1.1B. Dover’s broad portfolio reduces concentration risk, whereas Ingersoll Rand’s reliance on a dominant segment poses potential vulnerability but suggests focused expertise in industrial infrastructure.
Strengths and Weaknesses Comparison
This table compares the Strengths and Weaknesses of Ingersoll Rand Inc. and Dover Corporation:
Ingersoll Rand Inc. Strengths
- Favorable liquidity ratios with current ratio 2.06 and quick ratio 1.49
- Low debt-to-assets at 26.15% with solid interest coverage of 5.58
- Diversified industrial and precision technology segments
- Strong global presence across Americas, EMEA, and Asia Pacific
Dover Corporation Strengths
- Higher net margin at 13.52% indicating better profitability
- Favorable interest coverage ratio at 13.52
- Diverse revenue streams across five segments including clean energy and pumps
- Broad geographic footprint including US, Europe, Asia, and other regions
Ingersoll Rand Inc. Weaknesses
- Unfavorable ROE at 5.76% below cost of capital
- High P/E ratio at 54.24 suggesting expensive valuation
- Asset turnover at 0.42 is weak, limiting efficiency
- Low dividend yield at 0.1% may deter income investors
Dover Corporation Weaknesses
- Unfavorable price-to-book ratio at 3.62
- ROE neutral but below sector leaders
- Net margin and ROIC neutral despite favorable ratios
- Dividend yield moderate at 1.06%, less appealing for yield-focused investors
Ingersoll Rand holds strength in liquidity and conservative leverage but faces challenges in profitability and operational efficiency. Dover excels in profitability and segment diversity, though valuation and return metrics show room for improvement. These contrasts highlight differing strategic focuses in financial and operational management.
The Moat Duel: Analyzing Competitive Defensibility
A structural moat is the only reliable shield protecting long-term profits from relentless competition erosion. Let’s dissect two industrial giants’ moats:
Ingersoll Rand Inc.: Niche Expertise and Innovation Moat
Ingersoll Rand leverages intangible assets and specialized technology, delivering strong margin stability despite a slightly unfavorable ROIC vs. WACC. Expanding precision fluid technologies could deepen its moat in 2026.
Dover Corporation: Scale and Diversification Moat
Dover’s cost advantage stems from broad product diversification and scale, yet its declining ROIC signals weakening efficiency. Market disruptions in clean energy tech pose both risks and growth opportunities in 2026.
Verdict: Specialized Innovation vs. Scale Efficiency
Ingersoll Rand’s growing ROIC trend suggests a deeper moat rooted in innovation, while Dover’s scale shows strain amid declining profitability. IR is better poised to defend its market share long term.
Which stock offers better returns?
The past year shows both stocks gaining, with Dover’s price rallying more sharply and Ingersoll Rand accelerating steadily since late 2025.
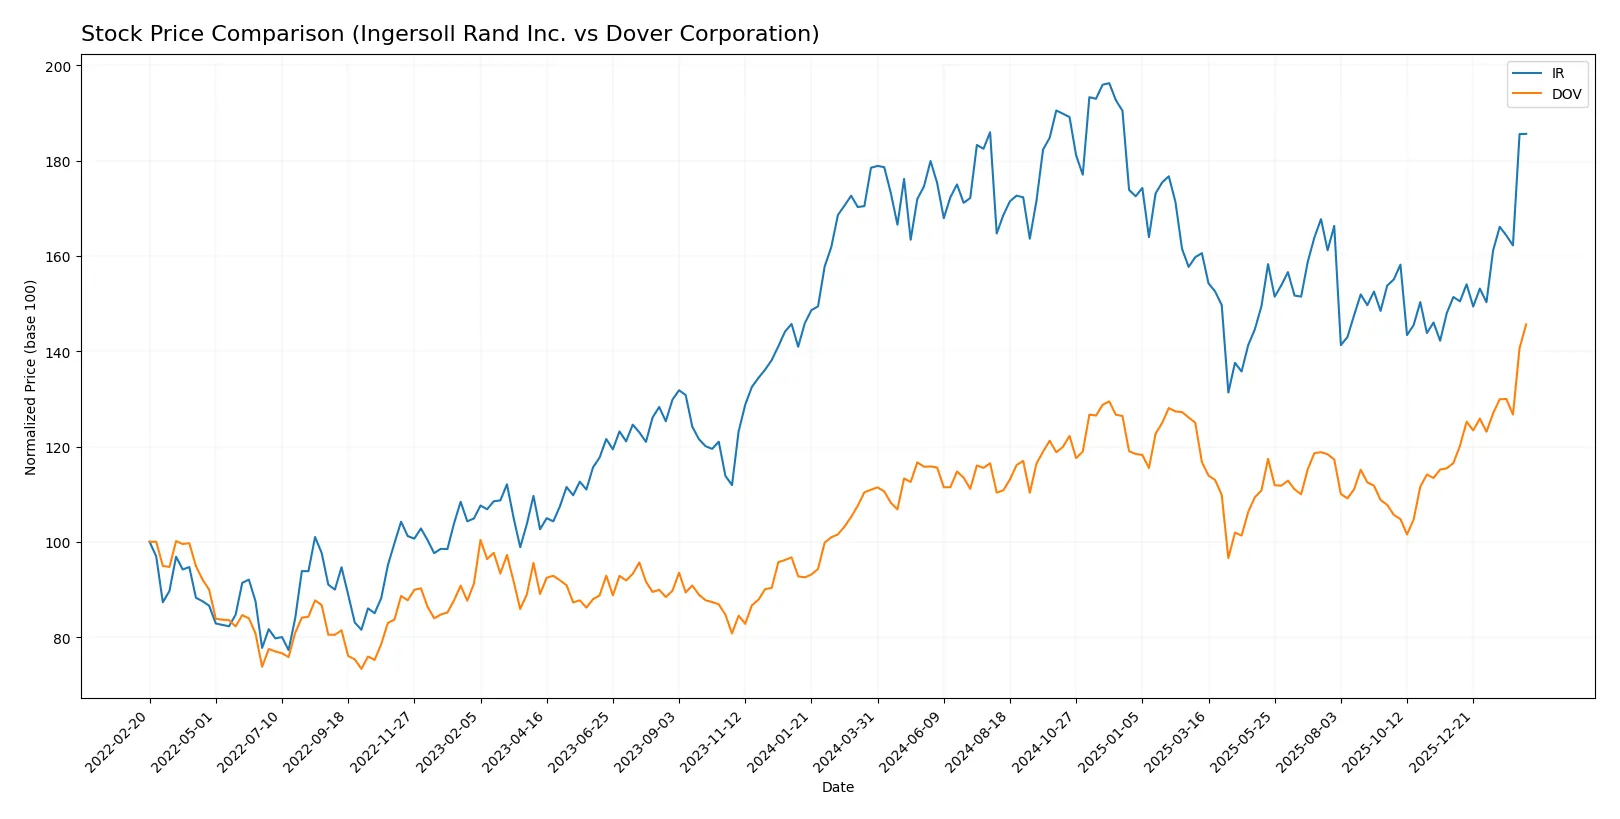
Trend Comparison
Ingersoll Rand’s stock rose 4.0% over the last 12 months, marking a bullish trend with accelerating momentum and a price range between 69.7 and 104.17. Recent gains intensified by 22.6% from November 2025 to February 2026.
Dover’s stock surged 31.3% over the same period, demonstrating a pronounced bullish trend with higher volatility and acceleration. It ranged from 153.55 to 231.63, gaining 25.0% in the recent quarter ending February 2026.
Dover outperformed Ingersoll Rand by a wide margin, delivering stronger price appreciation and sharper acceleration, thus leading market performance in the analyzed timeframe.
Target Prices
Analysts show a confident target consensus for both Ingersoll Rand Inc. and Dover Corporation.
| Company | Target Low | Target High | Consensus |
|---|---|---|---|
| Ingersoll Rand Inc. | 87 | 100 | 93 |
| Dover Corporation | 195 | 256 | 223.7 |
The target consensus for Ingersoll Rand suggests modest upside from its current price of 98.52 USD. Dover’s consensus indicates potential gains above its current 231.63 USD price, reflecting strong analyst optimism.

Don’t Let Luck Decide Your Entry Point
Optimize your entry points with our advanced ProRealTime indicators. You’ll get efficient buy signals with precise price targets for maximum performance. Start outperforming now!
How do institutions grade them?
Ingersoll Rand Inc. Grades
The following table summarizes recent grades from major financial institutions for Ingersoll Rand Inc.:
| Grading Company | Action | New Grade | Date |
|---|---|---|---|
| Stifel | Maintain | Hold | 2026-01-23 |
| Citigroup | Maintain | Buy | 2026-01-12 |
| Wells Fargo | Maintain | Overweight | 2026-01-07 |
| Stifel | Maintain | Hold | 2025-12-16 |
| Citigroup | Maintain | Buy | 2025-12-08 |
| Citigroup | Maintain | Buy | 2025-11-03 |
| Baird | Maintain | Outperform | 2025-11-03 |
| Stifel | Maintain | Hold | 2025-10-20 |
| Wells Fargo | Maintain | Overweight | 2025-10-06 |
| Morgan Stanley | Maintain | Equal Weight | 2025-08-13 |
Dover Corporation Grades
The following table summarizes recent grades from major financial institutions for Dover Corporation:
| Grading Company | Action | New Grade | Date |
|---|---|---|---|
| JP Morgan | Maintain | Overweight | 2026-01-30 |
| Wells Fargo | Maintain | Equal Weight | 2026-01-30 |
| RBC Capital | Maintain | Sector Perform | 2026-01-30 |
| Oppenheimer | Maintain | Outperform | 2026-01-26 |
| JP Morgan | Maintain | Overweight | 2026-01-16 |
| Barclays | Maintain | Equal Weight | 2026-01-07 |
| Wells Fargo | Maintain | Equal Weight | 2026-01-07 |
| UBS | Upgrade | Buy | 2026-01-05 |
| Wells Fargo | Maintain | Equal Weight | 2025-12-15 |
| Oppenheimer | Maintain | Outperform | 2025-11-14 |
Which company has the best grades?
Dover Corporation generally receives more positive grades, including multiple Overweight and Outperform ratings with upgrades. Ingersoll Rand shows mostly Hold and Buy grades but fewer top-tier ratings. This suggests stronger institutional confidence in Dover, potentially influencing investor sentiment accordingly.
Risks specific to each company
The following categories identify critical pressure points and systemic threats facing Ingersoll Rand Inc. and Dover Corporation in the 2026 market environment:
1. Market & Competition
Ingersoll Rand Inc.
- Faces intense competition in industrial technologies with moderate net margin (7.6%) and below-average ROE (5.76%).
Dover Corporation
- Benefits from stronger net margin (13.52%) and ROE (14.77%), indicating better competitive positioning.
2. Capital Structure & Debt
Ingersoll Rand Inc.
- Maintains favorable debt metrics with debt-to-assets at 26.15% and interest coverage of 5.58x.
Dover Corporation
- Slightly lower debt-to-assets at 24.79% and superior interest coverage at 13.52x, indicating stronger debt servicing ability.
3. Stock Volatility
Ingersoll Rand Inc.
- Beta at 1.309 suggests slightly higher volatility than the market average.
Dover Corporation
- Beta at 1.289 indicates marginally lower stock volatility compared to IR.
4. Regulatory & Legal
Ingersoll Rand Inc.
- Exposed to regulatory risks in multiple global regions, especially in environmental compliance.
Dover Corporation
- Faces regulatory scrutiny in clean energy and industrial automation sectors, requiring ongoing adaptation.
5. Supply Chain & Operations
Ingersoll Rand Inc.
- Operations span diverse geographies, vulnerable to supply chain disruptions affecting industrial machinery.
Dover Corporation
- Complex global supply chain with exposure to high-tech component shortages in engineered products segments.
6. ESG & Climate Transition
Ingersoll Rand Inc.
- Moderate ESG risks; climate transition pressures impact energy and fluid technology segments.
Dover Corporation
- Higher ESG focus with climate and sustainability technologies segment, but risks in meeting evolving regulations.
7. Geopolitical Exposure
Ingersoll Rand Inc.
- Significant exposure to emerging markets and geopolitical tensions in Asia-Pacific and Middle East.
Dover Corporation
- Diverse geographic footprint but more concentrated in North America and Europe, reducing some geopolitical risks.
Which company shows a better risk-adjusted profile?
Dover’s strongest risk is regulatory and supply chain complexity, while Ingersoll Rand faces critical market competition and geopolitical risks. Dover’s higher profitability, stronger debt coverage, and safer Altman Z-score (5.8 vs. 3.9) yield a better risk-adjusted profile. Ingersoll Rand’s elevated P/E and weaker ROE signal valuation and operational concerns. Recent data highlight Dover’s superior interest coverage ratio (13.52x vs. 5.58x), underscoring financial resilience amid uncertain markets.
Final Verdict: Which stock to choose?
Ingersoll Rand Inc. excels as a cash-generating industrial powerhouse with a firm grip on operational efficiency. Its growing profitability trend offsets concerns about value destruction, but investors should watch its high valuation multiples and modest returns. It suits portfolios aiming for aggressive growth with an appetite for cyclical risks.
Dover Corporation boasts a strategic moat through superior returns on capital and robust operating cash flows. Its stronger safety profile and steady dividend yield provide a cushion against market volatility compared to Ingersoll Rand. Dover fits well within a GARP (Growth at a Reasonable Price) portfolio seeking balanced growth and income.
If you prioritize aggressive expansion and can tolerate elevated valuation metrics, Ingersoll Rand outshines as a growth engine with improving profitability. However, if you seek better stability and a proven capital efficiency moat, Dover offers superior risk-adjusted returns and financial resilience, commanding a premium for its safer profile.
Disclaimer: Investment carries a risk of loss of initial capital. The past performance is not a reliable indicator of future results. Be sure to understand risks before making an investment decision.
Go Further
I encourage you to read the complete analyses of Ingersoll Rand Inc. and Dover Corporation to enhance your investment decisions: