Home > Comparison > Industrials > ITW vs DOV
The strategic rivalry between Illinois Tool Works Inc. and Dover Corporation shapes the industrial machinery sector’s competitive landscape. Illinois Tool Works operates a diversified, capital-intensive model spanning automotive OEM, food equipment, and specialty products. Dover Corporation focuses on engineered products and clean energy solutions with a strong emphasis on software and aftermarket services. This analysis explores which operational approach delivers superior risk-adjusted returns for a diversified portfolio amid evolving industrial demands.
Table of contents
Companies Overview
Illinois Tool Works and Dover Corporation stand as influential players in the industrial machinery sector, shaping global manufacturing trends.
Illinois Tool Works Inc.: Diversified Industrial Innovator
Illinois Tool Works Inc. commands a diverse industrial machinery market with seven segments including Automotive OEM and Food Equipment. Its core revenue derives from manufacturing components, equipment, and consumables for automotive, food, and construction industries. In 2026, it focuses strategically on expanding its specialty products and enhancing direct distribution channels to sustain competitive advantage.
Dover Corporation: Specialized Equipment Leader
Dover Corporation excels in providing specialized equipment and digital solutions across multiple industrial markets such as Clean Energy and Engineered Products. It generates revenue from equipment sales, aftermarket parts, and software services. The 2026 strategy emphasizes growth in climate technologies and integrated digital offerings to capture evolving industrial automation and sustainability demands.
Strategic Collision: Similarities & Divergences
Both firms prioritize innovation within the industrial machinery sector but diverge in scope and approach. Illinois Tool Works adopts a broad, multi-segment diversification, while Dover targets niche markets with integrated hardware-software solutions. Their competitive battleground lies in advanced equipment and service integration. Their investment profiles contrast sharply: ITW offers stability through scale, Dover leverages specialized growth opportunities.
Income Statement Comparison
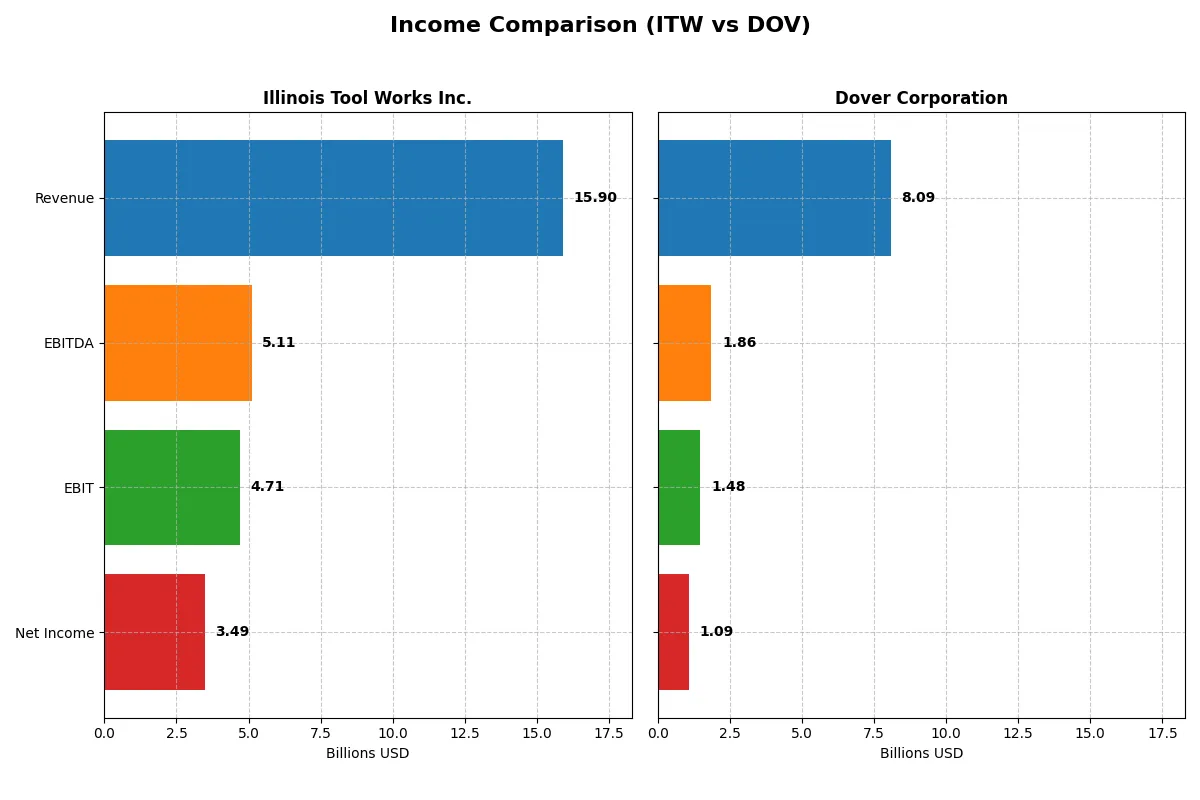
This data dissects the core profitability and scalability of both corporate engines to reveal who dominates the bottom line:
| Metric | Illinois Tool Works Inc. (ITW) | Dover Corporation (DOV) |
|---|---|---|
| Revenue | 15.9B | 7.7B |
| Cost of Revenue | 8.96B | 4.79B |
| Operating Expenses | 2.68B | 1.75B |
| Gross Profit | 6.94B | 2.96B |
| EBITDA | 5.11B | 2.23B |
| EBIT | 4.71B | 1.89B |
| Interest Expense | 0.28B | 0.13B |
| Net Income | 3.49B | 2.70B |
| EPS | 11.75 | 19.58 |
| Fiscal Year | 2024 | 2024 |
Income Statement Analysis: The Bottom-Line Duel
This income statement comparison uncovers which company runs its operations with superior efficiency and sustainable profitability.
Illinois Tool Works Inc. Analysis
Illinois Tool Works (ITW) shows a robust revenue growth of 26% over five years, despite a slight 1.3% dip in 2024. Net income surged 65%, supported by a strong net margin of 21.9%, reflecting excellent cost control. The 2024 EBIT margin climbed to nearly 30%, indicating accelerating operational efficiency and margin expansion momentum.
Dover Corporation Analysis
Dover Corporation (DOV) recorded modest revenue growth of 2.4% over the last five years, with a 4.5% rise in 2025. However, net income declined 2.7%, dragged down by a sharp 61% net margin drop in the latest year to 13.5%. EBIT margin fell to 18.3%, signaling margin compression and operational challenges despite favorable gross margin levels near 40%.
Margin Strength vs. Growth Resilience
ITW clearly leads with stronger margin profiles and impressive net income growth, reflecting disciplined capital allocation and cost management. Dover’s revenue growth is steady but offset by declining profitability and margin pressures. For investors prioritizing durable earnings and margin expansion, ITW offers a more compelling and resilient financial profile.
Financial Ratios Comparison
These vital ratios act as a diagnostic tool to expose the underlying fiscal health, valuation premiums, and capital efficiency of each company:
| Ratios | Illinois Tool Works Inc. (ITW) | Dover Corporation (DOV) |
|---|---|---|
| ROE | 105.2% | N/A |
| ROIC | 27.2% | N/A |
| P/E | 21.6 | 24.5 |
| P/B | 22.7 | 0 |
| Current Ratio | 1.36 | 0 |
| Quick Ratio | 0.99 | 0 |
| D/E | 2.44 | 0 |
| Debt-to-Assets | 53.6% | 0 |
| Interest Coverage | 15.1 | 12.5 |
| Asset Turnover | 1.06 | 0 |
| Fixed Asset Turnover | 6.91 | 0 |
| Payout ratio | 48.6% | 25.9% |
| Dividend yield | 2.25% | 1.06% |
| Fiscal Year | 2024 | 2025 |
Efficiency & Valuation Duel: The Vital Signs
Financial ratios act as a company’s DNA, revealing hidden risks and operational excellence that guide investors in assessing true business quality.
Illinois Tool Works Inc.
Illinois Tool Works displays robust profitability with a stellar 105% ROE and a strong 21.94% net margin, signaling operational excellence. Its P/E ratio of 21.58 appears fair, though a high P/B of 22.69 suggests valuation tension. The company rewards shareholders with a 2.25% dividend yield, reflecting steady capital return alongside reinvestment in R&D.
Dover Corporation
Dover posts a solid 13.52% net margin but reports zero ROE and ROIC, indicating potential accounting or transitional anomalies. Its P/E of 24.49 is reasonable, with a 1.06% dividend yield offering modest shareholder returns. However, the absence of leverage and capital turnover raises caution on operational efficiency and balance sheet strength.
Premium Valuation vs. Operational Safety
Illinois Tool Works leads with superior profitability and balanced shareholder returns despite some leverage concerns. Dover’s weaker profitability and incomplete data signal higher risk. Investors prioritizing consistent returns and operational strength may favor Illinois Tool Works, while those seeking lower leverage might consider Dover’s profile.
Which one offers the Superior Shareholder Reward?
I compare Illinois Tool Works (ITW) and Dover Corporation (DOV) on dividends, payout ratios, and buybacks. ITW delivers a stronger dividend yield around 2.25%, with nearly 49% payout ratio and solid FCF coverage at 1.54x. Dover’s yield lags near 1.1%, with a conservative 26% payout and robust dividend+capex coverage above 2.6x. Both firms aggressively repurchase shares, but ITW’s higher leverage (debt-to-equity ~2.4x vs. DOV’s ~0.7x) raises risk. ITW’s distribution is more generous yet balanced by strong cash flow; DOV prioritizes reinvestment with lower payout. For 2026, I favor ITW’s total return, blending income and buybacks, but caution on its leverage.
Comparative Score Analysis: The Strategic Profile
The radar chart reveals the fundamental DNA and trade-offs of Illinois Tool Works Inc. and Dover Corporation, highlighting their financial strengths and weaknesses side by side:
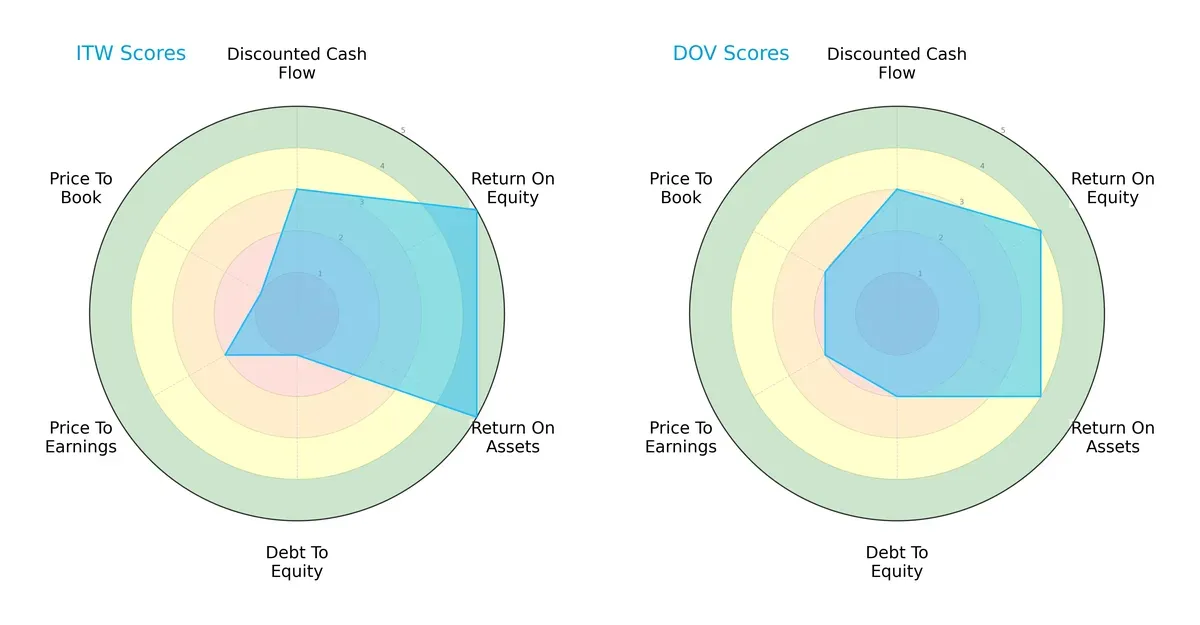
Illinois Tool Works (ITW) excels in profitability metrics, boasting top ROE and ROA scores of 5 each, signaling superior efficiency. However, ITW’s balance sheet is strained, with a weak debt-to-equity score of 1 and undervaluation signals from low price-to-book. Dover (DOV) presents a more balanced profile, with moderate scores across profitability and financial leverage, reflecting steadier risk management but less pronounced competitive edges.
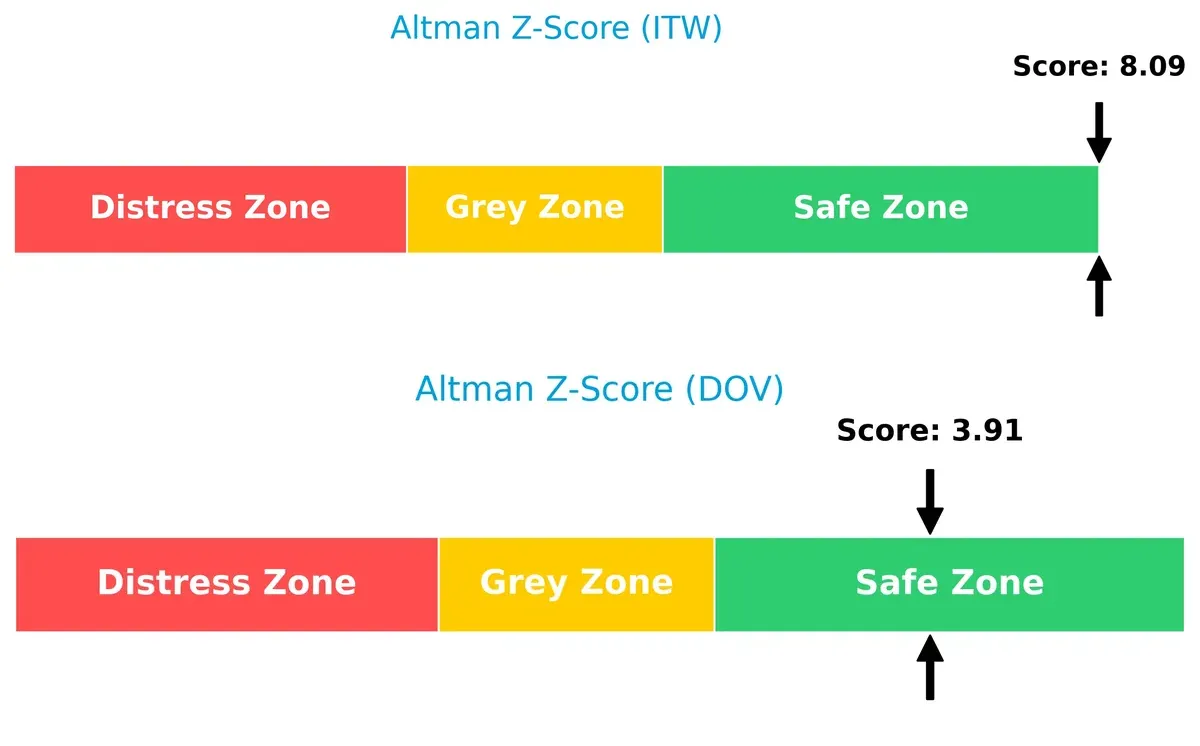
Bankruptcy Risk: Solvency Showdown
Illinois Tool Works’ Altman Z-Score of 8.1 vastly outpaces Dover’s 3.9, placing both safely above distress levels but signaling ITW’s superior long-term solvency in this cycle:
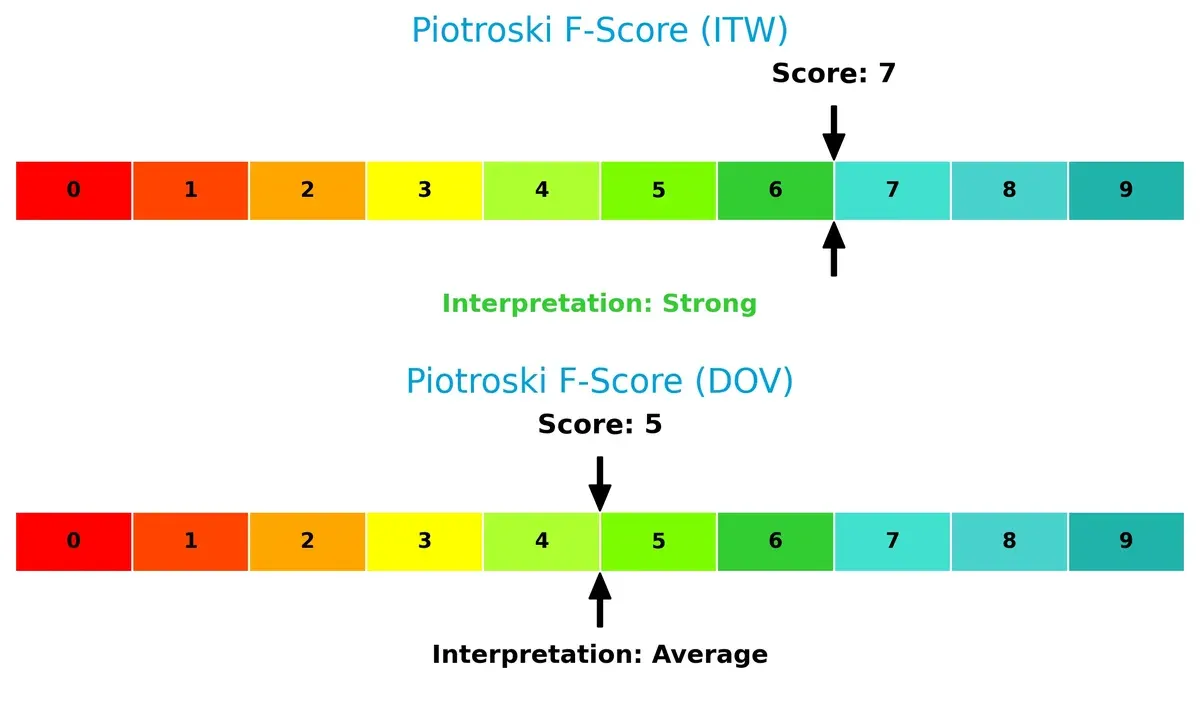
Financial Health: Quality of Operations
ITW’s Piotroski F-Score of 7 indicates strong operational quality and financial robustness. Dover’s score of 5 suggests average health, raising caution about less consistent internal metrics:
How are the two companies positioned?
This section dissects the operational DNA of ITW and DOV by comparing their revenue distribution by segment alongside their internal strengths and weaknesses. The goal is to confront their economic moats and determine which model delivers the most resilient, sustainable competitive advantage today.
Revenue Segmentation: The Strategic Mix
This visual comparison dissects how Illinois Tool Works Inc. and Dover Corporation diversify their income streams and reveals where their primary sector bets lie:
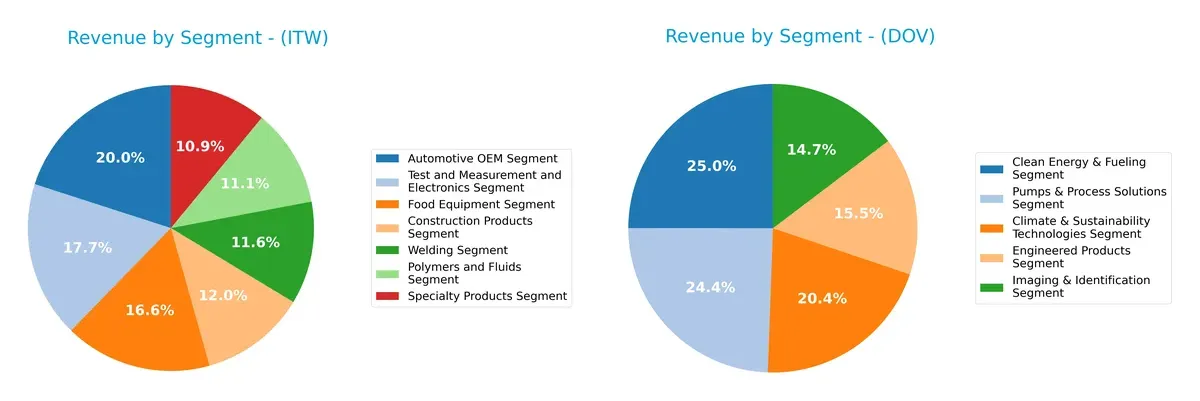
Illinois Tool Works anchors revenue across seven balanced segments, with Automotive OEM at $3.19B and Test & Measurement at $2.82B, showing strong diversification. Dover, however, pivots around five segments, with Clean Energy & Fueling at $1.94B and Pumps & Process Solutions at $1.89B, indicating a more concentrated focus on industrial and energy solutions. ITW’s broad spread reduces concentration risk, while Dover’s niche bets suggest targeted growth but higher exposure to sector cycles.
Strengths and Weaknesses Comparison
This table compares the strengths and weaknesses of Illinois Tool Works Inc. (ITW) and Dover Corporation (DOV):
ITW Strengths
- Broad diversification across seven segments
- High profitability with 21.94% net margin and 27.19% ROIC
- Strong global presence, especially in North America and Europe
- Favorable interest coverage and asset turnover ratios
- Solid dividend yield at 2.25%
DOV Strengths
- Diverse segment exposure with five segments focused on clean energy and engineered products
- Favorable net margin at 13.52% and strong interest coverage
- Low debt levels with favorable debt-to-assets ratio
- Positive price-to-book ratio indicating undervaluation
- Significant U.S. market presence with 4.2B revenue
ITW Weaknesses
- High leverage with debt-to-equity of 2.44 and debt-to-assets above 53%
- Unfavorable price-to-book valuation at 22.69
- Quick ratio below 1, indicating moderate liquidity risk
- Neutral WACC and P/E ratios limit valuation upside
- Exposure to cyclical automotive and construction markets
DOV Weaknesses
- Zero reported ROE and ROIC suggest weak capital efficiency
- Unavailable WACC complicates cost of capital analysis
- Unfavorable liquidity ratios, current and quick ratios at zero
- Poor asset turnover metrics indicate operational inefficiency
- Lower dividend yield at 1.06% limits income appeal
Both companies show diversified business models but differ markedly in profitability and financial health. ITW leverages strong returns and global reach but carries high debt. DOV benefits from lower leverage and niche segments but struggles with capital efficiency and liquidity. These contrasts reflect differing strategic priorities and risk profiles.
The Moat Duel: Analyzing Competitive Defensibility
A structural moat is the only true shield guarding long-term profits from relentless competitive erosion. Let’s dissect how Illinois Tool Works and Dover Corporation defend their turf:
Illinois Tool Works Inc.: Diversified Industrial Moat with Operational Excellence
ITW’s moat stems from intangible assets and cost advantages across diverse industrial segments. Its high ROIC, well above WACC by 18.5%, confirms strong value creation and margin stability. In 2026, expanding specialized product lines and global reach should deepen its durable competitive edge.
Dover Corporation: Niche Solutions Facing Operational Headwinds
DOV relies on engineered product specialization as its moat, yet recent declines in ROIC trend and profitability highlight vulnerability. Unlike ITW, Dover’s competitive positioning weakens with margin contractions and shrinking net income. Future growth depends on successful innovation and clean energy segment expansion.
Moat Quality Showdown: Diversification and Operational Efficiency vs. Niche Risk
ITW’s wider, more durable moat evident in rising ROIC and stable margins contrasts sharply with Dover’s declining returns and profitability. ITW is clearly better equipped to defend market share amid industrial sector volatility and intensifying competition.
Which stock offers better returns?
The past year saw both Illinois Tool Works Inc. and Dover Corporation exhibit bullish price trends, with notable acceleration and distinct trading dynamics shaping their market performance.
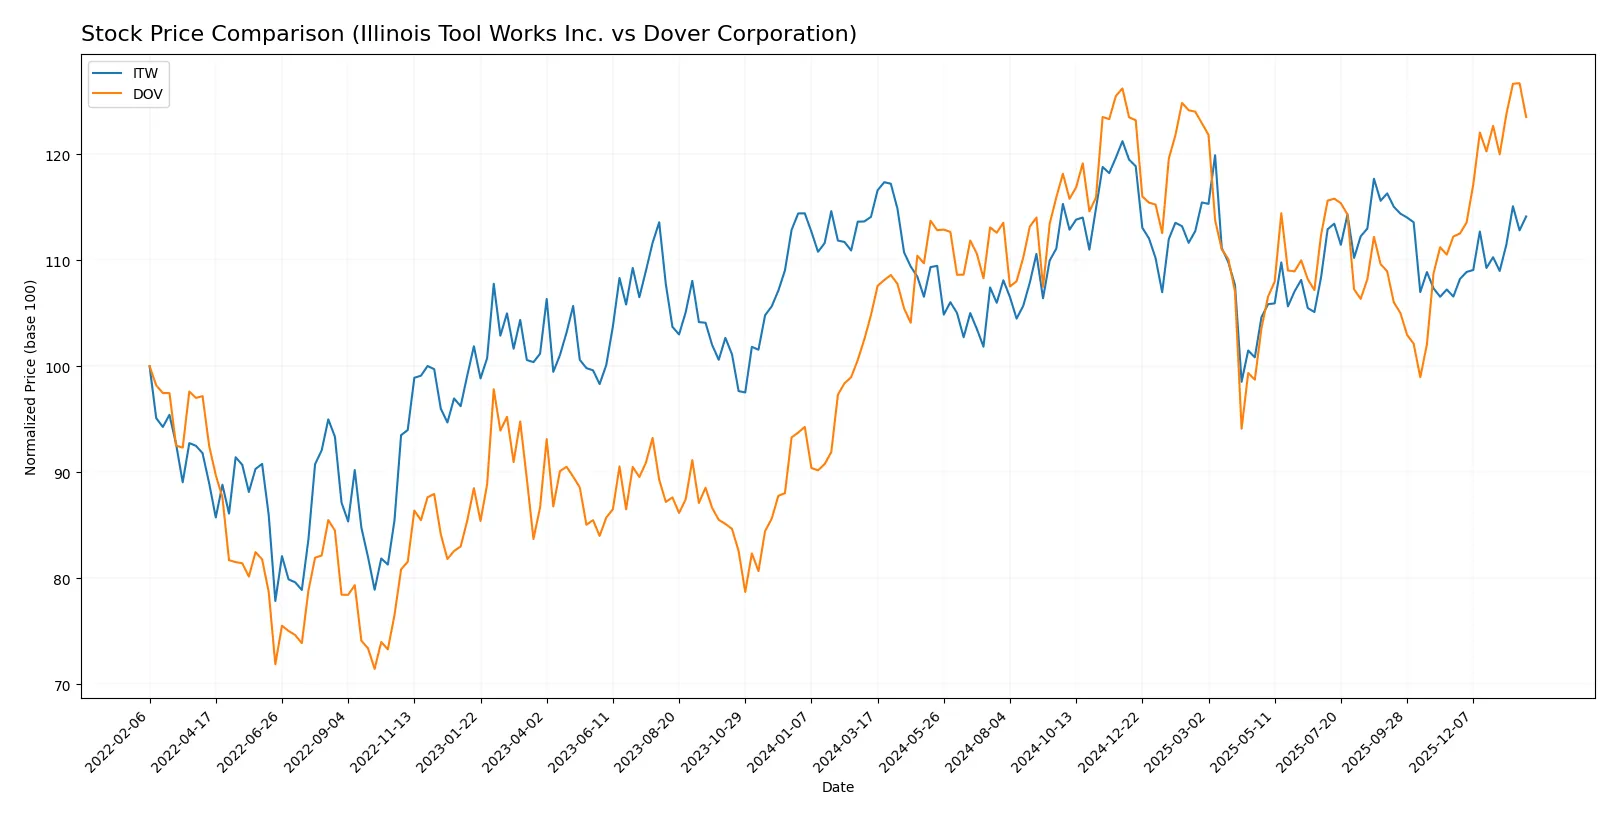
Trend Comparison
Illinois Tool Works Inc. posted a 3% price increase over the last 12 months, reflecting a bullish trend with acceleration. The stock ranged between 225.57 and 277.52, showing moderate volatility (std dev 10.7).
Dover Corporation outperformed with a 17.81% gain over the same period, also bullish with accelerating momentum. Prices fluctuated from 153.55 to 206.71, with slightly higher volatility (std dev 11.33).
Dover’s stronger 17.81% increase surpasses Illinois Tool Works’ 3%, delivering the highest market return and more pronounced recent acceleration.
Target Prices
Analysts present a constructive consensus on Illinois Tool Works Inc. and Dover Corporation, reflecting moderate upside potential.
| Company | Target Low | Target High | Consensus |
|---|---|---|---|
| Illinois Tool Works Inc. | 230 | 275 | 254 |
| Dover Corporation | 195 | 256 | 221.38 |
The target consensus for Illinois Tool Works slightly exceeds its current price of 261.26, suggesting modest appreciation. Dover’s consensus target of 221.38 is notably above its current 201.49 price, indicating stronger upside expectations.

Don’t Let Luck Decide Your Entry Point
Optimize your entry points with our advanced ProRealTime indicators. You’ll get efficient buy signals with precise price targets for maximum performance. Start outperforming now!
How do institutions grade them?
Illinois Tool Works Inc. Grades
The following table summarizes recent grades from major grading companies for Illinois Tool Works Inc.:
| Grading Company | Action | New Grade | Date |
|---|---|---|---|
| Wells Fargo | maintain | Underweight | 2026-01-07 |
| Goldman Sachs | downgrade | Sell | 2025-12-16 |
| B of A Securities | upgrade | Neutral | 2025-11-18 |
| Barclays | maintain | Underweight | 2025-10-27 |
| Wells Fargo | maintain | Underweight | 2025-10-27 |
| Truist Securities | maintain | Hold | 2025-10-27 |
| Truist Securities | maintain | Hold | 2025-10-08 |
| Barclays | downgrade | Underweight | 2025-08-14 |
| Barclays | maintain | Equal Weight | 2025-08-04 |
| Wells Fargo | maintain | Underweight | 2025-07-31 |
Dover Corporation Grades
The following table summarizes recent grades from major grading companies for Dover Corporation:
| Grading Company | Action | New Grade | Date |
|---|---|---|---|
| JP Morgan | maintain | Overweight | 2026-01-30 |
| Wells Fargo | maintain | Equal Weight | 2026-01-30 |
| RBC Capital | maintain | Sector Perform | 2026-01-30 |
| Oppenheimer | maintain | Outperform | 2026-01-26 |
| JP Morgan | maintain | Overweight | 2026-01-16 |
| Barclays | maintain | Equal Weight | 2026-01-07 |
| Wells Fargo | maintain | Equal Weight | 2026-01-07 |
| UBS | upgrade | Buy | 2026-01-05 |
| Wells Fargo | maintain | Equal Weight | 2025-12-15 |
| Oppenheimer | maintain | Outperform | 2025-11-14 |
Which company has the best grades?
Dover Corporation consistently receives positive ratings like Overweight and Outperform. Illinois Tool Works is mostly rated Underweight or Sell. Dover’s stronger grades suggest better investor sentiment and potential market confidence.
Risks specific to each company
The following categories identify the critical pressure points and systemic threats facing Illinois Tool Works Inc. and Dover Corporation in the 2026 market environment:
1. Market & Competition
Illinois Tool Works Inc.
- Operates diverse industrial segments with strong margins, but faces intense competition in automotive and food equipment.
Dover Corporation
- Diversified industrial equipment provider with exposure to clean energy; competitive pressures in automation and fuel sectors.
2. Capital Structure & Debt
Illinois Tool Works Inc.
- High debt-to-equity ratio (2.44) and debt to assets (54%) pose leverage risks despite strong interest coverage.
Dover Corporation
- Reported zero debt metrics; likely low leverage but missing data on capital structure raises transparency concerns.
3. Stock Volatility
Illinois Tool Works Inc.
- Beta 1.17 indicates moderate sensitivity to market swings, aligned with industrial sector norms.
Dover Corporation
- Higher beta of 1.31 suggests greater stock price volatility and investor risk exposure.
4. Regulatory & Legal
Illinois Tool Works Inc.
- Broad global operations expose it to diverse regulatory environments, especially automotive and food safety rules.
Dover Corporation
- Multiple industry exposures including aerospace and clean energy increase regulatory complexity and compliance costs.
5. Supply Chain & Operations
Illinois Tool Works Inc.
- Complex supply chains across seven segments increase vulnerability to disruptions and rising input costs.
Dover Corporation
- Supply chain spans specialized components and software, with added risks from clean energy equipment production.
6. ESG & Climate Transition
Illinois Tool Works Inc.
- Moderate ESG risks; some exposure in automotive and fluids but less emphasis on climate-specific solutions.
Dover Corporation
- Active in climate technologies and clean energy, but transition risks and capital investment needs are material.
7. Geopolitical Exposure
Illinois Tool Works Inc.
- Global footprint subjects it to trade tensions, tariffs, and geopolitical volatility affecting industrial markets.
Dover Corporation
- Similar global exposure plus sensitivity to geopolitical risks in energy and aerospace sectors.
Which company shows a better risk-adjusted profile?
Illinois Tool Works’ most impactful risk is its elevated leverage, which could amplify financial strain if economic conditions worsen. Dover’s key risk lies in its higher stock volatility and limited transparency on debt, raising uncertainty. Overall, Illinois Tool Works offers a stronger risk-adjusted profile, supported by its robust Altman Z-score (8.1, safe zone) and higher Piotroski score (7, strong). Dover’s lower Piotroski score (5) and moderate Altman Z-score (3.9) reflect greater financial vulnerability. The pronounced debt at Illinois Tool Works remains a red flag, but its superior profitability and financial strength metrics justify cautious preference.
Final Verdict: Which stock to choose?
Illinois Tool Works (ITW) excels as a cash-generating powerhouse with a durable competitive moat, evidenced by its steadily growing ROIC well above cost of capital. Its main point of vigilance is a higher leverage level, which could amplify risk in downturns. ITW suits portfolios seeking stable, long-term, aggressive growth exposure.
Dover Corporation (DOV) offers a strategic moat rooted in operational resilience and solid cash flow, combined with a more conservative balance sheet than ITW. However, its recent declining profitability and weaker income growth warrant caution. DOV fits investors aiming for growth at a reasonable price with a preference for safety.
If you prioritize durable value creation and high capital efficiency, Illinois Tool Works stands out due to its strong moat and consistent profitability. However, if you seek a more conservative profile with potential for steady income and lower leverage, Dover may offer better stability despite recent headwinds. Both present distinct analytical scenarios depending on risk tolerance and investment horizon.
Disclaimer: Investment carries a risk of loss of initial capital. The past performance is not a reliable indicator of future results. Be sure to understand risks before making an investment decision.
Go Further
I encourage you to read the complete analyses of Illinois Tool Works Inc. and Dover Corporation to enhance your investment decisions: