Home > Comparison > Industrials > DOV vs IEX
The strategic rivalry between Dover Corporation and IDEX Corporation shapes the industrial machinery sector’s landscape. Dover operates as a diversified industrial giant with broad equipment and digital solutions, while IDEX focuses on specialized applied fluidics and firefighting technologies. This head-to-head pits scale and diversification against niche innovation. This analysis will identify which company’s trajectory offers a superior risk-adjusted outlook for a balanced industrial portfolio.
Table of contents
Companies Overview
Dover Corporation and IDEX Corporation stand as significant players in the industrial machinery sector, shaping key market dynamics.
Dover Corporation: Industrial Equipment and Solutions Leader
Dover Corporation dominates as a global provider of equipment, components, and software solutions across diverse end-markets. It generates revenue through engineered products, clean energy fueling, imaging, pumps, and climate technologies. In 2026, Dover’s strategic focus remains on advancing digital solutions and expanding its clean energy and sustainability portfolio.
IDEX Corporation: Applied Fluidics and Safety Specialist
IDEX Corporation excels in applied solutions with a core emphasis on fluid and metering technologies, health sciences, and safety products. Its revenue stems from pumps, precision fluidics, firefighting equipment, and related services. The company’s 2026 strategy centers on innovation in fluid handling and medical device technologies to capture specialty market segments.
Strategic Collision: Similarities & Divergences
Both companies prioritize industrial machinery but diverge in scope; Dover embraces a broader product ecosystem while IDEX specializes in fluidics and safety solutions. Their primary battleground lies in fluid handling equipment and precision components. Investors encounter distinct profiles: Dover offers scale and diversified industrial exposure, whereas IDEX presents a focused, innovation-driven niche approach.
Income Statement Comparison
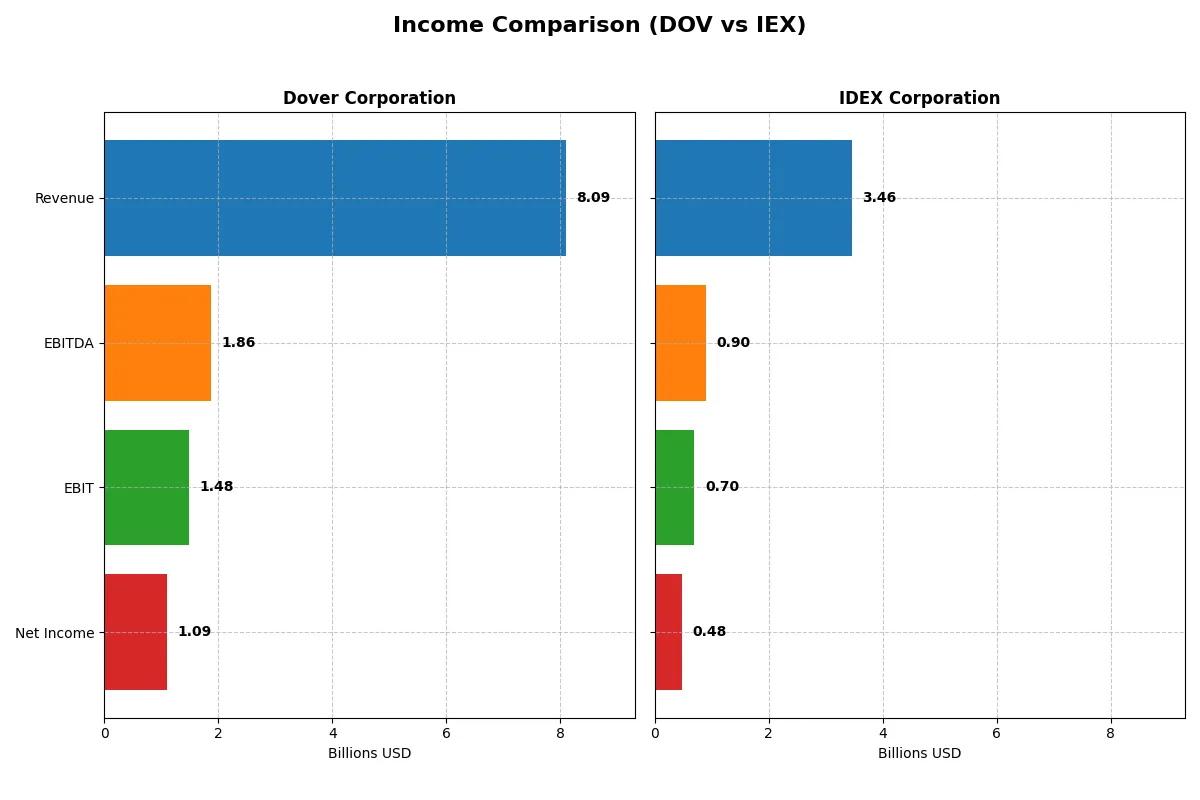
The following data dissects the core profitability and scalability of both corporate engines to reveal who dominates the bottom line:
| Metric | Dover Corporation (DOV) | IDEX Corporation (IEX) |
|---|---|---|
| Revenue | 8.1B | 3.5B |
| Cost of Revenue | 4.9B | 1.9B |
| Operating Expenses | 1.8B | 819M |
| Gross Profit | 3.2B | 1.5B |
| EBITDA | 1.9B | 903M |
| EBIT | 1.5B | 697M |
| Interest Expense | 110M | 64M |
| Net Income | 1.1B | 483M |
| EPS | 7.97 | 6.41 |
| Fiscal Year | 2025 | 2025 |
Income Statement Analysis: The Bottom-Line Duel
The following income statement comparison reveals the true efficiency and profitability of Dover Corporation and IDEX Corporation’s business models.
Dover Corporation Analysis
Dover’s revenue shows modest growth at 8.1B in 2025, but net income declines sharply to 1.09B from 2.7B in 2024. Its gross margin remains healthy near 40%, yet net margin falls to 13.5%. Operating expenses grew slightly, dragging EBIT down 21%, reflecting challenges in maintaining momentum despite steady top-line trends.
IDEX Corporation Analysis
IDEX posts 3.46B revenue in 2025, growing steadily with a 5.8% annual increase. Net income stands at 483M, down slightly from 505M in 2024. Gross margin is robust at 44.5%, and EBIT margin improves to 20.2%, signaling efficient cost control. The company maintains steady operational momentum and favorable expense management.
Margin Strength vs. Growth Stability
Dover commands a larger revenue base but faces declining net income and margin compression, signaling emerging operational headwinds. IDEX, though smaller, sustains healthier margins and consistent profit growth. For investors prioritizing margin efficiency and steady earnings expansion, IDEX presents a more attractive earnings profile in 2025.
Financial Ratios Comparison
These vital ratios act as a diagnostic tool to expose the underlying fiscal health, valuation premiums, and capital efficiency of the companies compared below:
| Ratios | Dover Corporation (DOV) | IDEX Corporation (IEX) |
|---|---|---|
| ROE | 14.77% | 11.99% |
| ROIC | 9.45% | 8.65% |
| P/E | 24.49 | 27.73 |
| P/B | 3.62 | 3.33 |
| Current Ratio | 1.79 | 2.86 |
| Quick Ratio | 1.28 | 2.02 |
| D/E (Debt-to-Equity) | 0.45 | 0.00 |
| Debt-to-Assets | 24.79% | 0.01% |
| Interest Coverage | 12.51 | 11.18 |
| Asset Turnover | 0.60 | 0.50 |
| Fixed Asset Turnover | 7.23 | 7.39 |
| Payout Ratio | 25.87% | 43.99% |
| Dividend Yield | 1.06% | 1.59% |
| Fiscal Year | 2025 | 2025 |
Efficiency & Valuation Duel: The Vital Signs
Financial ratios act as the company’s DNA, uncovering hidden risks and operational strengths that define its market stance and investor appeal.
Dover Corporation
Dover delivers solid profitability with a 14.77% ROE and a 13.52% net margin, signaling efficient operations. The stock trades at a neutral P/E of 24.49 but faces an unfavorable price-to-book at 3.62, indicating some valuation stretch. It maintains shareholder value with a modest 1.06% dividend yield, balancing payout with reinvestment.
IDEX Corporation
IDEX shows a slightly lower 12.0% ROE but a favorable 13.98% net margin, reflecting operational discipline. Its P/E of 27.73 suggests the stock is expensive relative to earnings. Despite a stronger dividend yield of 1.59%, the company retains a conservative capital structure with zero debt, enhancing financial stability.
Premium Valuation vs. Operational Safety
Dover offers a better balance of profitability and valuation with moderate risk, while IDEX’s higher valuation and zero debt appeal to risk-averse investors. Dover fits those favoring steady returns; IDEX suits those prioritizing financial prudence and growth potential.
Which one offers the Superior Shareholder Reward?
I see Dover and IDEX both distribute cash but with different intensities and sustainability. Dover yields ~1.06% with a conservative 26% payout ratio and a strong capex plus dividend coverage ratio of 2.66x. Its buybacks are moderate but consistent, supporting shareholder value without compromising free cash flow. IDEX offers a higher yield near 1.59% but pays out 44% of earnings, reducing reinvestment capacity. Their buybacks are aggressive, enhancing total returns but risking sustainability amid economic volatility. Historically, Dover’s balanced distribution and robust cash flow coverage suggest a more durable shareholder reward in 2026. I favor Dover for steady, long-term total return over IDEX’s higher but riskier yield and buyback model.
Comparative Score Analysis: The Strategic Profile
The radar chart reveals the fundamental DNA and trade-offs of Dover Corporation and IDEX Corporation, highlighting their distinct financial strengths and weaknesses:
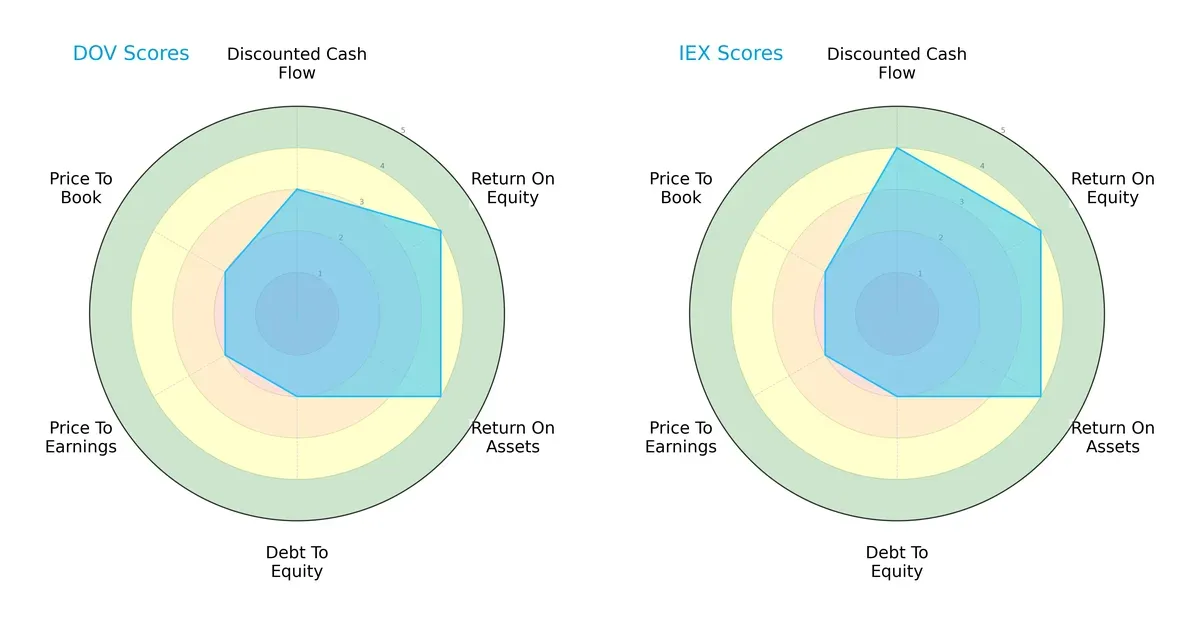
I observe that IDEX edges Dover with a superior discounted cash flow score (4 vs. 3), signaling better valuation support. Both firms share strong return on equity and assets (4 each), demonstrating efficient capital use. However, both struggle with debt-to-equity and valuation scores (2 each), reflecting financial leverage risks and possible overvaluation. IDEX presents a slightly more balanced profile, leveraging cash flow advantages, while Dover relies more heavily on operational efficiency.
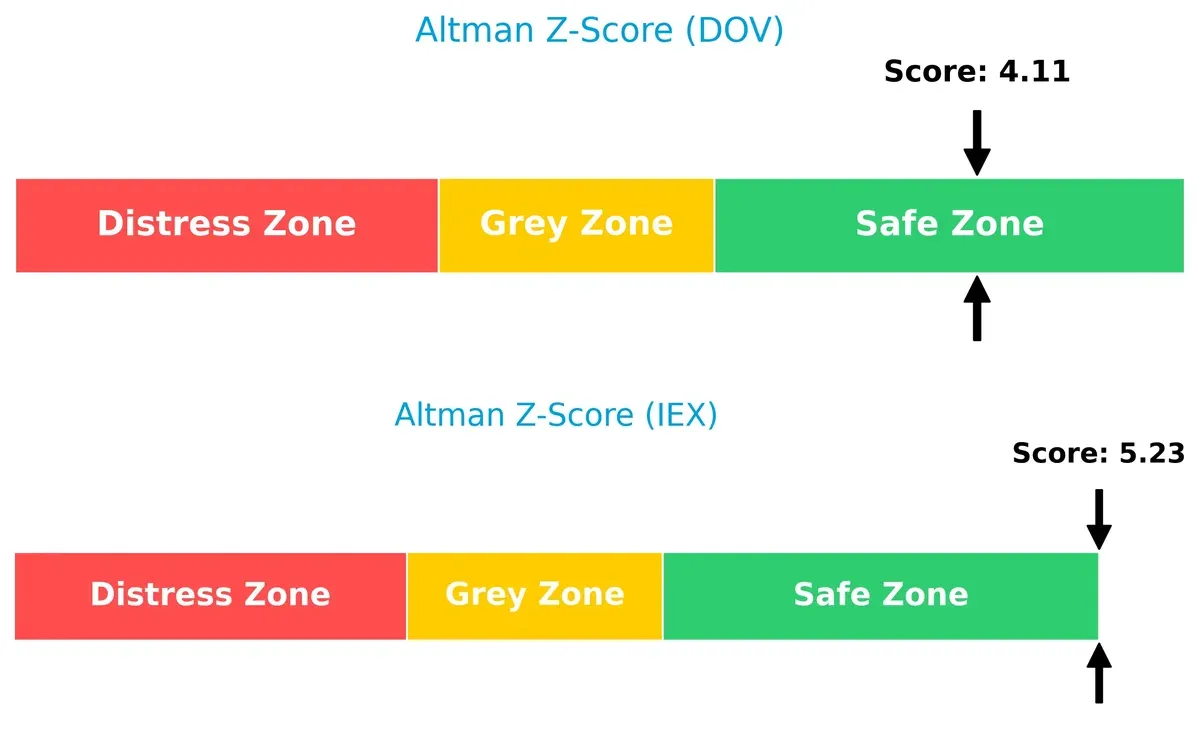
Bankruptcy Risk: Solvency Showdown
IDEX’s Altman Z-Score of 5.23 outperforms Dover’s 4.11, both safely above the distress threshold, indicating strong solvency and low bankruptcy risk in this cycle:
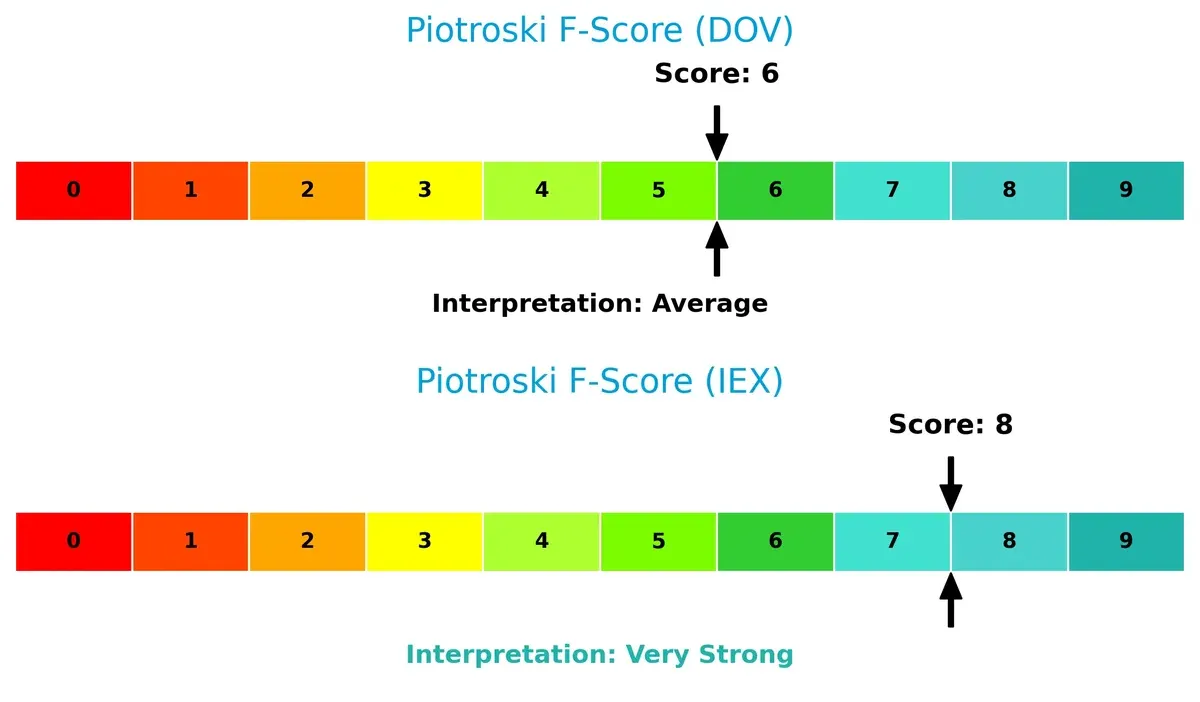
Financial Health: Quality of Operations
IDEX scores an 8 on the Piotroski F-Score, showing robust financial health, while Dover’s 6 signals average strength with potential red flags in internal metrics:
How are the two companies positioned?
This section dissects DOV and IEX’s operational DNA by comparing their revenue distribution and internal strengths and weaknesses. The goal is to confront their economic moats and identify the most resilient, sustainable competitive advantage today.
Revenue Segmentation: The Strategic Mix
The following visual comparison dissects how Dover Corporation and IDEX Corporation diversify their income streams and highlights their primary sector focuses:
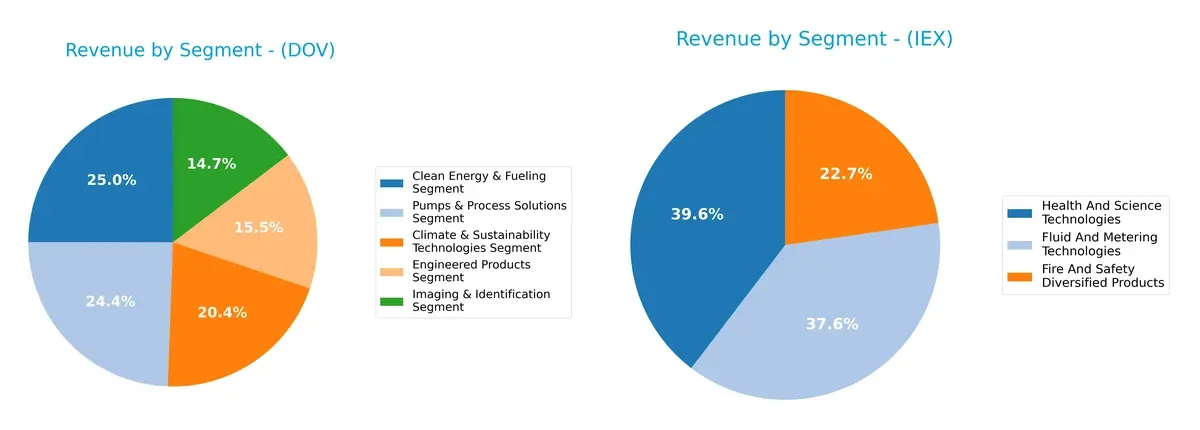
Dover Corporation presents a balanced revenue mix across five segments, with Clean Energy & Fueling at $1.94B and Pumps & Process Solutions close behind at $1.89B. In contrast, IDEX relies on three segments, with Health And Science Technologies anchoring $1.30B. Dover’s diversification reduces concentration risk, leveraging multiple industrial niches. IDEX’s narrower focus may benefit from deeper specialization but risks sector cyclicality. Both deploy distinct strategic bets catering to different market dynamics.
Strengths and Weaknesses Comparison
This table compares the Strengths and Weaknesses of Dover Corporation and IDEX Corporation:
Dover Corporation Strengths
- Diverse segments including Clean Energy and Process Solutions
- Favorable net margin at 13.52%
- Strong liquidity ratios with current ratio 1.79
- Low debt to assets at 24.79%
- High fixed asset turnover at 7.23
- Solid global presence with significant US and Europe revenue
IDEX Corporation Strengths
- Favorable net margin at 13.98%
- Excellent liquidity with current ratio 2.86
- Zero debt and minimal debt to assets
- High fixed asset turnover at 7.39
- Higher dividend yield at 1.59%
- Stable revenue across Health, Safety, and Fluid Technologies
Dover Corporation Weaknesses
- Price to book ratio unfavorable at 3.62
- ROE and ROIC neutral, close to WACC
- Moderate asset turnover at 0.6
- Heavy reliance on US market over 4B revenue
IDEX Corporation Weaknesses
- Elevated PE ratio unfavorable at 27.73
- Price to book ratio unfavorable at 3.33
- Asset turnover low at 0.5
- Smaller geographic diversification, US-centric revenues
Dover shows strength in diversification and balance sheet prudence but faces valuation pressures and moderate returns. IDEX benefits from a clean balance sheet and profitability but carries valuation risks and less geographic spread. Both reflect slightly favorable financial profiles with distinct operational focuses.
The Moat Duel: Analyzing Competitive Defensibility
A structural moat is the only reliable barrier protecting long-term profits from relentless competitive erosion. Let’s analyze how two industrial machinery giants defend their turf:
Dover Corporation: Diversified Industrial Solutions Moat
Dover’s moat stems from intangible assets and aftermarket services that stabilize margins near 18% EBIT. Yet, declining ROIC signals weakening competitive efficiency heading into 2026.
IDEX Corporation: Precision Engineering and Specialty Pumps Moat
IDEX leverages specialized fluidics and safety tech, yielding superior gross margins above 44%. However, its ROIC also declines sharply, reflecting challenges in sustaining excess returns versus Dover.
Aftermarket Services vs. Specialty Engineering: Which Moat Holds Deeper?
Both firms suffer shrinking ROIC and value erosion, but Dover’s broader product scope and stable margin profile grant it a slightly wider moat. Dover appears better positioned to defend market share amid industrial sector pressures.
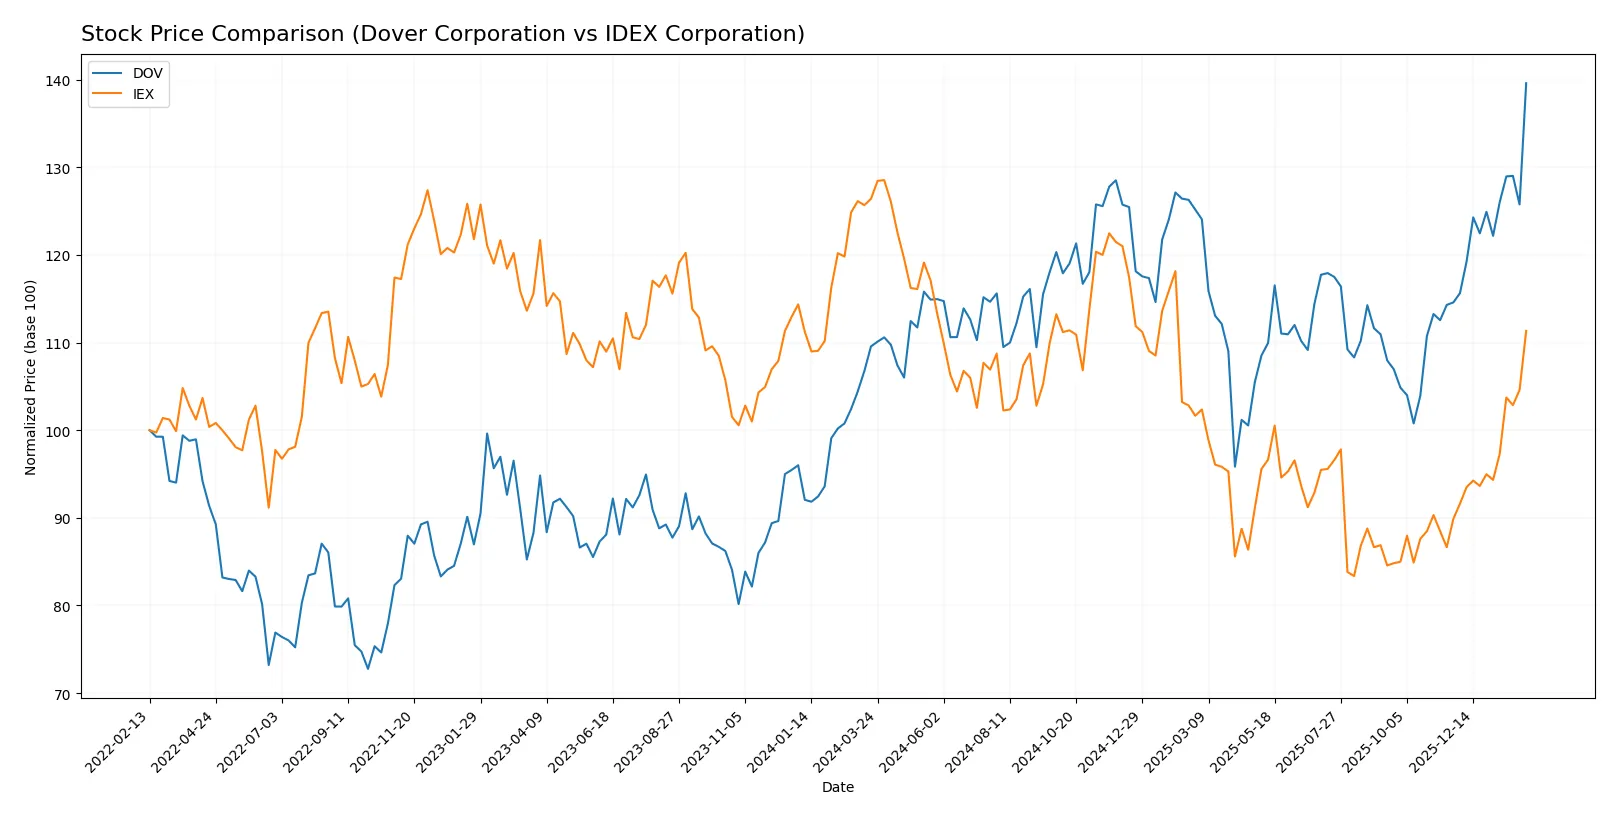
Which stock offers better returns?
Over the past year, Dover Corporation’s stock surged by 27.4%, showing accelerating gains, while IDEX Corporation fell 11.9% despite recent recovery signs starting late 2025.
Trend Comparison
Dover Corporation’s stock price increased 27.4% over 12 months, reflecting a bullish trend with acceleration and a high near 224. Volatility measures at 11.9% show moderate fluctuation.
IDEX Corporation’s stock declined 11.9% over the same period, marking a bearish trend despite acceleration. Volatility is higher at 22.7%, with a peak price of 244, indicating wider price swings.
Dover outperformed IDEX with a strong bullish trend versus IDEX’s overall bearish direction, delivering the highest market gains over the past year.
Target Prices
Analysts present a clear target consensus for Dover Corporation and IDEX Corporation, reflecting moderate upside potential.
| Company | Target Low | Target High | Consensus |
|---|---|---|---|
| Dover Corporation | 195 | 256 | 223.7 |
| IDEX Corporation | 220 | 247 | 236.2 |
The consensus target for Dover Corporation aligns closely with its current price of $223.66, signaling balanced expectations. IDEX’s target consensus at $236.2 suggests roughly 12% upside from its $211.37 price, indicating stronger growth anticipation.

Don’t Let Luck Decide Your Entry Point
Optimize your entry points with our advanced ProRealTime indicators. You’ll get efficient buy signals with precise price targets for maximum performance. Start outperforming now!
How do institutions grade them?
Here is a comparison of recent institutional grades assigned to Dover Corporation and IDEX Corporation:
Dover Corporation Grades
The following table summarizes Dover Corporation’s most recent grades from major institutional analysts.
| Grading Company | Action | New Grade | Date |
|---|---|---|---|
| JP Morgan | maintain | Overweight | 2026-01-30 |
| Wells Fargo | maintain | Equal Weight | 2026-01-30 |
| RBC Capital | maintain | Sector Perform | 2026-01-30 |
| Oppenheimer | maintain | Outperform | 2026-01-26 |
| UBS | upgrade | Buy | 2026-01-05 |
IDEX Corporation Grades
Below is a table showing IDEX Corporation’s recent analyst grades from reputable firms.
| Grading Company | Action | New Grade | Date |
|---|---|---|---|
| Argus Research | upgrade | Buy | 2026-02-06 |
| TD Cowen | maintain | Buy | 2026-02-05 |
| Citigroup | maintain | Buy | 2026-02-05 |
| DA Davidson | maintain | Neutral | 2026-02-05 |
| RBC Capital | maintain | Outperform | 2026-02-05 |
| Stifel | maintain | Buy | 2026-01-23 |
| Oppenheimer | maintain | Outperform | 2025-10-07 |
Which company has the best grades?
IDEX Corporation has consistently received more bullish ratings, including multiple Buy and Outperform grades. Dover’s grades are more mixed, with several Equal Weight and Sector Perform assessments. Investors may view IDEX’s stronger grade profile as a sign of higher analyst confidence.
Risks specific to each company
The following categories identify the critical pressure points and systemic threats facing Dover Corporation and IDEX Corporation in the 2026 market environment:
1. Market & Competition
Dover Corporation
- Faces competition in diverse industrial machinery sectors; must innovate to maintain market share.
IDEX Corporation
- Operates in specialized fluid and metering technologies, facing niche competition and evolving customer needs.
2. Capital Structure & Debt
Dover Corporation
- Moderate leverage with debt-to-equity at 0.45; interest coverage strong at 13.52, signaling manageable debt risk.
IDEX Corporation
- Virtually no debt with debt-to-equity at 0.0; interest coverage 10.82, reflecting conservative capital structure.
3. Stock Volatility
Dover Corporation
- Beta of 1.289 indicates higher market sensitivity and greater stock price volatility.
IDEX Corporation
- Beta near 0.983 suggests lower volatility and closer tracking of market averages.
4. Regulatory & Legal
Dover Corporation
- Exposure to regulations in clean energy and aerospace sectors; compliance costs may rise.
IDEX Corporation
- Faces regulatory scrutiny in health sciences and fire safety markets; product liability risks exist.
5. Supply Chain & Operations
Dover Corporation
- Complex global supply chains could face disruptions impacting manufacturing and distribution.
IDEX Corporation
- Smaller scale operations may enable more agile supply chain management but risk supplier dependency.
6. ESG & Climate Transition
Dover Corporation
- Investments in clean energy technologies position it for climate transition but require capital.
IDEX Corporation
- ESG focus in health and safety products supports sustainability; must adapt to evolving standards.
7. Geopolitical Exposure
Dover Corporation
- Global operations expose it to geopolitical risks affecting trade and supply chains.
IDEX Corporation
- Primarily US-based, lower direct geopolitical risk but vulnerable to export market fluctuations.
Which company shows a better risk-adjusted profile?
Dover’s main risk lies in its market volatility and leverage, while IDEX’s primary concern is its higher valuation multiples and competitive niche pressures. IDEX’s stronger balance sheet and lower beta offer a superior risk-adjusted profile. Dover’s higher beta (1.289) signals more price swings, raising caution amid uncertain industrial demand cycles.
Final Verdict: Which stock to choose?
Dover Corporation’s superpower lies in its operational efficiency and robust cash flow generation, which historically supports resilient industrial portfolios. A point of vigilance is its modest margin growth and declining ROIC trend, signaling potential pressure on long-term profitability. Dover suits investors targeting steady industrial exposure with moderate growth ambitions.
IDEX Corporation commands a strategic moat through its strong balance sheet and consistent income quality, buoyed by recurring revenue streams and disciplined capital allocation. It offers better liquidity and financial stability than Dover, though at a premium valuation. IDEX fits well within a GARP (Growth at a Reasonable Price) portfolio seeking quality and defensive characteristics.
If you prioritize operational strength and cash generation in industrials, Dover outshines with its efficiency despite some margin headwinds. However, if you seek financial stability combined with a resilient moat and don’t mind paying a premium, IDEX offers better downside protection and consistent earnings quality. Both present analytical scenarios for differentiated investor profiles balancing growth and safety.
Disclaimer: Investment carries a risk of loss of initial capital. The past performance is not a reliable indicator of future results. Be sure to understand risks before making an investment decision.
Go Further
I encourage you to read the complete analyses of Dover Corporation and IDEX Corporation to enhance your investment decisions: