Home > Comparison > Industrials > HWM vs DOV
The strategic rivalry between Howmet Aerospace Inc. and Dover Corporation shapes the industrial machinery sector’s evolution. Howmet Aerospace operates as a capital-intensive aerospace and transportation components manufacturer. Dover Corporation focuses on diversified industrial equipment, software, and solutions across multiple end markets. This head-to-head contrasts focused manufacturing scale with broad industrial diversification. This analysis will identify which trajectory offers superior risk-adjusted returns for a well-rounded portfolio in 2026.
Table of contents
Companies Overview
Howmet Aerospace and Dover Corporation stand as key players in the industrial machinery sector with distinct market footprints.
Howmet Aerospace Inc.: Advanced Engineered Aerospace Solutions
Howmet Aerospace commands a leading position in aerospace components, generating revenue from engineered parts like airfoils, fasteners, and forged wheels. Its strategic focus in 2026 centers on expanding its Engine Products and Engineered Structures segments, targeting aerospace and transportation industries globally. The company leverages advanced manufacturing capabilities to sustain its competitive edge.
Dover Corporation: Diversified Industrial Equipment Provider
Dover Corporation operates as a diversified industrial equipment supplier, earning from engineered products, clean energy solutions, and climate technologies. In 2026, Dover emphasizes growth in digital solutions and clean energy fueling infrastructure, serving multiple sectors from aerospace to retail fueling. Its broad portfolio supports resilience amid shifting industrial demand.
Strategic Collision: Similarities & Divergences
Both firms emphasize industrial innovation but diverge sharply in scope: Howmet focuses on aerospace precision parts, while Dover pursues a diversified industrial and clean energy approach. Their primary battleground lies in aerospace and industrial machinery markets. Investors face contrasting profiles—Howmet bets on aerospace specialization; Dover on broad industrial exposure and sustainability trends.
Income Statement Comparison
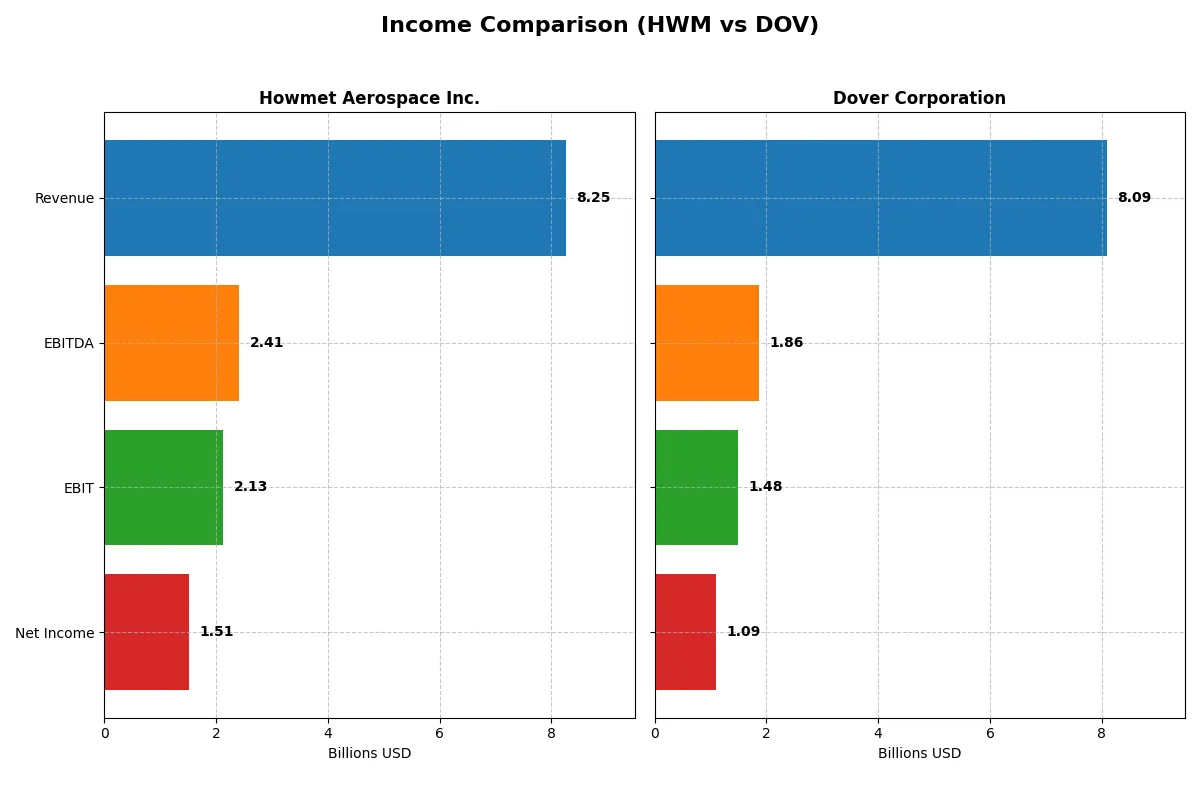
This data dissects the core profitability and scalability of both corporate engines to reveal who dominates the bottom line:
| Metric | Howmet Aerospace Inc. (HWM) | Dover Corporation (DOV) |
|---|---|---|
| Revenue | 8.25B | 8.09B |
| Cost of Revenue | 5.72B | 4.87B |
| Operating Expenses | 407M | 1.84B |
| Gross Profit | 2.54B | 3.22B |
| EBITDA | 2.41B | 1.86B |
| EBIT | 2.13B | 1.48B |
| Interest Expense | 151M | 110M |
| Net Income | 1.51B | 1.09B |
| EPS | 3.73 | 7.97 |
| Fiscal Year | 2025 | 2025 |
Income Statement Analysis: The Bottom-Line Duel
This income statement comparison exposes each company’s operational efficiency and profit-generation ability over recent years.
Howmet Aerospace Inc. Analysis
Howmet Aerospace’s revenue grew strongly from 5.0B in 2021 to 8.3B in 2025, with net income surging from 256M to 1.5B. Its gross margin rises steadily above 30%, while net margin peaks near 18%. The 2025 figures reveal robust margin expansion and impressive earnings momentum, reflecting efficient cost control and scaling.
Dover Corporation Analysis
Dover’s revenue edged up modestly from 7.9B in 2021 to 8.1B in 2025, but net income fluctuated, falling to 1.1B in 2025 from a 2.7B peak in 2024. Dover sustains a higher gross margin near 40% but a thinner net margin around 13.5%. The latest year shows margin compression and declining profitability, signaling operational challenges.
Margin Expansion vs. Earnings Stability
Howmet Aerospace outperforms Dover with superior profit growth, margin improvement, and consistent earnings momentum. Dover’s higher gross margin fails to translate into net income growth, weighed down by rising expenses and volatile results. For investors, Howmet’s profile appeals more for its demonstrated ability to convert revenue gains into lasting profitability.
Financial Ratios Comparison
These vital ratios act as a diagnostic tool to expose the underlying fiscal health, valuation premiums, and capital efficiency of the companies compared below:
| Ratios | Howmet Aerospace Inc. (HWM) | Dover Corporation (DOV) |
|---|---|---|
| ROE | 28.17% | 14.77% |
| ROIC | 18.19% | 9.45% |
| P/E | 54.93 | 24.49 |
| P/B | 15.47 | 3.62 |
| Current Ratio | 2.13 | 1.79 |
| Quick Ratio | 1.09 | 1.28 |
| D/E | 0.57 | 0.45 |
| Debt-to-Assets | 27.28% | 24.79% |
| Interest Coverage | 14.11 | 12.51 |
| Asset Turnover | 0.74 | 0.60 |
| Fixed Asset Turnover | 3.18 | 7.23 |
| Payout Ratio | 12.00% | 25.87% |
| Dividend Yield | 0.22% | 1.06% |
| Fiscal Year | 2025 | 2025 |
Efficiency & Valuation Duel: The Vital Signs
Financial ratios act as a company’s DNA, uncovering hidden risks and operational strengths critical for informed investing.
Howmet Aerospace Inc.
Howmet Aerospace posts a robust ROE of 28.17% and a strong net margin of 18.27%, signaling operational efficiency. However, its P/E ratio at 54.93 suggests the stock trades at a premium, stretched above sector norms. Shareholder returns remain modest with a low 0.22% dividend yield, indicating reinvestment into growth and R&D.
Dover Corporation
Dover delivers a moderate ROE of 14.77% and a net margin of 13.52%, reflecting steady but less aggressive profitability. The P/E ratio of 24.49 suggests a reasonable valuation relative to the market. Dover maintains a balanced dividend yield of 1.06%, combining income distribution with strategic capital allocation.
Premium Valuation vs. Operational Safety
Howmet Aerospace offers higher profitability but at a stretched valuation, increasing risk despite operational strength. Dover presents a more balanced risk-reward profile with moderate returns and a fair valuation. Investors seeking growth may prefer Howmet, while those favoring stability might lean toward Dover.
Which one offers the Superior Shareholder Reward?
I observe that Howmet Aerospace (HWM) pays a modest dividend yield near 0.22%, with a low payout ratio around 12%, supporting sustainability. Its free cash flow covers dividends nearly 3x, signaling capacity to maintain or grow payouts. HWM also runs moderate buybacks, enhancing total returns. Dover Corporation (DOV) delivers a much higher dividend yield near 1.05%, yet with a payout ratio over 25%, showing a more aggressive distribution stance. DOV’s free cash flow comfortably covers dividends at nearly 2.7x, but its buyback activity is more restrained. Historically, higher yield and payout ratios demand scrutiny for durability. I find HWM’s conservative payout plus steady buybacks form a more sustainable, balanced shareholder reward. DOV’s rich yield appeals but risks future cuts if cash flow falters. In 2026, I judge HWM offers a superior total return profile due to its prudent capital allocation and sustainable distributions.
Comparative Score Analysis: The Strategic Profile
The radar chart reveals the fundamental DNA and trade-offs of Howmet Aerospace Inc. and Dover Corporation, highlighting their financial strengths and valuation challenges:
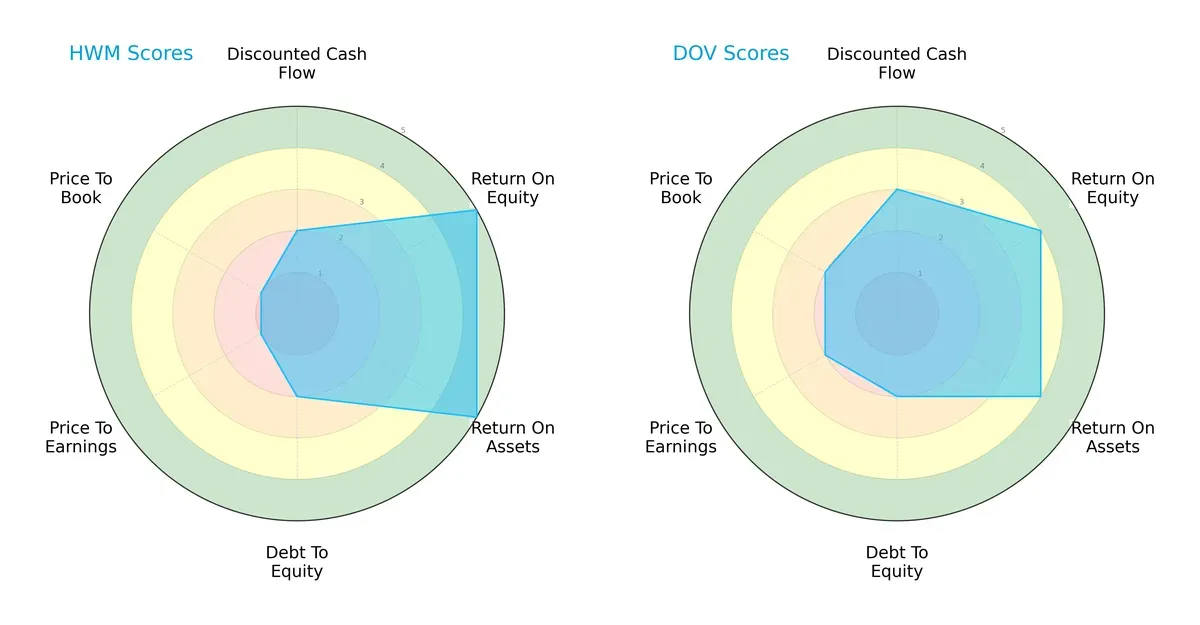
Howmet Aerospace excels in profitability metrics with top ROE and ROA scores (5 each), signaling efficient capital and asset use. Dover shows a more balanced profile, scoring moderately higher in discounted cash flow (3 vs. 2) and valuation metrics (P/E and P/B scores of 2 vs. 1). Both companies share a weak debt-to-equity score (2), indicating elevated leverage risks. Howmet’s profile is skewed toward operational efficiency but suffers from valuation concerns, while Dover maintains steadier valuations but slightly lower profitability.
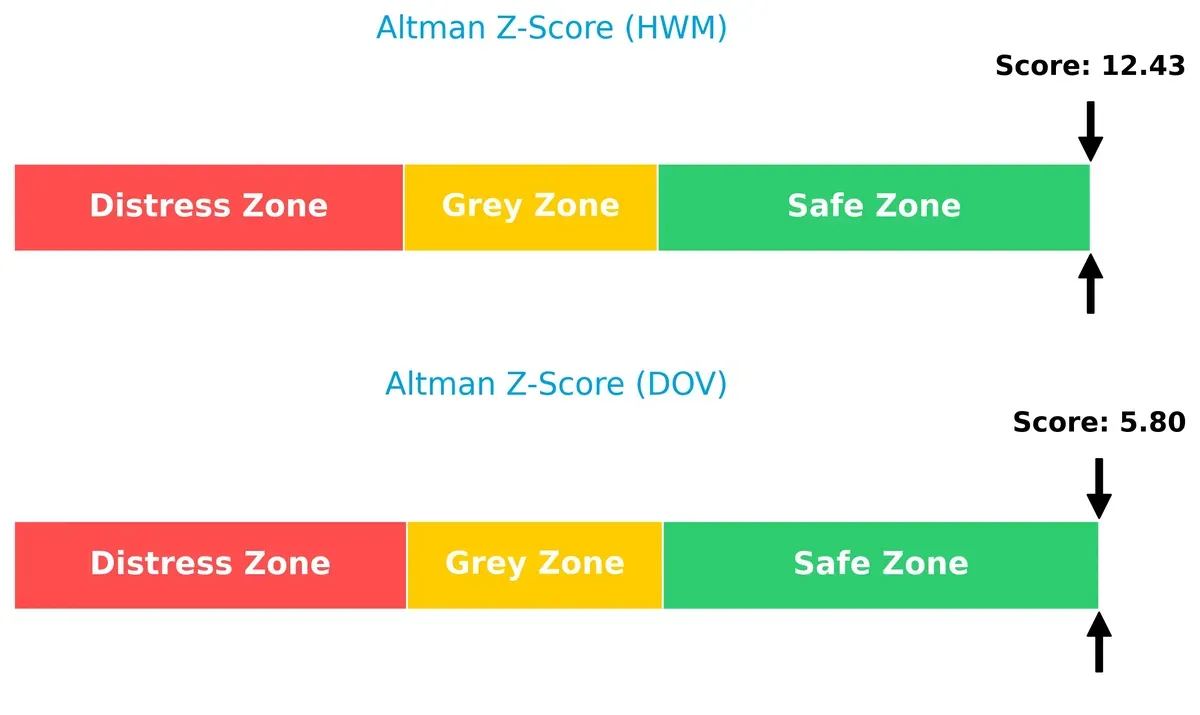
Bankruptcy Risk: Solvency Showdown
Howmet Aerospace’s Altman Z-Score of 12.4 versus Dover’s 5.8 confirms both firms reside comfortably in the safe zone, though Howmet’s superior score signals a stronger hedge against financial distress in this cycle:
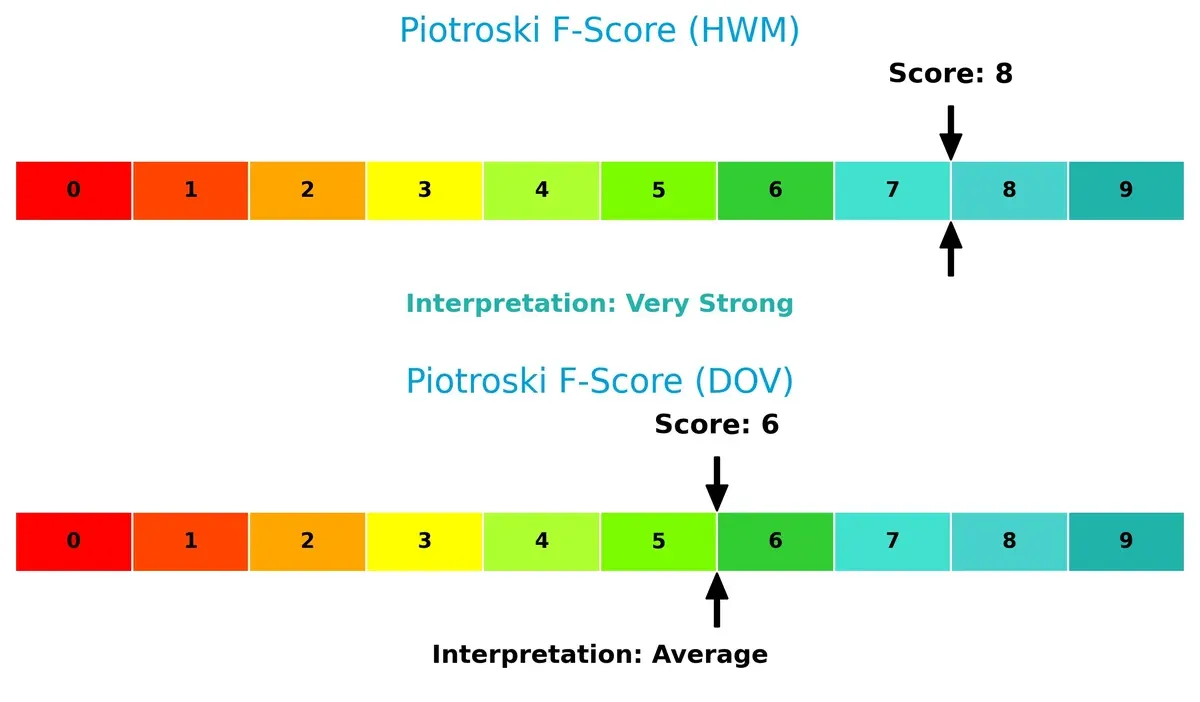
Financial Health: Quality of Operations
Howmet Aerospace’s Piotroski F-Score of 8 indicates very strong internal financial health, outperforming Dover’s average score of 6, which suggests moderate operational quality and slight caution in internal metrics:
How are the two companies positioned?
This section dissects the operational DNA of Howmet Aerospace and Dover by comparing revenue distribution and internal dynamics. The goal is to confront their economic moats and identify which model offers the most resilient, sustainable advantage today.
Revenue Segmentation: The Strategic Mix
This visual comparison dissects how Howmet Aerospace Inc. and Dover Corporation diversify income streams and where their primary sector bets lie:
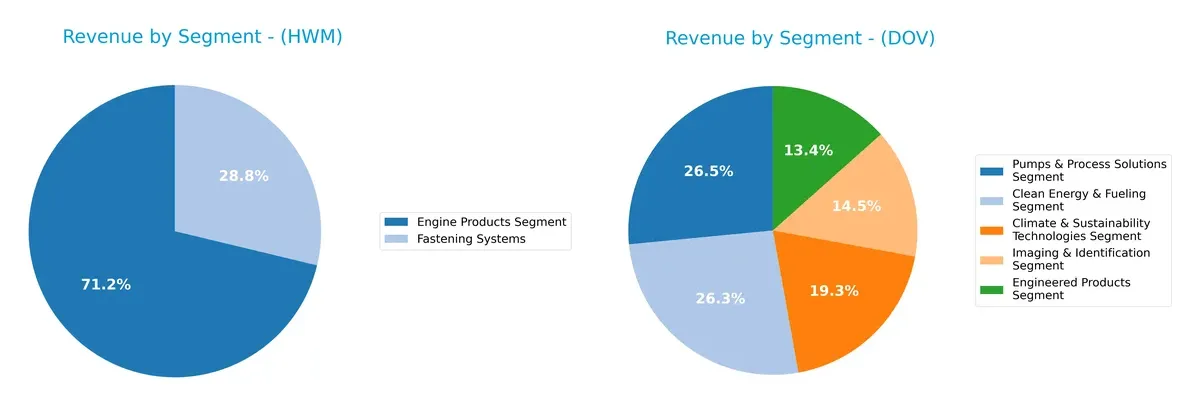
Howmet Aerospace anchors revenue in its Engine Products Segment with $4.3B in 2025, complemented by $1.7B from Fastening Systems, showing moderate diversification. Dover Corporation presents a more balanced mix, with five segments each surpassing $1B, including Pumps & Process Solutions and Clean Energy & Fueling, both above $2.1B. Dover’s broad segmentation reduces concentration risk, while Howmet’s reliance on aerospace engine products increases exposure to that sector’s cyclicality.
Strengths and Weaknesses Comparison
This table compares the Strengths and Weaknesses of Howmet Aerospace Inc. and Dover Corporation:
HWM Strengths
- Strong profitability with 18.27% net margin and 28.17% ROE
- Favorable liquidity ratios with current ratio 2.13 and quick ratio 1.09
- Diversified aerospace segments including Engine Products and Fastening Systems
- Solid global presence with significant US and European revenues
- Favorable debt to assets at 27.28% and high interest coverage of 14.11
DOV Strengths
- Diverse industrial segments including Clean Energy, Climate Technologies, and Pumps
- Favorable liquidity with current ratio 1.79 and quick ratio 1.28
- Solid debt profile with 24.79% debt to assets and favorable debt/equity of 0.45
- Strong fixed asset turnover at 7.23 indicating efficient asset use
- Global footprint with balanced revenue from US, Europe, and Asia
HWM Weaknesses
- High valuation multiples with PE at 54.93 and PB at 15.47
- Dividend yield low at 0.22%, less attractive to income investors
- Neutral asset turnover at 0.74 may suggest moderate operational efficiency
- Debt to equity ratio neutral at 0.57, not very conservative
DOV Weaknesses
- Lower profitability with net margin 13.52% and ROE 14.77% (neutral)
- PB at 3.62 considered unfavorable compared to peers
- Neutral ROIC at 9.45%, barely above WACC of 9.08%
- Dividend yield moderate at 1.06%, less competitive income profile
Overall, Howmet Aerospace shows stronger profitability and liquidity but carries a premium valuation and lower dividend yield. Dover offers broader diversification and efficient asset use but faces modest profitability and valuation pressures. Each company’s strengths and weaknesses will influence its strategic focus on growth, capital allocation, and investor appeal.
The Moat Duel: Analyzing Competitive Defensibility
A structural moat is the only true barrier protecting long-term profits from relentless competitive erosion. Let’s dissect the sources of defensibility for these two industrial giants:
Howmet Aerospace Inc.: Precision Engineering with Scale Moat
Howmet’s primary moat lies in its intangible assets and scale in aerospace components, driving a high ROIC of 8.8% above WACC. This delivers margin stability and accelerating profit growth. Expansion into aerospace and transportation markets in 2026 should deepen its technological lead and cost advantage.
Dover Corporation: Diverse Industrial Solutions with Fragmented Moat
Dover’s moat stems from its product diversification across industrial segments, contrasting Howmet’s focused aerospace edge. However, Dover’s ROIC barely exceeds WACC and shows a declining trend, signaling weakening competitive positioning. Opportunities in clean energy and automation could disrupt its core, but profitability pressures remain.
Focused Engineering Excellence vs. Diversified Industrial Reach
Howmet Aerospace holds a wider and deeper moat, evidenced by robust value creation and growing profitability. Dover’s fragmented moat and declining ROIC highlight vulnerability. I believe Howmet is better equipped to defend and expand its market share in 2026.
Which stock offers better returns?
The past year shows stark contrast in stock price growth and trading activity between Howmet Aerospace Inc. and Dover Corporation, highlighting divergent momentum and market sentiment.
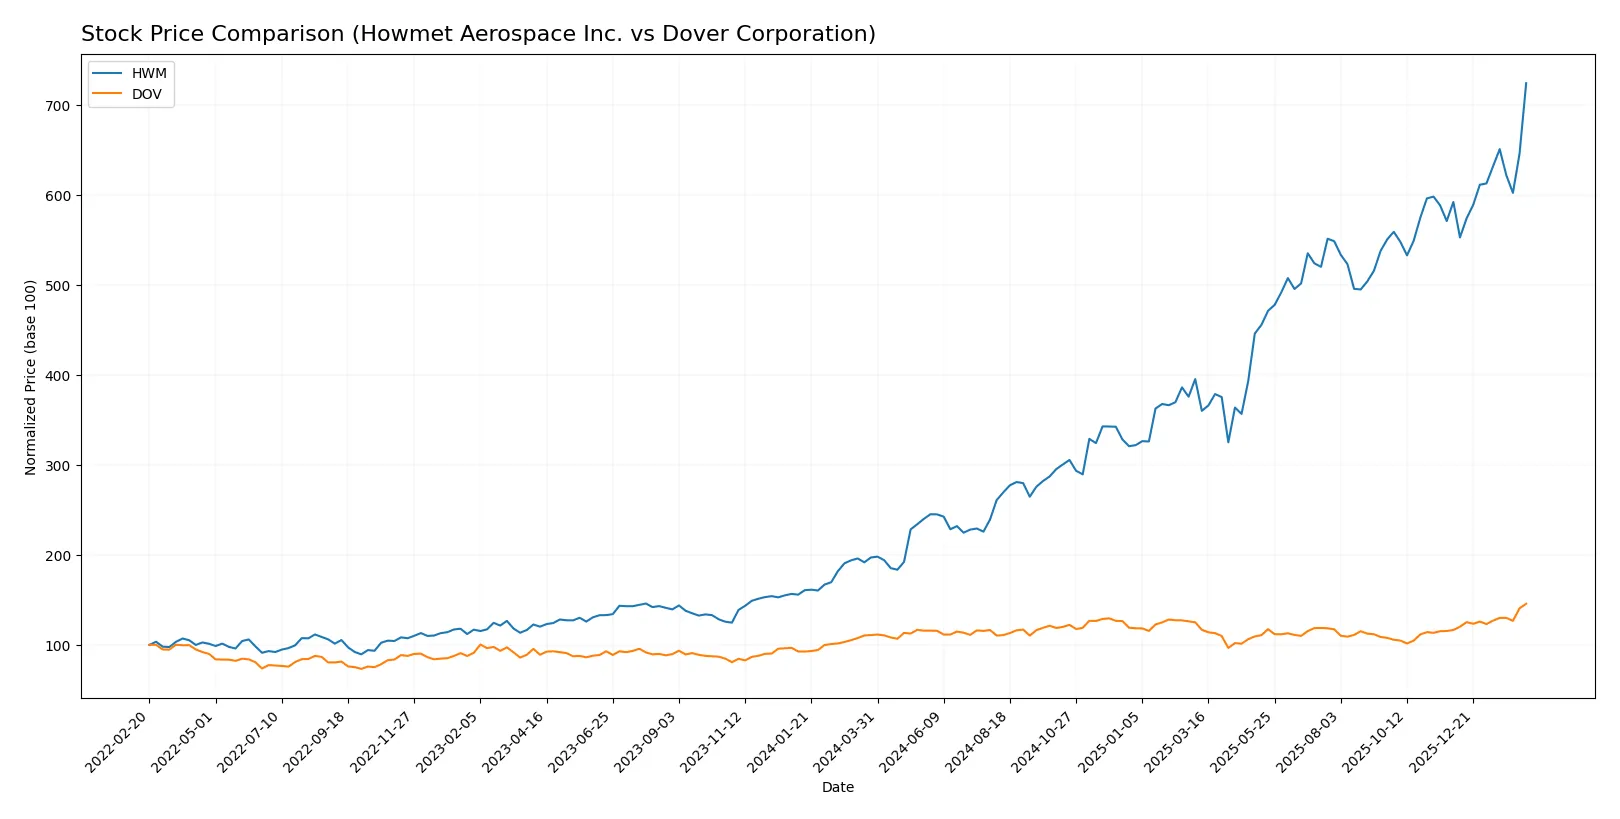
Trend Comparison
Howmet Aerospace Inc. (HWM) posts a 267.42% price increase over the past 12 months, confirming a strong bullish trend with accelerating gains. Volatility is high with a 48.78 standard deviation, and the price peaked at 250.21.
Dover Corporation (DOV) rises 31.3% in the same period, also bullish with acceleration but notably lower volatility at 12.76. Its price reached a high of 231.63, showing steadier upward movement.
HWM’s return significantly outpaces DOV’s, delivering superior market performance despite higher volatility, reinforcing its dominant bullish momentum.
Target Prices
Analysts show a moderately bullish consensus for Howmet Aerospace Inc. and Dover Corporation.
| Company | Target Low | Target High | Consensus |
|---|---|---|---|
| Howmet Aerospace Inc. | 209 | 290 | 259.63 |
| Dover Corporation | 195 | 256 | 223.7 |
Howmet Aerospace’s target consensus of 259.63 slightly exceeds its current price of 250.21, signaling modest upside potential. Dover Corporation’s consensus target of 223.7 sits below its current price of 231.63, suggesting limited near-term gains.

Don’t Let Luck Decide Your Entry Point
Optimize your entry points with our advanced ProRealTime indicators. You’ll get efficient buy signals with precise price targets for maximum performance. Start outperforming now!
How do institutions grade them?
Howmet Aerospace Inc. Grades
The following table summarizes recent grades from major financial institutions for Howmet Aerospace Inc.:
| Grading Company | Action | New Grade | Date |
|---|---|---|---|
| Susquehanna | maintain | Positive | 2026-02-13 |
| Citigroup | maintain | Buy | 2026-01-13 |
| B of A Securities | maintain | Buy | 2025-11-14 |
| JP Morgan | maintain | Overweight | 2025-11-10 |
| BTIG | maintain | Buy | 2025-11-03 |
| Goldman Sachs | maintain | Buy | 2025-11-03 |
| TD Cowen | maintain | Buy | 2025-10-31 |
| RBC Capital | maintain | Outperform | 2025-10-31 |
| UBS | maintain | Neutral | 2025-10-31 |
| Truist Securities | maintain | Buy | 2025-10-15 |
Dover Corporation Grades
The following table shows recent institutional grades for Dover Corporation:
| Grading Company | Action | New Grade | Date |
|---|---|---|---|
| JP Morgan | maintain | Overweight | 2026-01-30 |
| Wells Fargo | maintain | Equal Weight | 2026-01-30 |
| RBC Capital | maintain | Sector Perform | 2026-01-30 |
| Oppenheimer | maintain | Outperform | 2026-01-26 |
| JP Morgan | maintain | Overweight | 2026-01-16 |
| Barclays | maintain | Equal Weight | 2026-01-07 |
| Wells Fargo | maintain | Equal Weight | 2026-01-07 |
| UBS | upgrade | Buy | 2026-01-05 |
| Wells Fargo | maintain | Equal Weight | 2025-12-15 |
| Oppenheimer | maintain | Outperform | 2025-11-14 |
Which company has the best grades?
Howmet Aerospace consistently receives Buy and Outperform ratings from top-tier firms, indicating strong institutional confidence. Dover’s grades are more varied, mixing Equal Weight and Outperform, with fewer Buy ratings. This disparity suggests investors perceive Howmet as having a clearer growth trajectory and stronger momentum.
Risks specific to each company
The following categories identify the critical pressure points and systemic threats facing both firms in the 2026 market environment:
1. Market & Competition
Howmet Aerospace Inc.
- Operates in aerospace and transportation with strong niche segments, facing high competition from global industrial peers.
Dover Corporation
- Diverse industrial equipment provider across multiple end-markets, exposed to competitive pressures in automation and clean energy.
2. Capital Structure & Debt
Howmet Aerospace Inc.
- Moderate debt-to-equity ratio (0.57) with strong interest coverage (14.11), signaling balanced leverage.
Dover Corporation
- Slightly lower leverage (0.45 debt-to-equity) and solid interest coverage (13.52), reflecting prudent capital management.
3. Stock Volatility
Howmet Aerospace Inc.
- Beta at 1.25 indicates moderately high volatility, aligning with industrial machinery sector averages.
Dover Corporation
- Beta at 1.29 suggests similar volatility, slightly above Howmet, reflecting sensitivity to market swings.
4. Regulatory & Legal
Howmet Aerospace Inc.
- Aerospace industry exposure creates risk from defense and export regulations.
Dover Corporation
- Broad industrial exposure includes environmental and safety regulations, potentially costly compliance areas.
5. Supply Chain & Operations
Howmet Aerospace Inc.
- Complex global supply chains for specialized aerospace components sensitive to geopolitical disruptions.
Dover Corporation
- Diverse product lines face operational risks but benefit from distributed manufacturing and supplier base.
6. ESG & Climate Transition
Howmet Aerospace Inc.
- Faces pressure to reduce emissions in aerospace materials and manufacturing processes.
Dover Corporation
- Active in clean energy solutions, potentially benefiting from climate transition but also exposed to policy shifts.
7. Geopolitical Exposure
Howmet Aerospace Inc.
- Significant international footprint including China and Europe, increasing geopolitical risk.
Dover Corporation
- Primarily US-based but with global clients, less direct geopolitical exposure than Howmet.
Which company shows a better risk-adjusted profile?
Howmet’s primary risk stems from high valuation multiples and geopolitical supply chain fragility. Dover’s biggest challenge lies in balancing diversified industrial exposure with moderate valuation pressures. I see Howmet’s operational leverage and stronger profitability as offsetting some risks. However, Dover’s broader market diversification and cleaner balance sheet provide steadier risk control. The recent surge in Howmet’s P/E ratio to 54.9 versus Dover’s 24.5 confirms heightened market expectations and vulnerability to correction. Overall, Dover offers a more balanced risk-adjusted profile amid 2026 uncertainties.
Final Verdict: Which stock to choose?
Howmet Aerospace Inc. (HWM) excels as a cash-generating powerhouse with a growing moat, demonstrating efficient capital use and rising profitability. Its valuation appears stretched, which is a point of vigilance. It suits aggressive growth portfolios willing to pay a premium for continued expansion.
Dover Corporation (DOV) boasts a solid strategic moat rooted in diversified industrial operations and recurring revenue streams. It offers a more moderate safety profile with stable cash flow but shows signs of declining profitability. It fits well in GARP portfolios seeking balanced risk and growth.
If you prioritize aggressive growth and sustainable value creation, Howmet Aerospace outshines due to its expanding ROIC and robust income growth. However, if you seek stability with reasonable growth and a defensive industrial moat, Dover offers better stability despite recent profitability headwinds.
Disclaimer: Investment carries a risk of loss of initial capital. The past performance is not a reliable indicator of future results. Be sure to understand risks before making an investment decision.
Go Further
I encourage you to read the complete analyses of Howmet Aerospace Inc. and Dover Corporation to enhance your investment decisions: