Home > Comparison > Industrials > DOV vs GNRC
The strategic rivalry between Dover Corporation and Generac Holdings defines the current trajectory of the industrial machinery sector. Dover, a diversified industrial powerhouse, delivers equipment and digital solutions across multiple end markets. Generac focuses on power generation and energy storage, targeting residential and light commercial segments. This analysis pits broad industrial diversity against specialized energy innovation to identify which company offers a superior risk-adjusted return for a balanced portfolio.
Table of contents
Companies Overview
Dover Corporation and Generac Holdings shape critical segments of the industrial machinery market with distinct value propositions.
Dover Corporation: Diversified Industrial Equipment Leader
Dover Corporation operates as a global industrial machinery provider with a broad product portfolio spanning engineered products, clean energy, and climate technologies. It generates revenue through equipment, components, software, and service solutions across diverse end markets, including aerospace, retail fueling, and industrial automation. In 2026, Dover emphasizes expanding its digital and aftermarket services to enhance customer retention and operational efficiency.
Generac Holdings Inc.: Power Generation Innovator
Generac Holdings focuses on power generation and energy storage systems that serve residential, commercial, and industrial clients. It earns revenue by selling generators, portable power equipment, and clean energy solutions like PWRcell. The company prioritizes growth in clean energy and smart grid technologies this year, leveraging its Mobile Link remote monitoring system to increase product stickiness and market penetration.
Strategic Collision: Similarities & Divergences
Dover pursues a diversified industrial model with a focus on software-driven aftermarket services, while Generac adopts a specialized power generation approach emphasizing clean energy innovation. Their primary battleground is the growing demand for energy-efficient and digitally enabled equipment. Investors face contrasting profiles: Dover offers broad industrial exposure with steady cash flow, whereas Generac presents higher beta growth potential tied to energy transition trends.
Income Statement Comparison
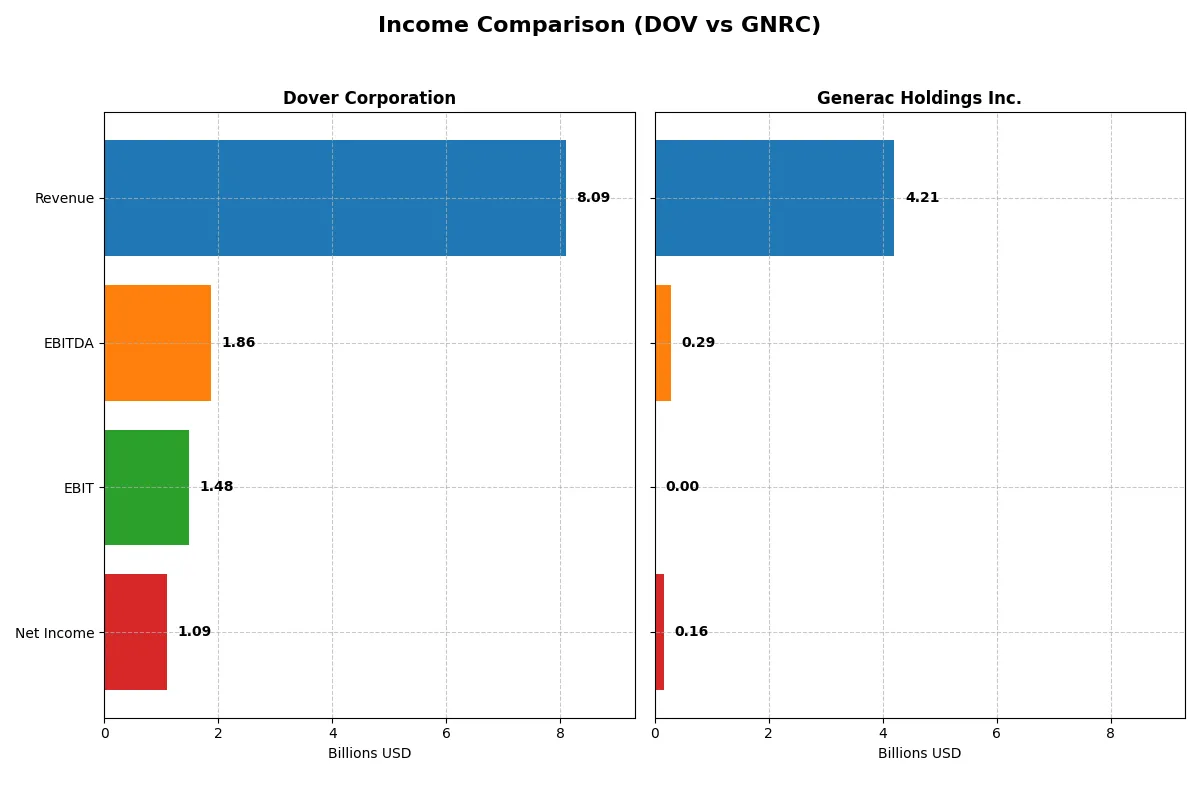
This data dissects the core profitability and scalability of both corporate engines to reveal who dominates the bottom line:
| Metric | Dover Corporation (DOV) | Generac Holdings Inc. (GNRC) |
|---|---|---|
| Revenue | 8.1B | 4.2B |
| Cost of Revenue | 4.9B | 2.6B |
| Operating Expenses | 1.8B | 1.3B |
| Gross Profit | 3.2B | 1.6B |
| EBITDA | 1.9B | 289M |
| EBIT | 1.5B | 0 |
| Interest Expense | 110M | -71M |
| Net Income | 1.1B | 160M |
| EPS | 7.97 | 2.73 |
| Fiscal Year | 2025 | 2025 |
Income Statement Analysis: The Bottom-Line Duel
This income statement comparison reveals which company runs a more efficient and profitable business engine over recent years.
Dover Corporation Analysis
Dover’s revenue shows mild growth, reaching $8.1B in 2025. Net income declined sharply to $1.1B from $2.7B in 2024, signaling profit pressure. Margins remain solid with a 39.8% gross margin and 13.5% net margin in 2025. However, a 21.4% EBIT drop indicates rising costs and slowed momentum.
Generac Holdings Inc. Analysis
Generac’s revenue fell 2% to $4.2B in 2025, with net income plunging 51% to $160M. Its gross margin stays healthy at 38.3%, yet EBIT margin collapsed to zero, reflecting operating struggles. The steep net margin decline to 3.8% shows weak profitability and deteriorating operational efficiency.
Margin Resilience vs. Profitability Decline
Dover sustains stronger margins and higher absolute profits despite recent setbacks. Generac’s sharper declines on profit metrics and flattening EBIT margin reveal operational challenges. Investors seeking resilience may favor Dover’s profile, while Generac’s volatile earnings suggest higher risk and uncertainty.
Financial Ratios Comparison
These vital ratios act as a diagnostic tool to expose the underlying fiscal health, valuation premiums, and capital efficiency of the companies compared below:
| Ratios | Dover Corporation (DOV) | Generac Holdings Inc. (GNRC) |
|---|---|---|
| ROE | 14.8% | 0% |
| ROIC | 9.4% | 0% |
| P/E | 24.5 | 50.0 |
| P/B | 3.62 | 0 |
| Current Ratio | 1.79 | 0 |
| Quick Ratio | 1.28 | 0 |
| D/E (Debt-to-Equity) | 0.45 | 0 |
| Debt-to-Assets | 24.8% | 0 |
| Interest Coverage | 12.5 | -4.1 |
| Asset Turnover | 0.60 | 0 |
| Fixed Asset Turnover | 7.23 | 0 |
| Payout Ratio | 25.9% | 0.18% |
| Dividend Yield | 1.06% | 0.00% |
| Fiscal Year | 2025 | 2025 |
Efficiency & Valuation Duel: The Vital Signs
Financial ratios act as the company’s DNA, exposing hidden risks and revealing operational excellence critical for investment decisions.
Dover Corporation
Dover delivers solid profitability with a 14.77% ROE and a 13.52% net margin, reflecting efficient operations. Its P/E of 24.49 suggests a fairly valued but slightly stretched stock. Shareholders receive modest dividends with a 1.06% yield, balancing returns while the company maintains a strong capital structure.
Generac Holdings Inc.
Generac struggles with zero ROE and a low 3.79% net margin, signaling operational challenges. The stock trades at a high P/E of 50.02, marking it as expensive and potentially overvalued. Generac pays no dividends, likely reinvesting heavily in R&D and growth amid financial uncertainties.
Balanced Efficiency vs. Overvaluation Risks
Dover offers a better blend of profitability and reasonable valuation, supporting stable shareholder returns. Generac’s stretched valuation and weak profitability introduce higher risk. Investors favoring operational safety may lean toward Dover, while those seeking growth amid uncertainty might consider Generac’s profile.
Which one offers the Superior Shareholder Reward?
I see Dover Corporation (DOV) offers a more balanced and sustainable shareholder reward than Generac Holdings (GNRC) in 2026. Dover pays a steady dividend yield around 1.1% with a prudent payout ratio near 26%, well-covered by free cash flow. Dover also runs consistent buybacks, enhancing total returns. Generac’s dividend yield is negligible (<0.01%) with almost zero payout, focusing on reinvestment and modest buybacks. While Generac targets growth, its weak profitability margins and high P/E ratio (50x) signal risk. Dover’s disciplined capital allocation, strong cash flow, and moderate leverage make its distribution model more durable. I conclude Dover delivers the superior total return profile for prudent investors.
Comparative Score Analysis: The Strategic Profile
The radar chart reveals the core financial DNA and strategic trade-offs of Dover Corporation and Generac Holdings Inc.:
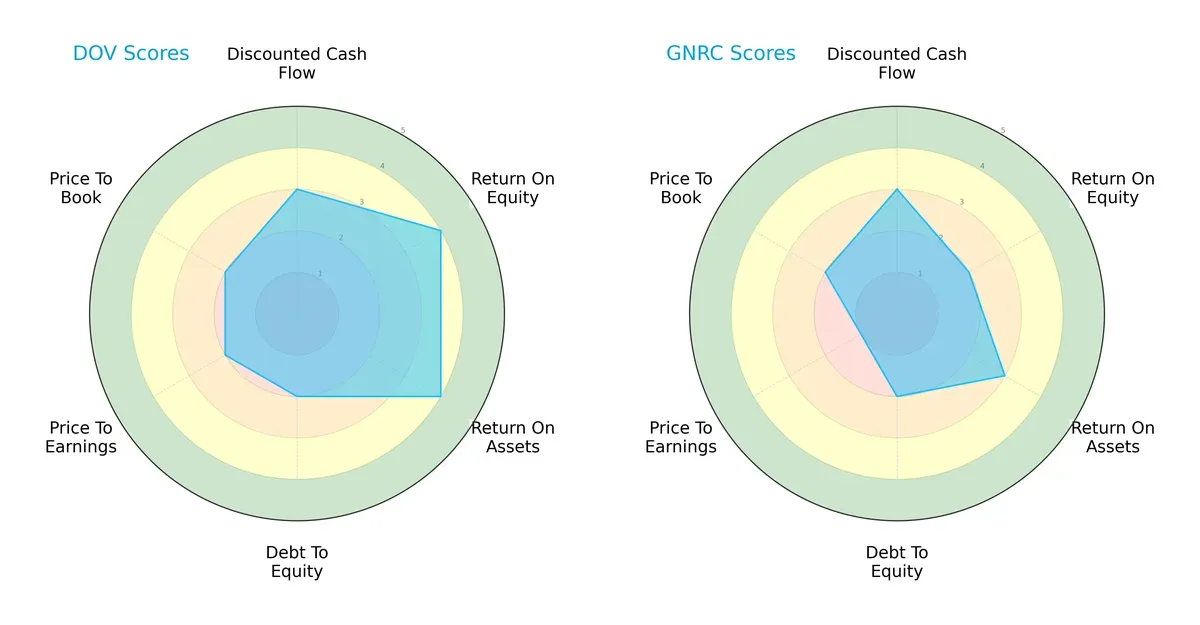
Dover shows a more balanced profile with strong returns on equity (4) and assets (4), but weaker valuation scores (PE 2, PB 2) and debt management (2). Generac leans on moderate asset returns (3) and discounted cash flow (3), yet suffers from poor valuation (PE 1) and overall weaker profitability (ROE 2). Dover’s diversified strengths offer stability; Generac relies more heavily on specific operational edges.
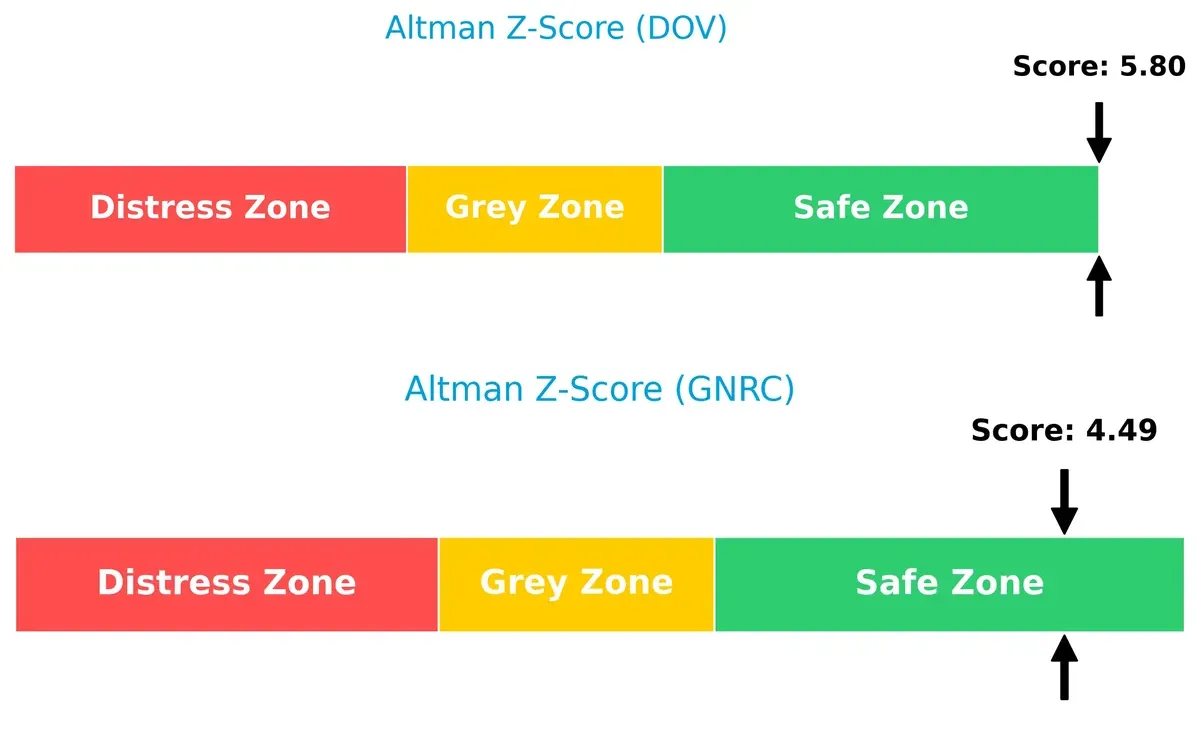
Bankruptcy Risk: Solvency Showdown
Dover’s Altman Z-Score of 5.80 significantly outpaces Generac’s 4.49, both safely above distress thresholds but indicating Dover’s stronger buffer against economic downturns:
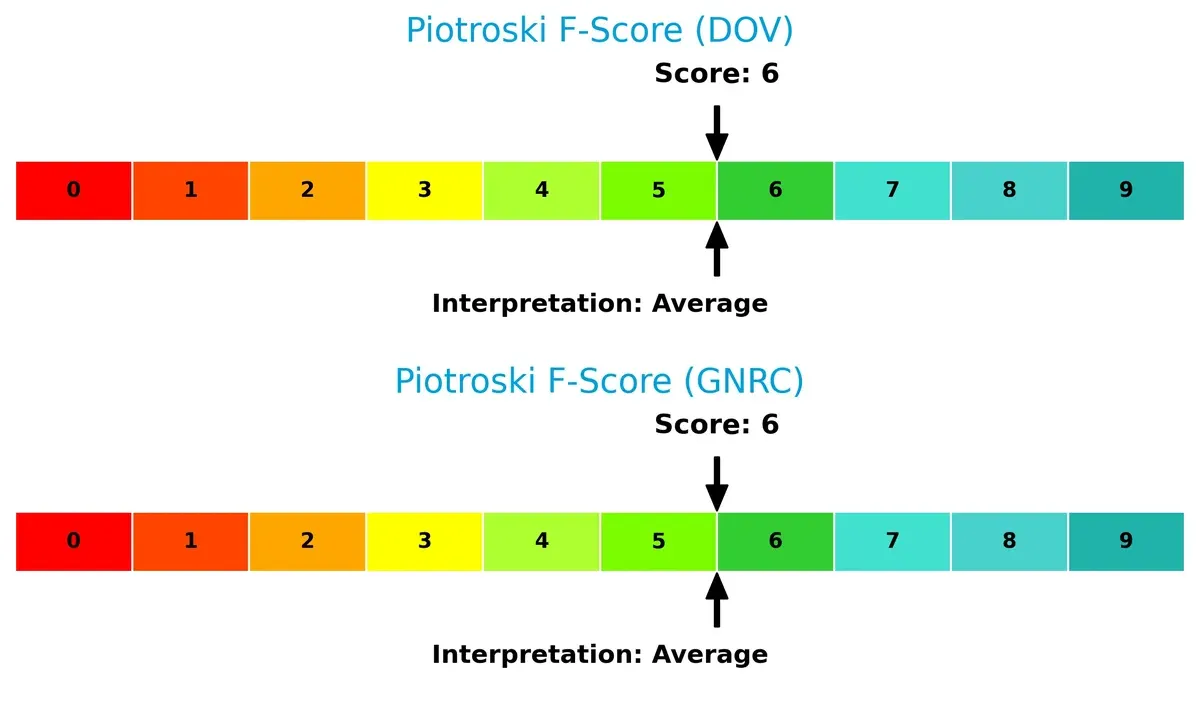
Financial Health: Quality of Operations
Both companies register a Piotroski F-Score of 6, signaling moderate financial health. Neither exhibits critical red flags, but neither achieves the strong (8-9) zone favored for resilient investments:
How are the two companies positioned?
This section dissects the operational DNA of Dover and Generac by comparing their revenue distribution and internal dynamics. The goal is to confront their economic moats and identify which model offers the most resilient competitive advantage today.
Revenue Segmentation: The Strategic Mix
This visual comparison dissects how Dover Corporation and Generac Holdings diversify their income streams and where their primary sector bets lie:
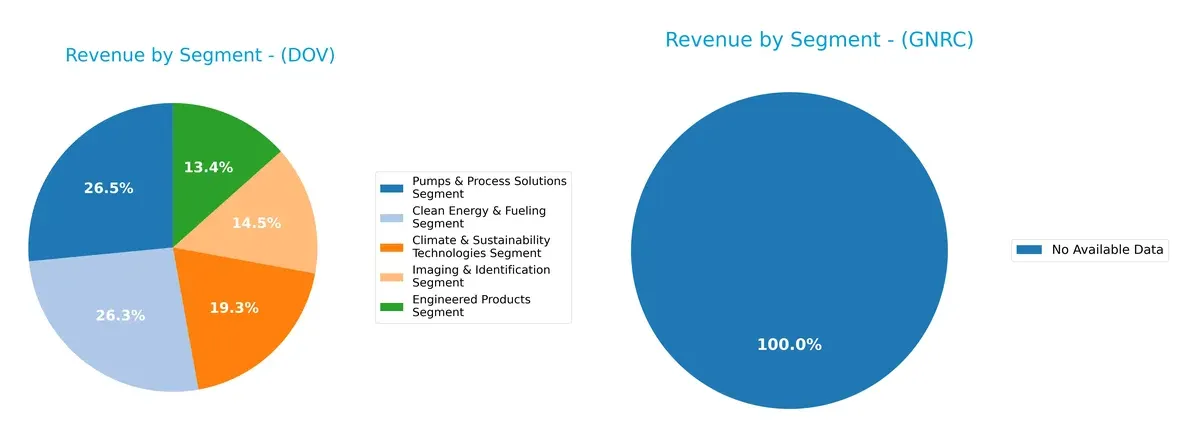
Dover Corporation exhibits a well-balanced revenue mix across five robust segments, with Pumps & Process Solutions anchoring at $2.15B and Clean Energy & Fueling close behind at $2.13B. In contrast, Generac Holdings lacks available data, making segmentation evaluation impossible. Dover’s diversification reduces concentration risk and signals resilience across industrial and clean energy markets. Its broad ecosystem fosters infrastructure dominance, unlike companies dependent on a single revenue stream.
Strengths and Weaknesses Comparison
This table compares the Strengths and Weaknesses of Dover Corporation and Generac Holdings Inc.:
Dover Corporation Strengths
- Diversified revenue across five segments
- Favorable net margin at 13.52%
- Strong liquidity with current ratio 1.79
- Low debt-to-assets at 24.79%
- Global presence spanning Americas, Asia, Europe
- Favorable interest coverage ratio of 13.52
Generac Holdings Inc. Strengths
- Favorable price-to-book ratio
- Low debt-to-equity and debt-to-assets ratios
- No reported debt burden
Dover Corporation Weaknesses
- Unfavorable price-to-book ratio at 3.62
- Neutral return on equity and invested capital
- Asset turnover at 0.6 is neutral, indicating moderate efficiency
Generac Holdings Inc. Weaknesses
- Unfavorable net margin and return metrics at or near zero
- Unavailable WACC impedes cost of capital analysis
- Unfavorable liquidity ratios, including current and quick ratios at 0
- Negative interest coverage signals financial stress
- Zero asset turnover and fixed asset turnover ratios
- No dividend yield
Despite Dover’s moderate returns and valuation concerns, its diversified segments and healthy liquidity underpin stability. Generac faces significant profitability and liquidity challenges, constraining its operational and financial flexibility.
The Moat Duel: Analyzing Competitive Defensibility
A structural moat is the sole barrier protecting long-term profits from relentless competition erosion. Let’s dissect the competitive moats of Dover Corporation and Generac Holdings:
Dover Corporation: Diversified Industrial Expertise with Intangible Assets
Dover’s moat stems from its broad product portfolio and strong intangible assets like proprietary technologies and service networks. This translates to steady gross margins near 40% and margin stability despite cyclical pressures. However, declining ROIC and net margin contraction signal risks to its moat’s durability in 2026.
Generac Holdings: Niche Power Solutions with Brand and Scale
Generac’s moat relies on brand recognition and specialized market focus in power generation equipment, contrasting Dover’s diversification. Despite favorable revenue growth over five years, sharp EBIT and net margin declines reveal operational stress. Its future hinges on innovation in energy storage and smart grid integration.
Industrial Muscle vs. Specialized Power: Who Holds the Moat Stronger?
Dover’s wider diversification offers a more resilient moat, even as profitability wanes. Generac’s narrower focus yields higher vulnerability amid margin compression. I find Dover better positioned to defend market share through scale and technological breadth in 2026.
Which stock offers better returns?
Over the past 12 months, both Dover Corporation and Generac Holdings have exhibited strong upward price momentum, with notable acceleration and increasing trading volumes highlighting robust market interest.
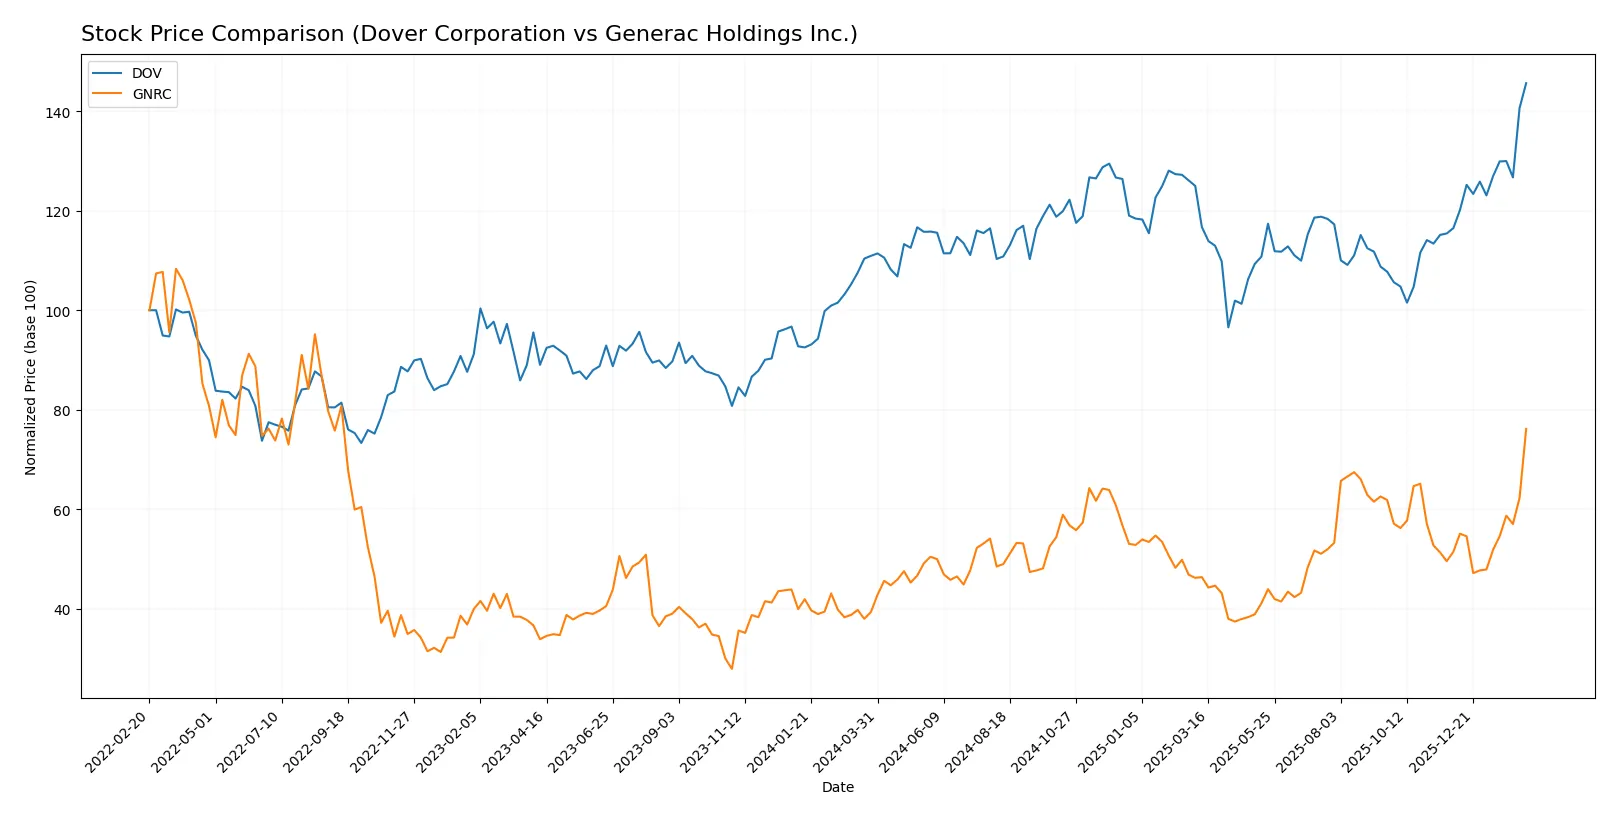
Trend Comparison
Dover Corporation’s stock rose 31.3% over the past year, showing a bullish trend with acceleration and a high near 231.63. Its volatility, measured by a 12.76% standard deviation, indicates moderate price swings.
Generac Holdings’ stock surged 93.64% in the same period, also bullish with acceleration. It reached a peak of 224.45 but with higher volatility at 22.77%, reflecting more pronounced price fluctuations.
Generac Holdings outperformed Dover Corporation in market returns, nearly tripling Dover’s gain, but with greater volatility and risk exposure over the analyzed timeframe.
Target Prices
Analysts show a bullish target consensus for Dover Corporation and Generac Holdings, suggesting upside potential from current prices.
| Company | Target Low | Target High | Consensus |
|---|---|---|---|
| Dover Corporation | 195 | 256 | 223.7 |
| Generac Holdings Inc. | 195 | 292 | 238.89 |
The consensus targets exceed current prices—Dover at $231.63 and Generac at $224.45—indicating analyst confidence in further appreciation.

Don’t Let Luck Decide Your Entry Point
Optimize your entry points with our advanced ProRealTime indicators. You’ll get efficient buy signals with precise price targets for maximum performance. Start outperforming now!
How do institutions grade them?
Dover Corporation Grades
The table below shows recent grades assigned to Dover Corporation by major institutions.
| Grading Company | Action | New Grade | Date |
|---|---|---|---|
| JP Morgan | maintain | Overweight | 2026-01-30 |
| Wells Fargo | maintain | Equal Weight | 2026-01-30 |
| RBC Capital | maintain | Sector Perform | 2026-01-30 |
| Oppenheimer | maintain | Outperform | 2026-01-26 |
| JP Morgan | maintain | Overweight | 2026-01-16 |
| Barclays | maintain | Equal Weight | 2026-01-07 |
| Wells Fargo | maintain | Equal Weight | 2026-01-07 |
| UBS | upgrade | Buy | 2026-01-05 |
| Wells Fargo | maintain | Equal Weight | 2025-12-15 |
| Oppenheimer | maintain | Outperform | 2025-11-14 |
Generac Holdings Inc. Grades
Below are the latest grades from established firms for Generac Holdings Inc.
| Grading Company | Action | New Grade | Date |
|---|---|---|---|
| Barclays | maintain | Equal Weight | 2026-02-13 |
| Wells Fargo | maintain | Overweight | 2026-02-12 |
| Guggenheim | downgrade | Neutral | 2026-02-12 |
| Guggenheim | maintain | Buy | 2026-02-10 |
| Barclays | maintain | Equal Weight | 2026-01-20 |
| Canaccord Genuity | maintain | Buy | 2026-01-13 |
| Baird | upgrade | Outperform | 2026-01-09 |
| Citigroup | upgrade | Buy | 2026-01-08 |
| B of A Securities | maintain | Buy | 2026-01-07 |
| Wells Fargo | upgrade | Overweight | 2025-12-19 |
Which company has the best grades?
Generac Holdings Inc. holds more buy and outperform ratings, indicating stronger institutional confidence. Dover Corporation shows a balanced mix, mostly equal weight and outperform grades. Investors may view Generac’s grades as signaling higher growth expectations.
Risks specific to each company
The following categories identify the critical pressure points and systemic threats facing both firms in the 2026 market environment:
1. Market & Competition
Dover Corporation
- Diversified industrial machinery portfolio reduces market risk but faces intense competition in multiple segments.
Generac Holdings Inc.
- Concentrated power generation market exposes Generac to intense competition and technological disruption risks.
2. Capital Structure & Debt
Dover Corporation
- Moderate leverage (D/E 0.45) with strong interest coverage (13.5x) signals good debt management.
Generac Holdings Inc.
- Lack of disclosed debt ratios and negative interest coverage raise serious financial stability concerns.
3. Stock Volatility
Dover Corporation
- Beta 1.29 indicates moderate volatility relative to the market, manageable for long-term investors.
Generac Holdings Inc.
- Higher beta at 1.81 suggests elevated price swings and higher risk for equity holders.
4. Regulatory & Legal
Dover Corporation
- Operating globally across industrial sectors, Dover is exposed to evolving safety and environmental regulations.
Generac Holdings Inc.
- Generac faces regulatory scrutiny in energy storage and emissions standards, increasing compliance costs.
5. Supply Chain & Operations
Dover Corporation
- Broad supplier base and diversified operations mitigate supply chain disruptions risk.
Generac Holdings Inc.
- Heavy reliance on specialized components for power systems increases vulnerability to supply chain shocks.
6. ESG & Climate Transition
Dover Corporation
- Investment in clean energy and climate tech segments supports positive ESG momentum.
Generac Holdings Inc.
- ESG efforts in renewable energy are nascent, posing transition risks amid tightening climate policies.
7. Geopolitical Exposure
Dover Corporation
- Global footprint subjects Dover to trade tensions and currency volatility risks.
Generac Holdings Inc.
- Primarily US-focused, Generac has limited geographic diversification but faces domestic policy shifts.
Which company shows a better risk-adjusted profile?
Dover’s strongest risk is market competition, but it manages financial and operational risks prudently. Generac’s critical risk lies in weak financial health and high stock volatility. Dover’s superior debt management, stable Altman Z-Score (5.8 safe zone), and moderate beta indicate a better risk-adjusted profile. Generac’s negative interest coverage and unfavorable profitability ratios expose it to heightened financial distress risk. Recent ratio data confirm Generac’s fragile liquidity and earnings challenges, underscoring caution for investors.
Final Verdict: Which stock to choose?
Dover Corporation’s superpower lies in its consistent operational efficiency and strong cash flow generation. Its solid balance sheet and favorable interest coverage support financial resilience. A point of vigilance remains its slightly declining profitability trend, which could pressure returns. Dover fits well in portfolios targeting stable, moderate growth with a defensive tilt.
Generac Holdings’ strategic moat centers on its niche in power solutions with recurring revenue potential. While it faces challenges in profitability and a more volatile earnings profile, it offers higher price momentum and growth upside. Its relatively riskier profile suits investors focused on growth at a reasonable price, willing to tolerate short-term earnings volatility.
If you prioritize financial stability and cash flow reliability, Dover outshines with its operational discipline and safer balance sheet. However, if you seek higher growth potential and can absorb earnings swings, Generac offers superior upside momentum. Each presents an analytical scenario tailored to distinct investor risk appetites and portfolio goals.
Disclaimer: Investment carries a risk of loss of initial capital. The past performance is not a reliable indicator of future results. Be sure to understand risks before making an investment decision.
Go Further
I encourage you to read the complete analyses of Dover Corporation and Generac Holdings Inc. to enhance your investment decisions: