Home > Comparison > Industrials > EMR vs DOV
The strategic rivalry between Emerson Electric Co. and Dover Corporation shapes industrial machinery’s future. Emerson operates as a diversified technology and engineering powerhouse, spanning automation and commercial solutions. Dover, in contrast, focuses on specialized equipment, software, and sustainable technologies across multiple niche markets. This head-to-head highlights a contest between broad industrial integration and targeted innovation. This analysis aims to identify which trajectory offers superior risk-adjusted returns for a diversified portfolio in industrials.
Table of contents
Companies Overview
Emerson Electric Co. and Dover Corporation stand as pivotal players in the industrial machinery sector with distinct market footprints.
Emerson Electric Co.: Industrial Automation Powerhouse
Emerson Electric Co. operates primarily as a technology and engineering leader in industrial and residential markets worldwide. Its core revenue engine lies in Automation Solutions and Commercial & Residential Solutions, offering sophisticated process control systems and HVAC products. In 2026, Emerson emphasizes enhancing energy modeling services and integrating IoT-enabled controls to boost operational efficiency across global industries.
Dover Corporation: Diverse Industrial Solutions Provider
Dover Corporation commands its niche by delivering specialized equipment and digital solutions across multiple industrial end-markets. Its revenue streams are diversified among Engineered Products, Clean Energy & Fueling, Imaging and Identification, and Pumps and Process Solutions segments. Dover’s 2026 strategic focus sharpens on clean energy solutions and expanding aftermarket services to capture growth in evolving sustainable technologies.
Strategic Collision: Similarities & Divergences
Both companies prioritize industrial innovation but diverge sharply in scope: Emerson champions integrated automation and environmental controls, while Dover bets on multi-segment equipment and clean energy infrastructure. Their competitive battleground centers on industrial efficiency and sustainable technology adoption. Emerson’s scale and software integration contrast with Dover’s diversified portfolio and aftermarket emphasis, defining distinct investment profiles in industrial machinery.
Income Statement Comparison
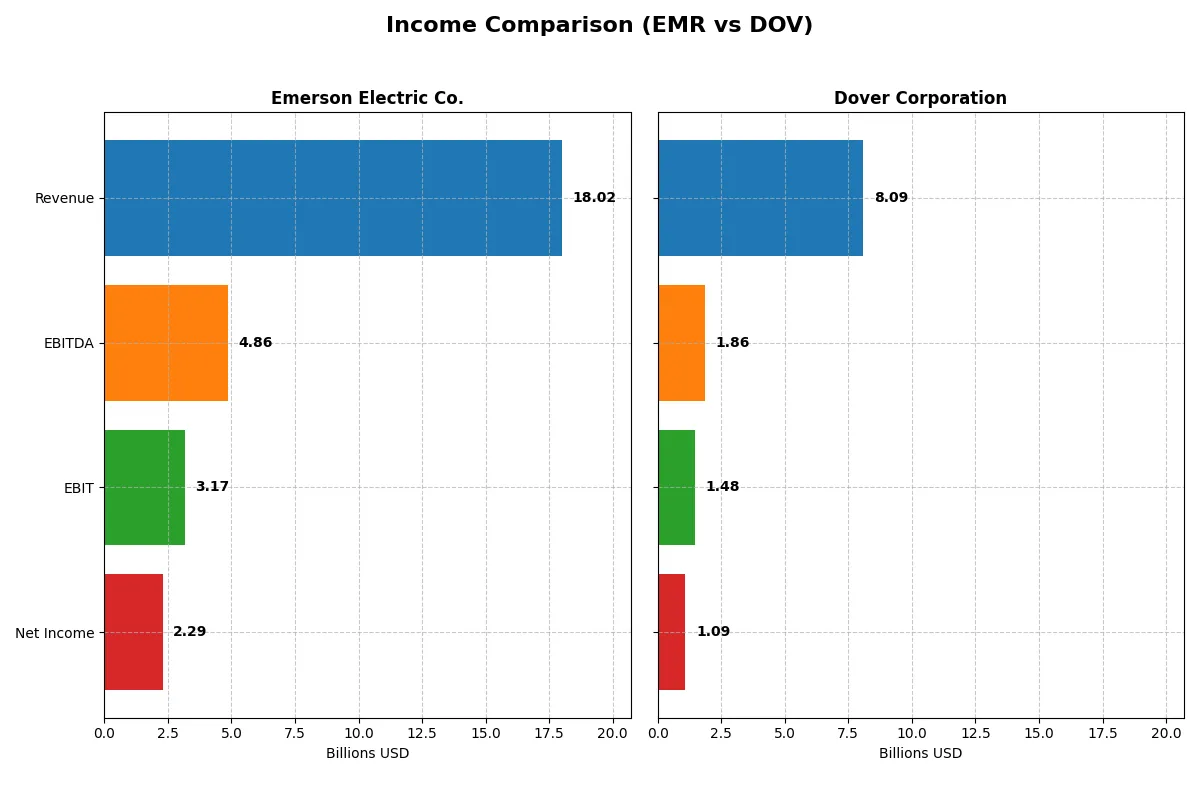
This data dissects the core profitability and scalability of both corporate engines to reveal who dominates the bottom line:
| Metric | Emerson Electric Co. (EMR) | Dover Corporation (DOV) |
|---|---|---|
| Revenue | 18.0B | 8.1B |
| Cost of Revenue | 8.5B | 4.9B |
| Operating Expenses | 7.3B | 1.8B |
| Gross Profit | 9.5B | 3.2B |
| EBITDA | 4.9B | 1.9B |
| EBIT | 3.2B | 1.5B |
| Interest Expense | 237M | 110M |
| Net Income | 2.3B | 1.1B |
| EPS | 4.06 | 7.97 |
| Fiscal Year | 2025 | 2025 |
Income Statement Analysis: The Bottom-Line Duel
Comparing these income statements reveals which company operates its business engine more efficiently and delivers stronger profitability.
Emerson Electric Co. Analysis
Emerson Electric’s revenue rose 3.0% in 2025 to $18.0B, with net income increasing 16.5% to $2.29B. Gross margin improved to 52.8%, reflecting solid cost control. EBIT margin at 17.6% signals robust operating efficiency. Despite slower revenue growth, the company shows strong momentum in profitability and margin expansion.
Dover Corporation Analysis
Dover’s 2025 revenue grew 4.5% to $8.1B, but net income declined sharply by 59.4% to $1.09B. Gross margin at 39.8% is healthy, but EBIT margin of 18.3% masks a steep decline in net margin and EPS, indicating rising costs or one-off charges impacted the bottom line. Momentum is weak with profitability under pressure.
Margin Strength vs. Earnings Momentum
Emerson Electric outperforms Dover with higher revenue scale and margin expansion driving a 13% net margin growth in 2025. Dover’s revenue growth is moderate, but deteriorating net income and EPS highlight operational challenges. Investors favor Emerson’s profile for steady margin improvement and earnings momentum over Dover’s volatile profitability.
Financial Ratios Comparison
These vital ratios act as a diagnostic tool to expose the underlying fiscal health, valuation premiums, and capital efficiency of the companies compared below:
| Ratios | Emerson Electric Co. (EMR) | Dover Corporation (DOV) |
|---|---|---|
| ROE | 11.3% | N/A |
| ROIC | 4.6% | N/A |
| P/E | 32.4 | 24.5 |
| P/B | 3.67 | N/A |
| Current Ratio | 0.88 | 0 |
| Quick Ratio | 0.65 | 0 |
| D/E | 0.68 | 0 |
| Debt-to-Assets | 32.8% | 0 |
| Interest Coverage | 9.44 | 12.51 |
| Asset Turnover | 0.43 | 0 |
| Fixed Asset Turnover | 5.14 | 0 |
| Payout ratio | 52.0% | 25.9% |
| Dividend yield | 1.60% | 1.06% |
| Fiscal Year | 2025 | 2025 |
Efficiency & Valuation Duel: The Vital Signs
Financial ratios serve as a company’s DNA, uncovering hidden risks and operational strengths that influence investment decisions.
Emerson Electric Co.
Emerson Electric posts a solid net margin of 12.73% but shows a modest ROE at 11.31%, indicating average profitability. Its P/E of 32.42 signals a stretched valuation, while the P/B of 3.67 further confirms premium pricing. The company offers a 1.6% dividend yield, balancing shareholder returns with reinvestment needs amid mixed capital efficiency metrics.
Dover Corporation
Dover boasts a slightly higher net margin at 13.52%, though ROE and ROIC data are unavailable, limiting full profitability insight. The P/E of 24.49 suggests a more reasonable valuation compared to Emerson. With a 1.06% dividend yield and favorable debt metrics, Dover appears less leveraged but lacks comprehensive efficiency ratios, complicating direct operational comparisons.
Premium Valuation vs. Operational Transparency
Emerson’s higher valuation reflects confidence in its consistent profitability and dividend, despite some efficiency weaknesses. Dover offers a more attractive price but lacks critical profitability data, raising transparency concerns. Investors prioritizing clear operational metrics may lean toward Emerson, while those favoring valuation might consider Dover’s lower price profile.
Which one offers the Superior Shareholder Reward?
I see Emerson Electric (EMR) yields around 1.6% with a 52% payout ratio in 2025, signaling balanced dividends supported by 86% free cash flow coverage. Dover Corporation (DOV) offers a lower yield near 1.06% with a conservative 26% payout, retaining more cash for growth. EMR’s buyback pace is steady, enhancing returns alongside dividends. DOV’s free cash flow per share outpaces EMR’s, fueling moderate buybacks and healthy dividend growth. I favor EMR’s distribution mix for sustainable total returns, blending dividends and buybacks well, making it more attractive to income-focused investors in 2026.
Comparative Score Analysis: The Strategic Profile
The radar chart reveals the fundamental DNA and trade-offs of Emerson Electric Co. and Dover Corporation, highlighting their financial strengths and weaknesses:
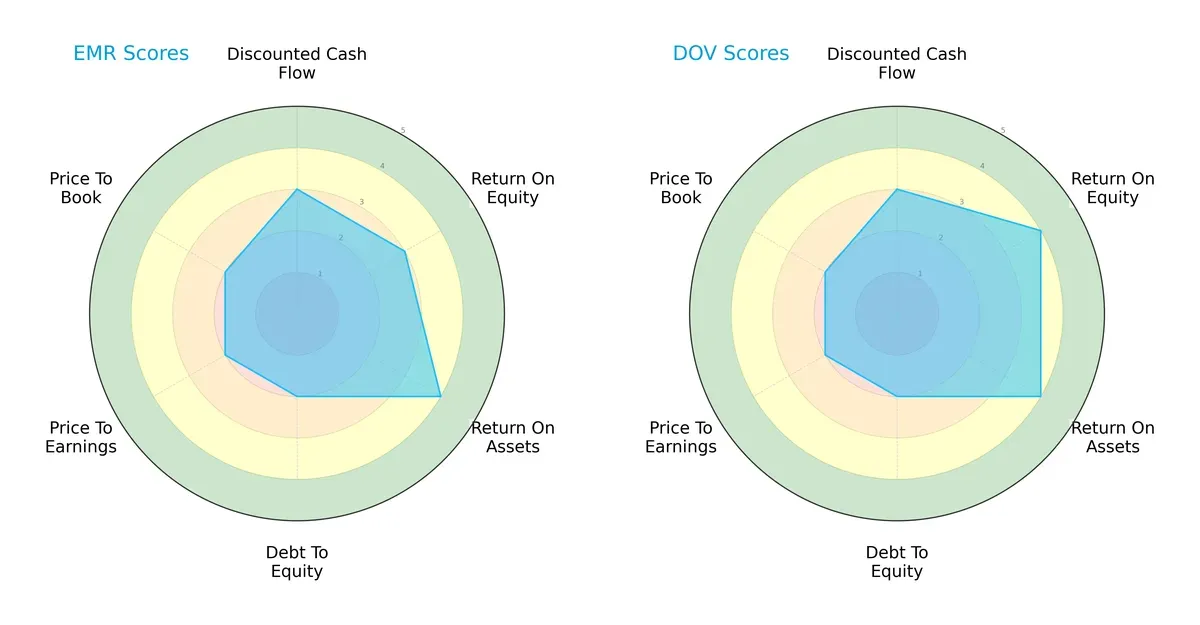
Both firms hold moderate overall scores, with Emerson showing strength in asset utilization (ROA 4) and Dover excelling in equity efficiency (ROE 4). Emerson’s profile leans on asset efficiency but carries a slightly weaker debt-to-equity score (2), signaling moderate leverage risk. Dover presents a more balanced profile, scoring favorably in both ROE and ROA, yet both companies share moderate valuation metrics (P/E and P/B scores of 2). Dover edges ahead in profitability metrics, while Emerson’s asset use is its key differentiator.
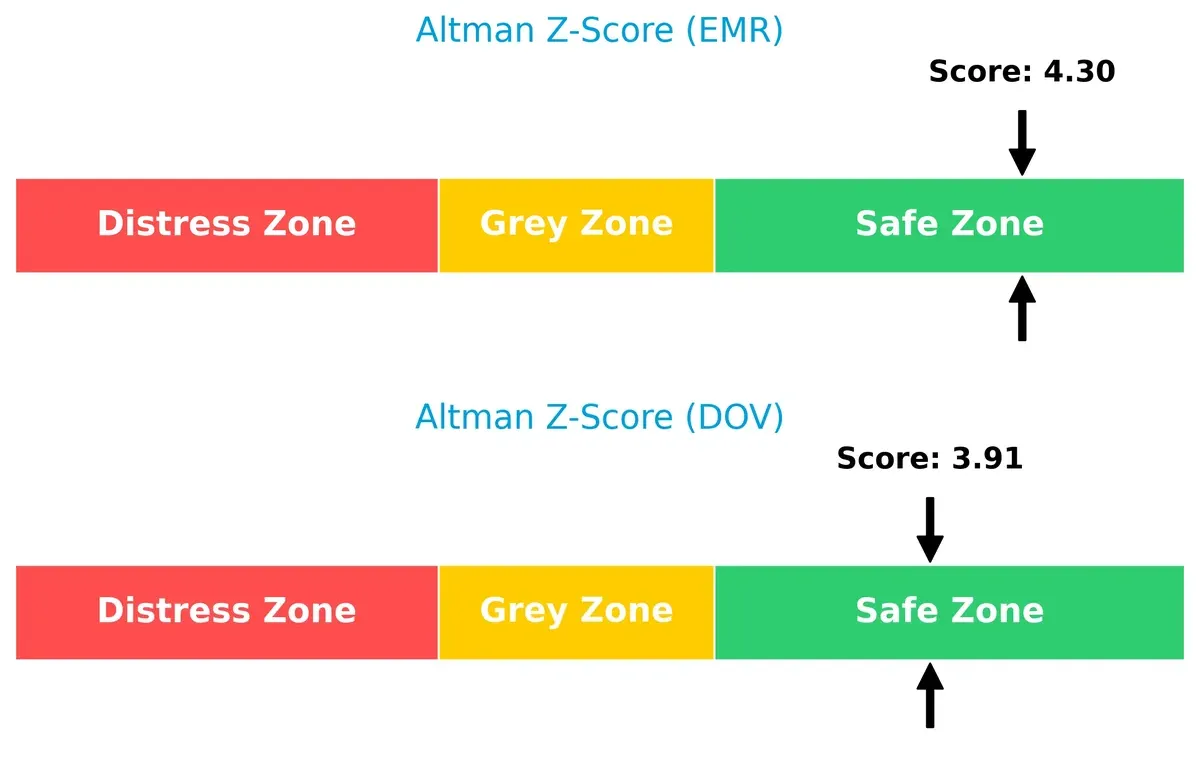
Bankruptcy Risk: Solvency Showdown
Emerson’s Altman Z-Score of 4.3 versus Dover’s 3.9 places both firms comfortably in the safe zone, suggesting robust financial stability and low bankruptcy risk in this cycle:
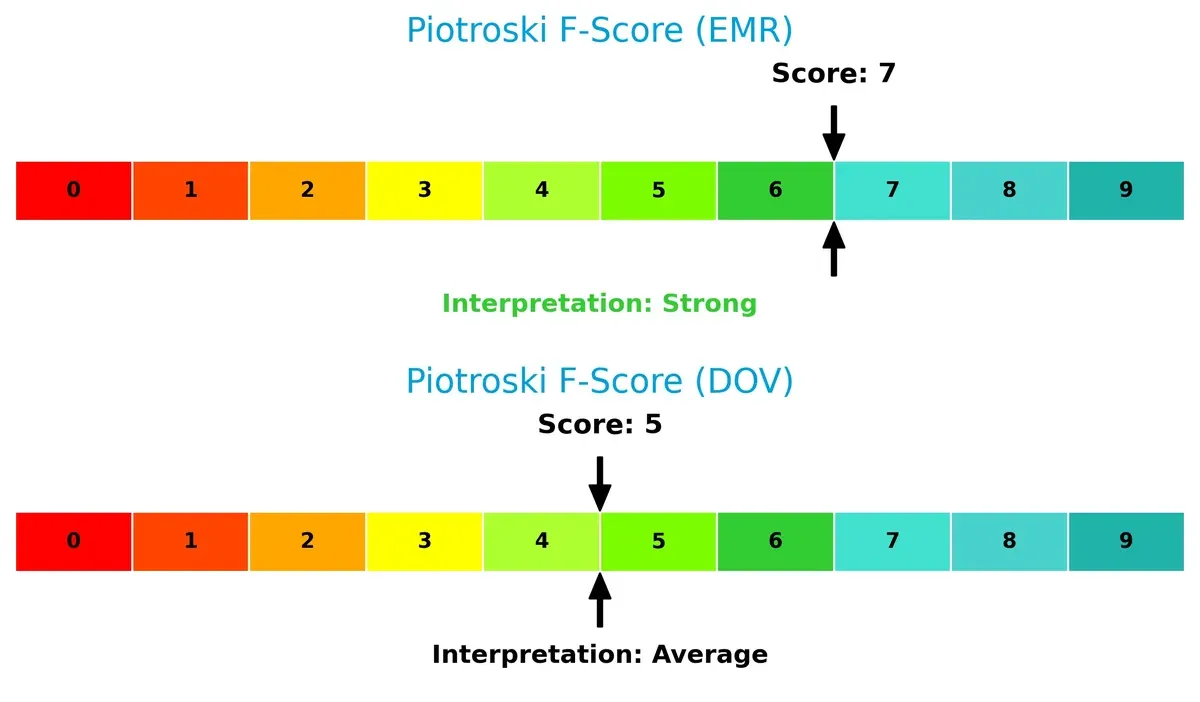
Financial Health: Quality of Operations
Emerson’s Piotroski F-Score of 7 signals strong financial health, outpacing Dover’s average score of 5. Emerson shows fewer red flags in profitability and operational efficiency:
How are the two companies positioned?
This section dissects Emerson Electric Co. and Dover Corporation’s operational DNA by comparing their revenue distribution and internal dynamics. The goal is to confront their economic moats to reveal which model delivers the most resilient competitive advantage today.
Revenue Segmentation: The Strategic Mix
This comparison dissects how Emerson Electric Co. and Dover Corporation diversify their income streams and where their primary sector bets lie:
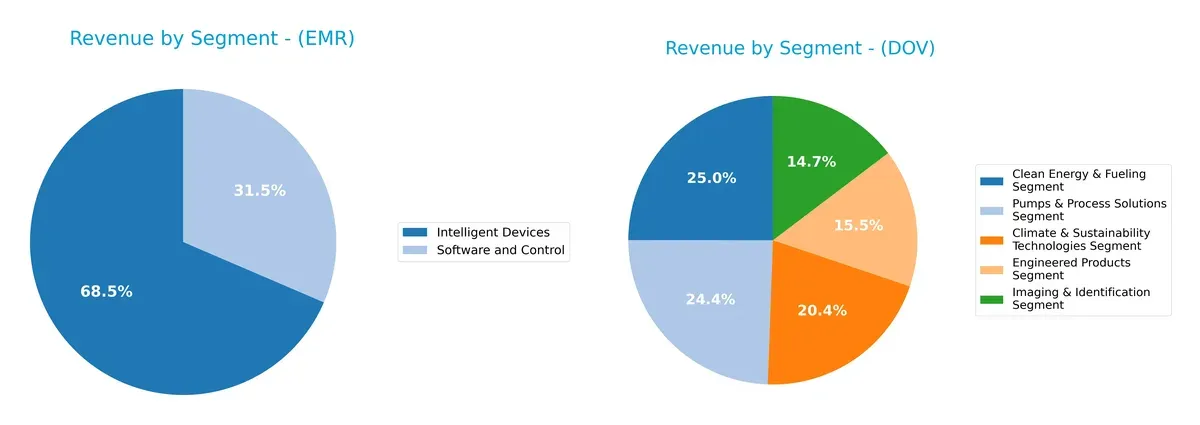
Emerson Electric Co. pivots heavily on “Intelligent Devices” with $12.4B in 2025, anchoring its revenue. Its second segment, “Software and Control,” lags at $5.7B, showing a moderate diversification. Dover Corporation displays a more balanced mix in 2024, with top segments clustered near $1.9B each, avoiding reliance on a single source. Emerson’s concentration risks contrast Dover’s broader ecosystem, which supports resilience across industrial cycles.
Strengths and Weaknesses Comparison
This table compares the strengths and weaknesses of Emerson Electric Co. (EMR) and Dover Corporation (DOV):
EMR Strengths
- Diverse product segments including Intelligent Devices and Software Control
- Strong net margin at 12.73%
- Favorable interest coverage at 13.38
- Solid fixed asset turnover at 5.14
- Established global presence with significant Americas and Asia revenues
DOV Strengths
- Multiple business segments with balanced revenue streams
- Highest net margin at 13.52%
- Favorable debt-to-equity and debt-to-assets ratios
- Strong interest coverage at 13.52
- Lower valuation multiples suggesting potential value
EMR Weaknesses
- Unfavorable ROIC below WACC at 4.6% indicating weak capital returns
- Low current and quick ratios under 1 signal liquidity concerns
- High P/E and P/B ratios suggest overvaluation
- Low asset turnover at 0.43 may affect efficiency
- ROE only neutral at 11.31%
DOV Weaknesses
- Zero reported ROE and ROIC indicate poor capital efficiency
- Unavailable WACC limits cost of capital analysis
- Current and quick ratios reported as zero indicate potential data or liquidity issues
- Unfavorable asset and fixed asset turnover ratios reduce operational efficiency
Emerson shows strength in product diversification and global footprint but faces challenges in capital efficiency and liquidity. Dover benefits from strong profitability and conservative leverage but suffers from unclear efficiency metrics and incomplete liquidity data. Both companies exhibit slightly unfavorable overall financial health, underlining the need for strategic focus on improving operational and capital returns.
The Moat Duel: Analyzing Competitive Defensibility
A structural moat alone shields long-term profits from relentless competition erosion. Let’s dissect how Emerson Electric Co. and Dover Corporation defend their turf:
Emerson Electric Co.: Intangible Assets Driving Margin Stability
Emerson’s moat centers on its vast intangible assets and engineering expertise. This manifests in strong 52.8% gross margins and stable 12.7% net margins. However, declining ROIC signals profit erosion in 2026, posing a significant threat to this moat.
Dover Corporation: Cost Advantage with Mixed Profitability Signals
Dover’s competitive edge lies in cost advantage through diversified industrial equipment. Despite a solid 18.3% EBIT margin, its 2025 EBIT and net margin sharply declined, reflecting operational challenges. Future growth depends on revitalizing efficiency and market expansion.
Margin Strength vs. Profitability Decline: The Moat Battle
Emerson boasts wider margins but suffers from declining capital returns, indicating a weakening moat. Dover’s cost advantage offers resilience but recent margin contraction undermines stability. Emerson’s intangible assets currently provide a deeper moat, yet both firms must innovate to defend market share in 2026.
Which stock offers better returns?
The past year shows clear upward momentum for both Emerson Electric Co. and Dover Corporation, with notable price gains and accelerating trends highlighting strong investor interest.
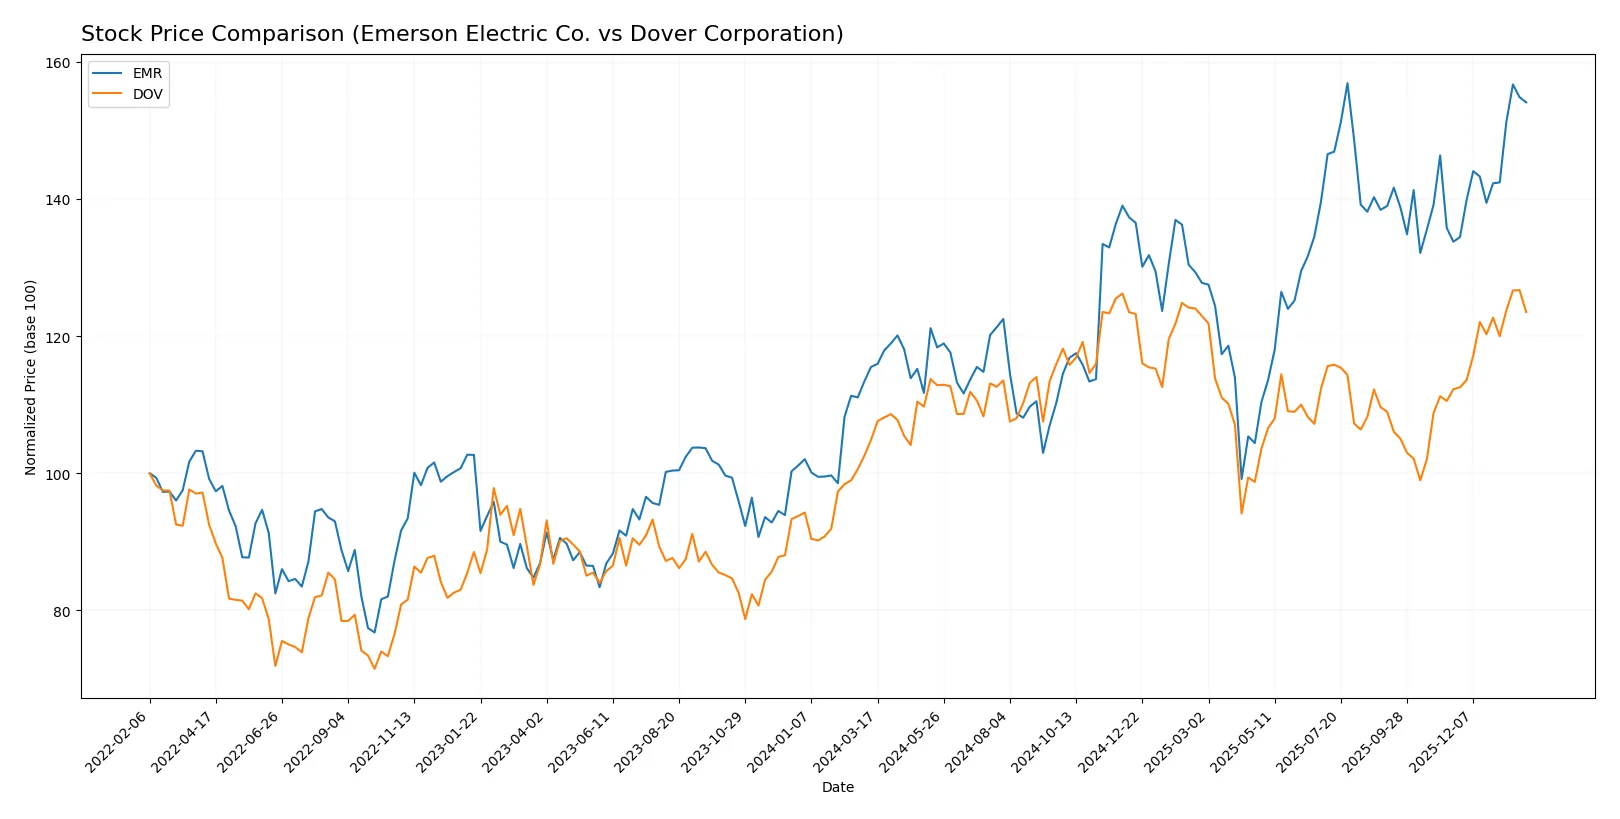
Trend Comparison
Emerson Electric Co.’s stock gained 33.42% over the past year, marking a bullish trend with accelerating momentum and a high volatility of 13.03%. It reached a peak at 149.63 and a low at 94.57.
Dover Corporation’s stock rose 17.81% over the same period, also bullish with accelerating momentum but lower volatility at 11.33%. The highest price touched 206.71, with a floor of 153.55.
Emerson Electric outperformed Dover in market returns, delivering nearly double the price appreciation despite higher volatility, signaling stronger overall performance.
Target Prices
Analysts present a constructive consensus for Emerson Electric Co. and Dover Corporation.
| Company | Target Low | Target High | Consensus |
|---|---|---|---|
| Emerson Electric Co. | 125 | 170 | 149.67 |
| Dover Corporation | 195 | 256 | 221.38 |
Emerson’s target consensus sits slightly above its current price of 147, implying modest upside. Dover’s consensus target significantly exceeds its 201 price, signaling stronger expected gains.

Don’t Let Luck Decide Your Entry Point
Optimize your entry points with our advanced ProRealTime indicators. You’ll get efficient buy signals with precise price targets for maximum performance. Start outperforming now!
How do institutions grade them?
The following tables summarize recent institutional grades for Emerson Electric Co. and Dover Corporation:
Emerson Electric Co. Grades
This table shows the latest grades and rating actions from key institutions for Emerson Electric Co.:
| Grading Company | Action | New Grade | Date |
|---|---|---|---|
| Oppenheimer | Downgrade | Perform | 2026-01-27 |
| JP Morgan | Maintain | Neutral | 2026-01-16 |
| Wells Fargo | Maintain | Equal Weight | 2026-01-07 |
| Barclays | Maintain | Equal Weight | 2026-01-07 |
| UBS | Upgrade | Buy | 2026-01-05 |
| Jefferies | Downgrade | Hold | 2025-12-10 |
| JP Morgan | Maintain | Neutral | 2025-11-10 |
| RBC Capital | Maintain | Outperform | 2025-11-06 |
| Barclays | Maintain | Equal Weight | 2025-11-06 |
| RBC Capital | Maintain | Outperform | 2025-10-16 |
Dover Corporation Grades
This table presents recent grades and rating actions from major analysts for Dover Corporation:
| Grading Company | Action | New Grade | Date |
|---|---|---|---|
| JP Morgan | Maintain | Overweight | 2026-01-30 |
| Wells Fargo | Maintain | Equal Weight | 2026-01-30 |
| RBC Capital | Maintain | Sector Perform | 2026-01-30 |
| Oppenheimer | Maintain | Outperform | 2026-01-26 |
| JP Morgan | Maintain | Overweight | 2026-01-16 |
| Barclays | Maintain | Equal Weight | 2026-01-07 |
| Wells Fargo | Maintain | Equal Weight | 2026-01-07 |
| UBS | Upgrade | Buy | 2026-01-05 |
| Wells Fargo | Maintain | Equal Weight | 2025-12-15 |
| Oppenheimer | Maintain | Outperform | 2025-11-14 |
Which company has the best grades?
Dover Corporation consistently holds higher ratings, including multiple Overweight and Outperform grades. Emerson Electric Co.’s ratings lean more neutral and equal weight, with some downgrades. Dover’s stronger grades suggest greater institutional confidence, which may affect investor sentiment and stock momentum.
Risks specific to each company
The following categories identify critical pressure points and systemic threats facing Emerson Electric Co. and Dover Corporation in the 2026 market environment:
1. Market & Competition
Emerson Electric Co.
- Faces intense competition in industrial machinery with pressure on margins despite technological innovation.
Dover Corporation
- Competes in diverse industrial segments but risks dilution of focus and slower growth in niche markets.
2. Capital Structure & Debt
Emerson Electric Co.
- Maintains moderate debt-to-equity at 0.68; interest coverage of 13.38 signals manageable leverage.
Dover Corporation
- Displays favorable debt metrics with low leverage and strong interest coverage, indicating prudent capital structure.
3. Stock Volatility
Emerson Electric Co.
- Beta of 1.254 suggests moderate sensitivity to market swings; recent price volatility requires caution.
Dover Corporation
- Slightly higher beta at 1.305 points to greater stock price fluctuations amid market uncertainty.
4. Regulatory & Legal
Emerson Electric Co.
- Exposure to regulatory risks across global industrial sectors, including environmental and safety standards.
Dover Corporation
- Faces regulatory scrutiny in clean energy and industrial automation segments, with compliance costs rising.
5. Supply Chain & Operations
Emerson Electric Co.
- Complex global supply chain vulnerable to disruptions, especially in raw materials and semiconductor components.
Dover Corporation
- Operates diverse supply chains with potential bottlenecks in specialized equipment and clean energy components.
6. ESG & Climate Transition
Emerson Electric Co.
- Increasing pressure to align with climate goals; investments in energy-efficient solutions are critical.
Dover Corporation
- Strong focus on sustainability technologies but faces execution risk in clean energy product scaling.
7. Geopolitical Exposure
Emerson Electric Co.
- Significant international presence exposes it to geopolitical tensions in Asia, Middle East, and Europe.
Dover Corporation
- Global operations carry risks from trade disputes and regional instability, especially in emerging markets.
Which company shows a better risk-adjusted profile?
Emerson Electric’s most impactful risk lies in its tight liquidity ratios and asset turnover inefficiencies, raising operational strain concerns. Dover’s chief risk stems from its absent financial transparency in key ratios, complicating risk assessment. Despite higher stock volatility, Emerson’s stronger Altman Z-Score and Piotroski Score suggest a safer financial position. Dover’s sustainability ambitions face scaling challenges that could pressure margins. Overall, Emerson Electric exhibits a better risk-adjusted profile based on visible financial metrics and operational scale.
Final Verdict: Which stock to choose?
Emerson Electric Co. (EMR) stands out for its operational resilience and consistent cash generation despite a challenging macro environment. Its true superpower lies in solid earnings quality and disciplined capital expenditure, making it a cash machine for patient investors. The key point of vigilance is its declining ROIC, signaling potential value erosion that warrants careful monitoring. EMR suits portfolios focused on steady income and moderate growth.
Dover Corporation (DOV) benefits from a strategic moat rooted in diversified industrial exposure and strong margin control. It offers better safety on debt metrics compared to EMR, reflecting a more conservative financial structure. While growth has been uneven, DOV’s moat provides a cushion against volatility. This stock fits well within GARP (Growth at a Reasonable Price) portfolios seeking balanced risk and return.
If you prioritize operational cash flow and income consistency, Emerson Electric emerges as the compelling choice due to its strong earnings quality and capital discipline. However, if you seek a more conservative profile with a strategic moat and prudent leverage, Dover offers better stability despite its uneven growth. Both stocks face challenges, and investors should weigh their risk appetite carefully.
Disclaimer: Investment carries a risk of loss of initial capital. The past performance is not a reliable indicator of future results. Be sure to understand risks before making an investment decision.
Go Further
I encourage you to read the complete analyses of Emerson Electric Co. and Dover Corporation to enhance your investment decisions: