Home > Comparison > Industrials > ETN vs DOV
The strategic rivalry between Eaton Corporation plc and Dover Corporation shapes the industrial machinery sector’s evolution. Eaton operates as a diversified power management leader with a broad portfolio spanning electrical components, aerospace, and vehicle systems. Dover focuses on engineered products and specialized equipment across clean energy, industrial automation, and refrigeration. This analysis contrasts their operational models to identify which company offers the superior risk-adjusted growth potential for a balanced, diversified portfolio.
Table of contents
Companies Overview
Eaton Corporation plc and Dover Corporation stand as pivotal industrial machinery players shaping global markets.
Eaton Corporation plc: Power Management Leader
Eaton dominates as a power management company with a robust portfolio spanning electrical components, aerospace systems, and vehicle power solutions. Its core revenue derives from diverse segments like Electrical Americas and Aerospace, emphasizing reliability and innovation. In 2026, Eaton sharpens focus on eMobility and integrated power systems to capture the accelerating demand for hybrid and electric vehicle technologies.
Dover Corporation: Engineering Solutions Specialist
Dover excels as an equipment and components provider serving industrial automation, clean energy, and climate control markets. Its revenue engine fuels through multiple segments including Engineered Products and Clean Energy & Fueling, emphasizing aftermarket parts and digital solutions. Dover’s 2026 strategy centers on expanding its footprint in clean energy and precision marking, aligning with sustainability trends and advanced manufacturing.
Strategic Collision: Similarities & Divergences
Both firms operate within industrial machinery but diverge in business philosophy: Eaton pursues a broad integrated power ecosystem, while Dover focuses on specialized engineering segments with digital integration. Their primary battleground lies in electrification and energy efficiency solutions. Eaton’s diversified industrial power profile contrasts with Dover’s targeted niche approach, defining distinct investment risk and growth pathways.
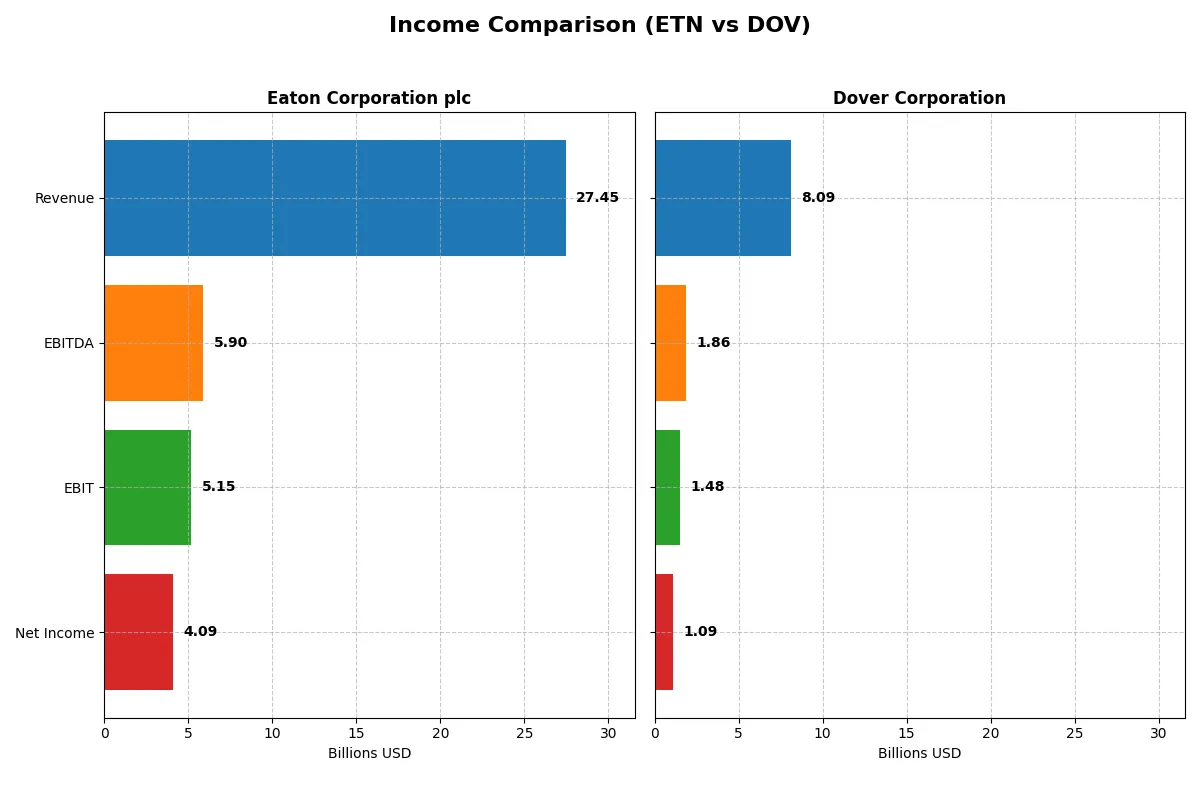
Income Statement Comparison
The following data dissects the core profitability and scalability of both corporate engines to reveal who dominates the bottom line:
| Metric | Eaton Corporation plc (ETN) | Dover Corporation (DOV) |
|---|---|---|
| Revenue | 27.4B | 8.1B |
| Cost of Revenue | 17.1B | 4.9B |
| Operating Expenses | 5.1B | 1.8B |
| Gross Profit | 10.3B | 3.2B |
| EBITDA | 5.9B | 1.9B |
| EBIT | 5.1B | 1.5B |
| Interest Expense | 264M | 110M |
| Net Income | 4.1B | 1.1B |
| EPS | 10.49 | 7.97 |
| Fiscal Year | 2025 | 2025 |
Income Statement Analysis: The Bottom-Line Duel
This income statement comparison reveals which company converts revenue into profit most efficiently and sustains margin strength through market cycles.
Eaton Corporation plc Analysis
Eaton’s revenue climbed steadily from 19.6B in 2021 to 27.4B in 2025, with net income nearly doubling from 2.14B to 4.09B. Gross margin holds firm at 37.6%, while net margin remains healthy near 15%. The 2025 results highlight strong operating leverage and disciplined cost management, driving a 10.3% revenue growth and robust EBITDA expansion.
Dover Corporation Analysis
Dover’s revenue shows modest growth, rising from 7.9B in 2021 to 8.1B in 2025, but net income declined slightly to 1.09B in 2025 from 1.12B in 2021. Gross margin at 39.8% stays solid, yet net margin slipped to 13.5%. The latest year reflects weaker operational momentum, with EBIT down 21.4% and net margin contracting sharply, signaling efficiency and margin pressures.
Consistent Growth vs. Margin Volatility
Eaton outperforms Dover in revenue and net income growth, supported by stable margins and positive earnings momentum. Dover’s flatter top line and shrinking bottom line highlight operational challenges. For investors, Eaton’s profile offers a more consistent growth trajectory and margin resilience, aligning better with prudent long-term capital allocation.
Financial Ratios Comparison
These vital ratios act as a diagnostic tool to expose the underlying fiscal health, valuation premiums, and capital efficiency of the companies compared below:
| Ratios | Eaton Corporation plc (ETN) | Dover Corporation (DOV) |
|---|---|---|
| ROE | 21.1% | 14.8% |
| ROIC | 13.1% | 9.4% |
| P/E | 30.2 | 24.5 |
| P/B | 6.37 | 3.62 |
| Current Ratio | 1.32 | 1.79 |
| Quick Ratio | 0.81 | 1.28 |
| D/E | 0.54 | 0.45 |
| Debt-to-Assets | 25.5% | 24.8% |
| Interest Coverage | 19.8 | 12.5 |
| Asset Turnover | 0.67 | 0.60 |
| Fixed Asset Turnover | 5.40 | 7.23 |
| Payout ratio | 39.5% | 25.9% |
| Dividend yield | 1.31% | 1.06% |
| Fiscal Year | 2025 | 2025 |
Efficiency & Valuation Duel: The Vital Signs
Financial ratios act as a company’s DNA, exposing hidden risks and operational strengths that influence investor confidence and valuation.
Eaton Corporation plc
Eaton delivers strong profitability with a 21.05% ROE and a healthy 14.9% net margin, signaling operational efficiency. However, its P/E of 30.24 suggests a stretched valuation compared to sector norms. The firm balances returns with a 1.31% dividend yield, maintaining shareholder value while investing roughly 3% of revenue in R&D for growth.
Dover Corporation
Dover posts a respectable 14.77% ROE and a 13.52% net margin, indicating solid but less robust profitability than Eaton. Its P/E of 24.49 appears more reasonable, reflecting moderate market expectations. Dover supports shareholders with a 1.06% dividend yield and displays disciplined capital management, focusing on a strong current ratio and manageable debt levels.
Valuation Stretch vs. Operational Balance
Eaton exhibits superior profitability but trades at a premium that pressures valuation metrics. Dover offers a more balanced risk-reward profile with moderate profitability and healthier liquidity. Investors prioritizing growth may lean toward Eaton’s efficiency, while those seeking stability might prefer Dover’s conservative financial footing.
Which one offers the Superior Shareholder Reward?
I compare Eaton Corporation plc (ETN) and Dover Corporation (DOV) on dividends and buybacks. ETN yields 1.3% with a payout ratio near 40%, signaling balanced income and reinvestment. DOV yields slightly less at 1.06% but pays only 26% of earnings, retaining more for growth. Both sustain solid free cash flow coverage. ETN’s dividend is complemented by moderate buybacks, while DOV emphasizes aggressive buybacks enhancing total return. Historically, DOV’s lower payout and stronger buyback intensity suggest more sustainable capital allocation for long-term value. I conclude Dover offers a superior total shareholder reward in 2026, balancing income with growth-driven buybacks.
Comparative Score Analysis: The Strategic Profile
The radar chart reveals the fundamental DNA and trade-offs of Eaton Corporation plc and Dover Corporation, highlighting their financial strengths and valuation nuances:
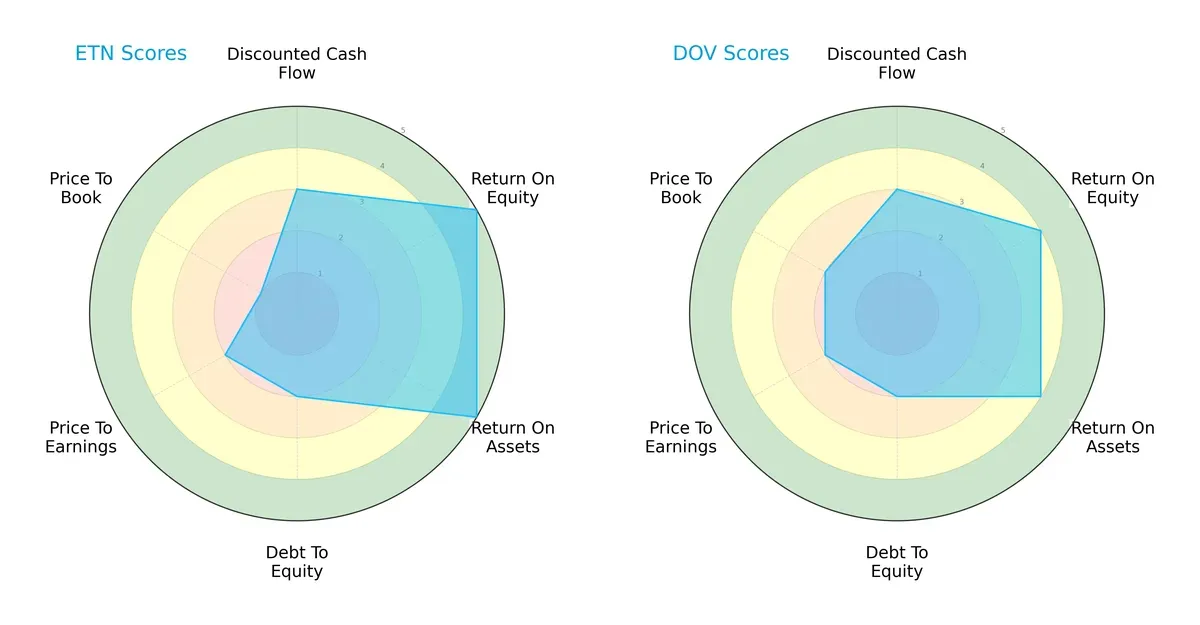
Eaton shows superior operational efficiency with top ROE and ROA scores of 5, compared to Dover’s solid but lower 4s. Both share moderate DCF scores of 3 and face challenges in debt management with similarly unfavorable debt-to-equity scores of 2. Eaton’s valuation metrics lag behind Dover’s, marked by a very unfavorable P/B score of 1 versus Dover’s 2. Eaton’s profile is more concentrated on operational excellence, while Dover maintains a more balanced but less stellar financial footprint.
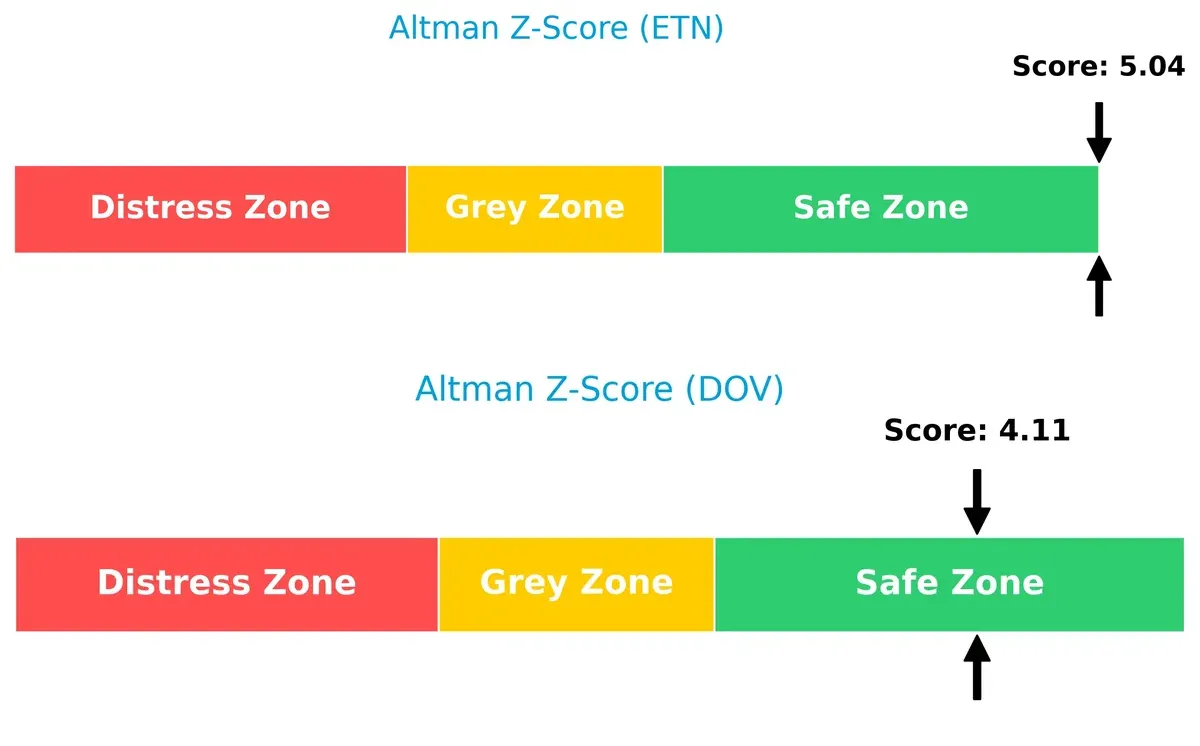
Bankruptcy Risk: Solvency Showdown
Eaton’s Altman Z-Score of 5.04 surpasses Dover’s 4.11, placing both comfortably in the safe zone but with Eaton showing a stronger buffer against financial distress in this cycle:
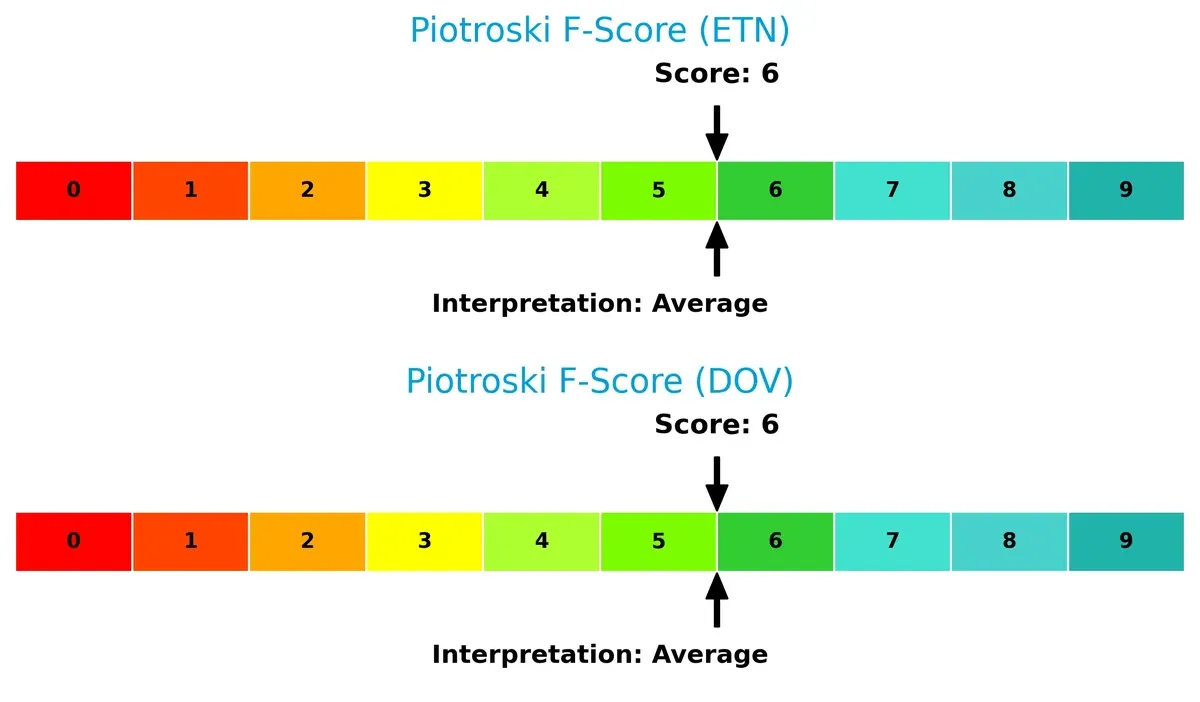
Financial Health: Quality of Operations
Both companies score an identical Piotroski F-Score of 6, indicating average financial health without glaring red flags. Neither firm currently signals internal metric weaknesses that would alarm cautious investors:
How are the two companies positioned?
This section dissects Eaton and Dover’s operational DNA by comparing their revenue distribution and internal dynamics. The goal is to confront their economic moats to identify which model offers the most resilient, sustainable competitive advantage today.
Revenue Segmentation: The Strategic Mix
This visual comparison dissects how Eaton Corporation plc and Dover Corporation diversify their income streams and where their primary sector bets lie:
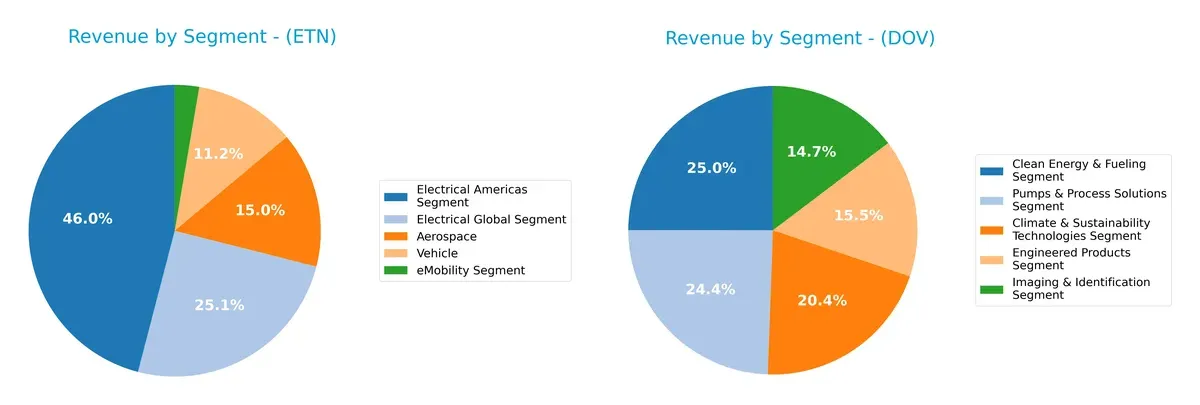
Eaton’s revenue pivots heavily on Electrical Americas at $11.4B and Electrical Global at $6.2B, anchoring its portfolio with infrastructure dominance. Aerospace and Vehicle segments add scale but remain secondary. Dover balances five segments near $1.1B to $1.9B each, showcasing a more diversified revenue base. This diversification reduces concentration risk for Dover but may dilute strategic focus compared to Eaton’s ecosystem lock-in via its electrical businesses.
Strengths and Weaknesses Comparison
This table compares the strengths and weaknesses of Eaton Corporation plc (ETN) and Dover Corporation (DOV):
ETN Strengths
- Strong profitability with 14.9% net margin and 21.05% ROE
- Favorable ROIC at 13.14% exceeding WACC
- Diverse product segments including Aerospace and Electrical Americas
- Significant global presence, especially in the United States and Europe
- Favorable debt-to-assets ratio at 25.53% and high interest coverage at 19.5
DOV Strengths
- Slightly lower net margin at 13.52% but favorable current and quick ratios indicate liquidity
- Favorable debt-to-assets at 24.79% and solid interest coverage at 13.52
- Wide product diversification across Clean Energy, Climate Tech, and Pumps
- Strong geographic diversification including Americas, Asia, and Europe
- High fixed asset turnover of 7.23 demonstrating efficient asset use
ETN Weaknesses
- High valuation multiples with PE of 30.24 and PB of 6.37 raise concerns
- Neutral liquidity ratios (current ratio 1.32, quick ratio 0.81) may limit short-term flexibility
- Asset turnover at 0.67 lags behind fixed asset turnover
- Limited information on innovation leadership
- Geographic exposure heavily weighted in the United States
DOV Weaknesses
- Lower ROE at 14.77% and ROIC at 9.45% suggest moderate capital efficiency
- Unfavorable PB ratio at 3.62 despite other strengths
- Neutral PE ratio at 24.49 reflects valuation risk
- Some reliance on US market with 4.2B revenue, less than ETN’s US exposure
- Neutral asset turnover at 0.6 may constrain growth potential
Both companies show solid diversification and favorable debt management. ETN excels in profitability and return metrics but carries valuation risk and less liquidity. DOV offers stronger liquidity and asset efficiency but has moderate returns and valuation concerns. These factors shape each firm’s strategic options in a competitive industrial sector.
The Moat Duel: Analyzing Competitive Defensibility
A structural moat shields long-term profits from competitive erosion. Without it, gains evaporate quickly in fierce markets:
Eaton Corporation plc: Broad Industrial Cost Advantage
Eaton leverages a robust cost advantage, reflected in a very favorable ROIC exceeding WACC by 4.3%, sustaining 76% ROIC growth. Its diversified power management portfolio supports margin stability and expanding global reach in 2026.
Dover Corporation: Fragmented Niche Innovation
Dover’s moat relies on specialized engineered products but shows a fragile competitive edge. Its ROIC barely surpasses WACC by 0.2%, with declining profitability signaling shrinking value creation amid sector pressures and subdued revenue growth.
Cost Leadership vs. Innovation Fragility
Eaton’s deep and growing moat outmatches Dover’s narrow, weakening competitive position. Eaton’s efficient capital deployment better defends market share against disruption, securing stronger long-term profitability in industrial machinery.
Which stock offers better returns?
The past year reveals strong bullish momentum in both Eaton Corporation plc and Dover Corporation, with accelerating price gains and notable peaks in their trading ranges.
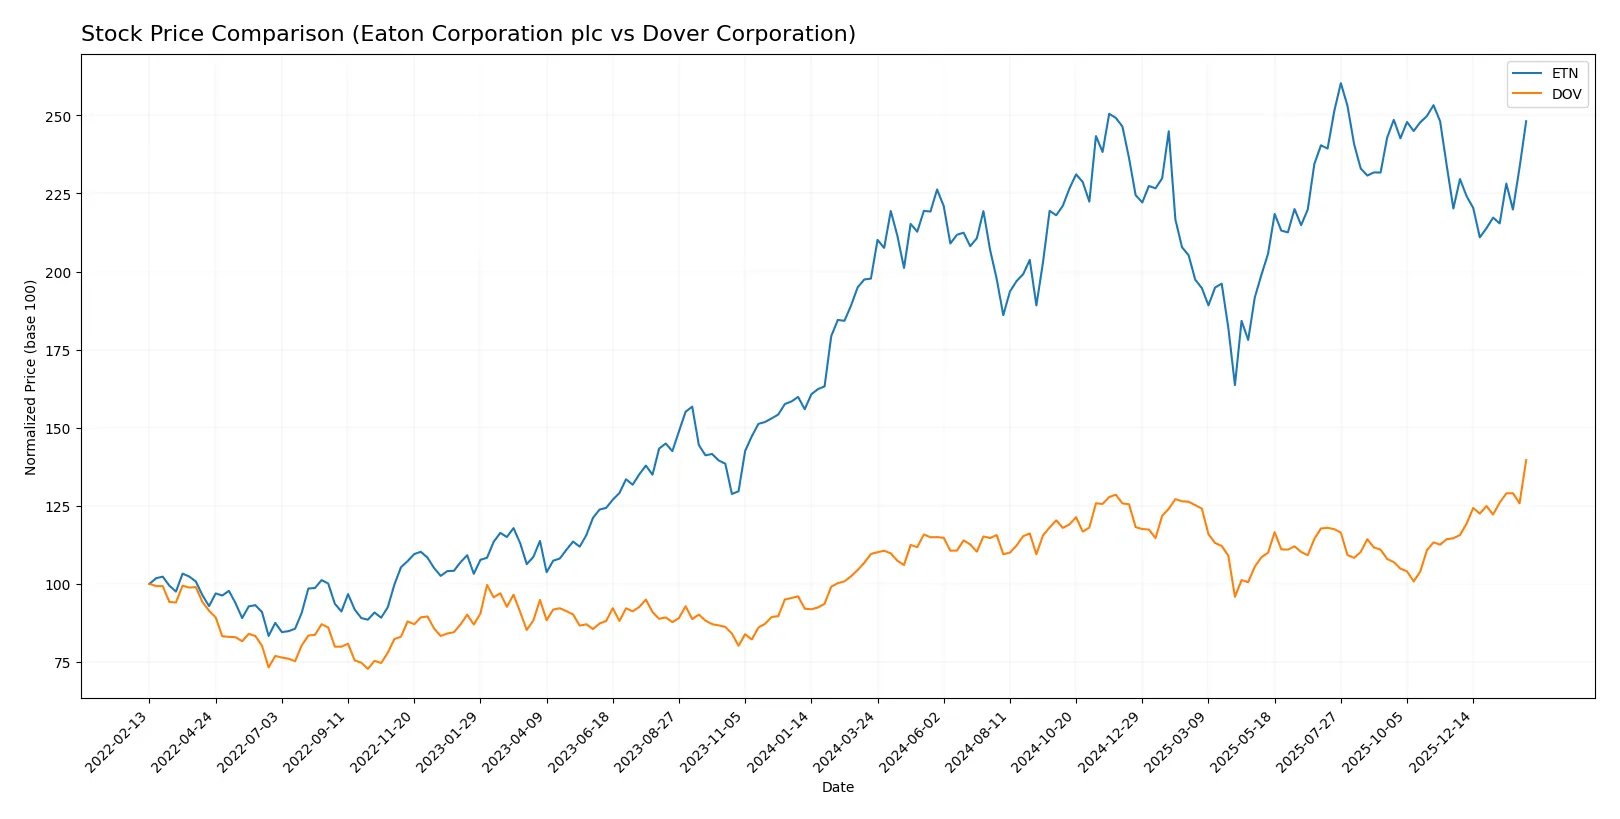
Trend Comparison
Eaton Corporation plc’s stock rose 25.49% over the past year, showing an accelerating bullish trend with high volatility and a peak price of 392.17.
Dover Corporation’s stock gained 27.42% over the same period, also accelerating bullishly but with lower volatility and a high of 223.66.
Dover outperformed Eaton slightly, delivering the highest market return with steadier price appreciation and stronger recent bullish momentum.
Target Prices
Analysts present a clear target price range for both Eaton Corporation plc and Dover Corporation, signaling moderate upside potential.
| Company | Target Low | Target High | Consensus |
|---|---|---|---|
| Eaton Corporation plc | 295 | 495 | 393.64 |
| Dover Corporation | 195 | 256 | 223.7 |
The consensus targets for Eaton and Dover exceed their current prices of $373.82 and $223.66, respectively, suggesting room for appreciation aligned with industrial sector expectations.

Don’t Let Luck Decide Your Entry Point
Optimize your entry points with our advanced ProRealTime indicators. You’ll get efficient buy signals with precise price targets for maximum performance. Start outperforming now!
How do institutions grade them?
Here are the latest institutional grades for Eaton Corporation plc and Dover Corporation:
Eaton Corporation plc Grades
The table below summarizes recent grades from major financial institutions for Eaton Corporation plc.
| Grading Company | Action | New Grade | Date |
|---|---|---|---|
| Wells Fargo | Maintain | Equal Weight | 2026-02-04 |
| JP Morgan | Maintain | Overweight | 2026-01-16 |
| HSBC | Upgrade | Buy | 2026-01-16 |
| Morgan Stanley | Maintain | Overweight | 2026-01-12 |
| Citigroup | Maintain | Buy | 2026-01-12 |
| Barclays | Maintain | Equal Weight | 2026-01-07 |
| UBS | Downgrade | Neutral | 2026-01-05 |
| Wells Fargo | Maintain | Equal Weight | 2025-12-18 |
| Wolfe Research | Upgrade | Outperform | 2025-12-09 |
| JP Morgan | Maintain | Overweight | 2025-11-06 |
Dover Corporation Grades
Below is a summary of recent grades from key financial institutions for Dover Corporation.
| Grading Company | Action | New Grade | Date |
|---|---|---|---|
| JP Morgan | Maintain | Overweight | 2026-01-30 |
| Wells Fargo | Maintain | Equal Weight | 2026-01-30 |
| RBC Capital | Maintain | Sector Perform | 2026-01-30 |
| Oppenheimer | Maintain | Outperform | 2026-01-26 |
| JP Morgan | Maintain | Overweight | 2026-01-16 |
| Wells Fargo | Maintain | Equal Weight | 2026-01-07 |
| Barclays | Maintain | Equal Weight | 2026-01-07 |
| UBS | Upgrade | Buy | 2026-01-05 |
| Wells Fargo | Maintain | Equal Weight | 2025-12-15 |
| Oppenheimer | Maintain | Outperform | 2025-11-14 |
Which company has the best grades?
Both companies receive a mix of “Equal Weight” and “Overweight” or “Buy” ratings. Eaton has more “Buy” upgrades but also a downgrade from UBS. Dover maintains steady “Overweight” and “Outperform” grades with fewer downgrades. Investors may see Eaton as showing recent positive momentum, while Dover offers consistent institutional confidence.
Risks specific to each company
The following categories identify critical pressure points and systemic threats facing Eaton Corporation plc and Dover Corporation in the evolving 2026 market environment:
1. Market & Competition
Eaton Corporation plc
- Operates in power management and aerospace sectors with broad product diversity, facing intense industrial machinery competition.
Dover Corporation
- Offers diverse engineered products and clean energy solutions, competing in niche manufacturing and sustainability markets.
2. Capital Structure & Debt
Eaton Corporation plc
- Debt-to-equity ratio 0.54 signals moderate leverage; interest coverage strong at 19.5x, indicating healthy debt servicing.
Dover Corporation
- Lower debt-to-equity ratio 0.45 with interest coverage at 13.5x shows slightly more conservative capital structure.
3. Stock Volatility
Eaton Corporation plc
- Beta of 1.18 indicates moderate stock volatility, aligned with industrial sector norms.
Dover Corporation
- Beta of 1.29 suggests slightly higher volatility, reflecting sensitivity to market swings and sector cyclicality.
4. Regulatory & Legal
Eaton Corporation plc
- Exposure to global electrical and aerospace regulations; compliance critical for operational continuity.
Dover Corporation
- Faces regulatory scrutiny in clean energy and industrial manufacturing, with rising standards in emissions and safety.
5. Supply Chain & Operations
Eaton Corporation plc
- Global supply chain complexity due to multiple segments increases operational risks and cost pressures.
Dover Corporation
- Supply chain risks mitigated by focused segments but vulnerable to raw material price volatility and logistics disruptions.
6. ESG & Climate Transition
Eaton Corporation plc
- Active in eMobility and power quality, positioning well for climate transition but must manage ESG compliance costs.
Dover Corporation
- Invests in clean energy technologies and sustainability, facing rising capital demands to meet climate goals.
7. Geopolitical Exposure
Eaton Corporation plc
- Global footprint with substantial exposure to European and Asian markets; geopolitical tensions pose supply and demand risks.
Dover Corporation
- Primarily US-based but with international operations, moderately exposed to trade policies and geopolitical shifts.
Which company shows a better risk-adjusted profile?
Eaton’s primary risk lies in its complex global supply chain and valuation premium, while Dover faces greater volatility and ESG transition costs. Eaton’s higher interest coverage and safer Altman Z-score enhance its risk profile. The latter’s stronger liquidity ratios provide a buffer, but its higher beta signals greater market sensitivity. Eaton’s valuation multiples are stretched, raising caution despite operational strength. Overall, Eaton presents a slightly better risk-adjusted profile due to robust debt servicing and diversified market exposure.
Final Verdict: Which stock to choose?
Eaton Corporation (ETN) shines with its ability to consistently create value through a growing and robust return on invested capital. It operates like a well-oiled cash machine, demonstrating operational efficiency and expanding profitability. The point of vigilance is its relatively high valuation multiples, which may temper upside in volatile markets. ETN suits portfolios targeting aggressive growth with a tolerance for premium pricing.
Dover Corporation (DOV) offers a sturdy strategic moat rooted in solid balance sheet health and a reliable free cash flow profile. Its lower leverage and stronger liquidity position it as a safer harbor compared to ETN, albeit with slower growth momentum. DOV fits well in GARP (Growth at a Reasonable Price) portfolios seeking stability with moderate upside potential.
If you prioritize aggressive value creation and expanding profitability, Eaton outshines due to its superior ROIC growth and operational leverage. However, if you seek better stability and a defensive posture in uncertain markets, Dover offers a safer capital structure and steadier cash flows. Each stock aligns with distinct investor risk profiles and growth expectations.
Disclaimer: Investment carries a risk of loss of initial capital. The past performance is not a reliable indicator of future results. Be sure to understand risks before making an investment decision.
Go Further
I encourage you to read the complete analyses of Eaton Corporation plc and Dover Corporation to enhance your investment decisions: