Home > Comparison > Communication Services > DASH vs SNAP
The strategic rivalry between DoorDash, Inc. and Snap Inc. shapes the Communication Services landscape. DoorDash operates a capital-intensive logistics platform connecting merchants and consumers. Snap focuses on high-margin, innovative camera and social media applications. This head-to-head contrasts asset-heavy operational scale versus digital engagement growth. This analysis aims to identify which trajectory offers superior risk-adjusted returns for a diversified portfolio navigating this dynamic sector.

Table of contents
Companies Overview
DoorDash and Snap Inc. define key segments within the digital communication and content landscape.
DoorDash, Inc.: Leading Logistics and Delivery Platform
DoorDash dominates the logistics platform space, connecting merchants, consumers, and delivery drivers across the US and beyond. Its core revenue stems from marketplaces like DoorDash and Wolt, plus membership services such as DashPass. In 2026, the company sharpens its focus on expanding white-label delivery fulfillment and enhancing digital ordering solutions to maintain its competitive edge.
Snap Inc.: Innovative Visual Communication Pioneer
Snap Inc. excels as a camera company, offering Snapchat and related products that enable visual communication through images and short videos. Its revenue engine revolves around advertising products including AR ads and dynamic campaigns. In 2026, Snap prioritizes evolving its ad offerings and immersive experiences to capture user engagement and advertiser spend globally.
Strategic Collision: Similarities & Divergences
Both companies thrive in the communication services sector but diverge sharply in philosophy: DoorDash builds an open logistics ecosystem, while Snap relies on a closed visual communication platform. Their primary battleground lies in capturing consumer attention and monetizing digital engagement. DoorDash presents a logistics-driven growth profile, whereas Snap focuses on innovation in immersive advertising.
Income Statement Comparison
The following data dissects the core profitability and scalability of both corporate engines to reveal who dominates the bottom line:
| Metric | DoorDash (DASH) | Snap (SNAP) |
|---|---|---|
| Revenue | 10.7B | 5.36B |
| Cost of Revenue | 5.54B | 2.47B |
| Operating Expenses | 5.22B | 3.67B |
| Gross Profit | 5.18B | 2.89B |
| EBITDA | 523M | -493M |
| EBIT | -38M | -651M |
| Interest Expense | 0 | 22M |
| Net Income | 123M | -698M |
| EPS | 0.30 | -0.42 |
| Fiscal Year | 2024 | 2024 |
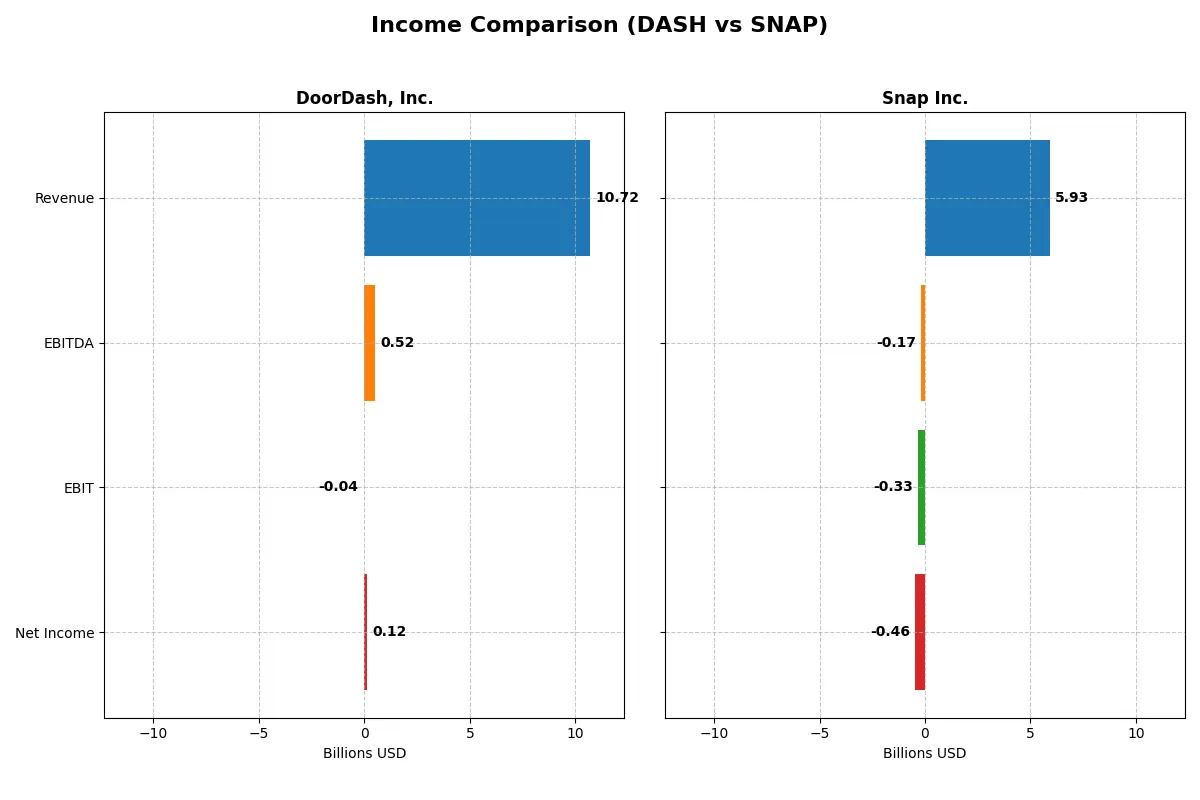
Income Statement Analysis: The Bottom-Line Duel
This income statement comparison reveals which company harnesses its revenue most efficiently to drive profitability and growth momentum.
DoorDash, Inc. Analysis
DoorDash’s revenue surged from 4.9B in 2021 to 10.7B in 2024, more than doubling in three years. Gross margins hold strong at 48.3%, reflecting solid cost control. The company turned profitable in 2024 with a positive net income of 123M, rebounding sharply from multi-year losses. Operating expenses grew proportionally, supporting sustainable expansion and margin improvement.
Snap Inc. Analysis
Snap’s revenue climbed steadily from 4.1B in 2021 to 5.9B in 2025, marking a respectable 44% growth over five years. Gross margins are impressive at 55%, underpinning sound product pricing and cost management. Despite this, Snap remains unprofitable in 2025 with a net loss of 460M, though improved from prior years. Operating expenses grew moderately, signaling disciplined spending but continued challenges in reaching profitability.
Growth Surge vs. Margin Strength
DoorDash leads with rapid revenue acceleration and a rare transition to net profitability, signaling operational leverage payoff. Snap maintains superior gross margins but lags in converting scale into net profits. For investors, DoorDash’s profile appeals more to those prioritizing momentum and margin turn, while Snap suits those valuing stable gross profitability amid ongoing investment.
Financial Ratios Comparison
These vital ratios act as a diagnostic tool to expose the underlying fiscal health, valuation premiums, and capital efficiency of the companies compared below:
| Ratios | DoorDash, Inc. (DASH) | Snap Inc. (SNAP) |
|---|---|---|
| ROE | 1.58% | -20.18% |
| ROIC | -0.34% | -8.20% |
| P/E | 561.3 | -29.98 |
| P/B | 8.85 | 6.05 |
| Current Ratio | 1.66 | 3.56 |
| Quick Ratio | 1.66 | 3.56 |
| D/E (Debt-to-Equity) | 0.069 | 2.06 |
| Debt-to-Assets | 4.17% | 61.23% |
| Interest Coverage | 0 | -5.98 |
| Asset Turnover | 0.83 | 0.77 |
| Fixed Asset Turnover | 9.19 | 5.47 |
| Payout Ratio | 0 | 0 |
| Dividend Yield | 0 | 0 |
| Fiscal Year | 2024 | 2025 |
Efficiency & Valuation Duel: The Vital Signs
Financial ratios serve as a company’s DNA, exposing hidden operational strengths and risks investors must decode carefully.
DoorDash, Inc.
DoorDash posts a modest ROE of 1.58% with slim net margins near 1.15%, signaling weak profitability. The stock trades at an eye-watering P/E of 561, clearly stretched by traditional valuation standards. DoorDash returns no dividends, instead reinvesting heavily in R&D (around 11% of revenue), aiming to fuel future growth despite current financial strain.
Snap Inc.
Snap displays negative profitability metrics, including a ROE of -20.18% and net margin at -7.76%, reflecting persistent losses. The P/E is negative, indicating losses, but the enterprise multiple is lower than DoorDash’s, making Snap appear less expensive. Snap also forgoes dividends, channeling resources aggressively into R&D, nearly 30% of revenue, to drive innovation and user engagement.
Premium Valuation vs. Operational Safety
DoorDash’s sky-high valuation contrasts with Snap’s deeper operational losses and lower multiples. Both bear significant risks, but DoorDash’s reinvestment strategy may appeal to growth-focused investors, while Snap’s profile suits those prioritizing operational overhaul and cost discipline. The choice hinges on appetite for stretched valuations versus turnaround potential.
Which one offers the Superior Shareholder Reward?
DoorDash (DASH) and Snap (SNAP) both forgo dividends, focusing on growth reinvestment. DASH boasts stronger free cash flow per share at 4.38 vs. SNAP’s 0.26, underpinning a more robust buyback capacity. SNAP’s heavy leverage (debt-to-equity 2.06) contrasts with DASH’s conservative 0.07, risking sustainability. I find DASH’s capital allocation more prudent, supporting a sustainable total return in 2026. Thus, DoorDash offers the superior shareholder reward profile today.
Comparative Score Analysis: The Strategic Profile
The radar chart reveals the fundamental DNA and trade-offs of DoorDash, Inc. and Snap Inc., highlighting how each balances profitability, risk, and valuation:
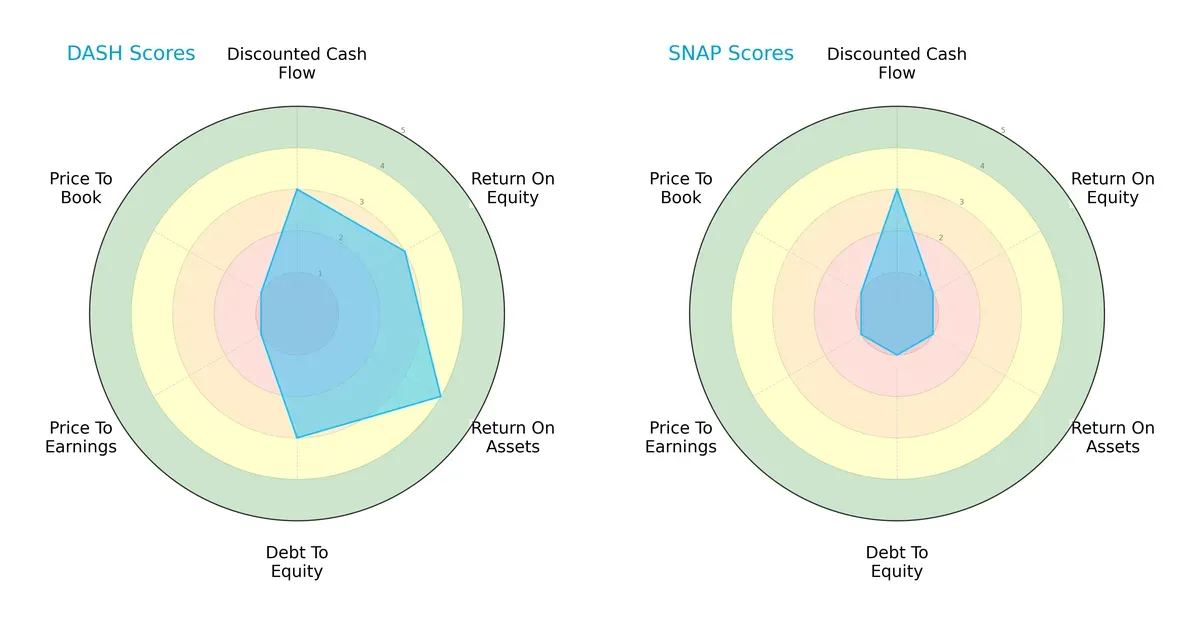
DoorDash delivers a more balanced profile with moderate scores in DCF, ROE, and debt-to-equity, plus a favorable ROA rating. Snap, however, relies heavily on its DCF score but struggles across profitability and leverage metrics. Both companies suffer from very unfavorable valuation scores, reflecting market skepticism or overvaluation risks.
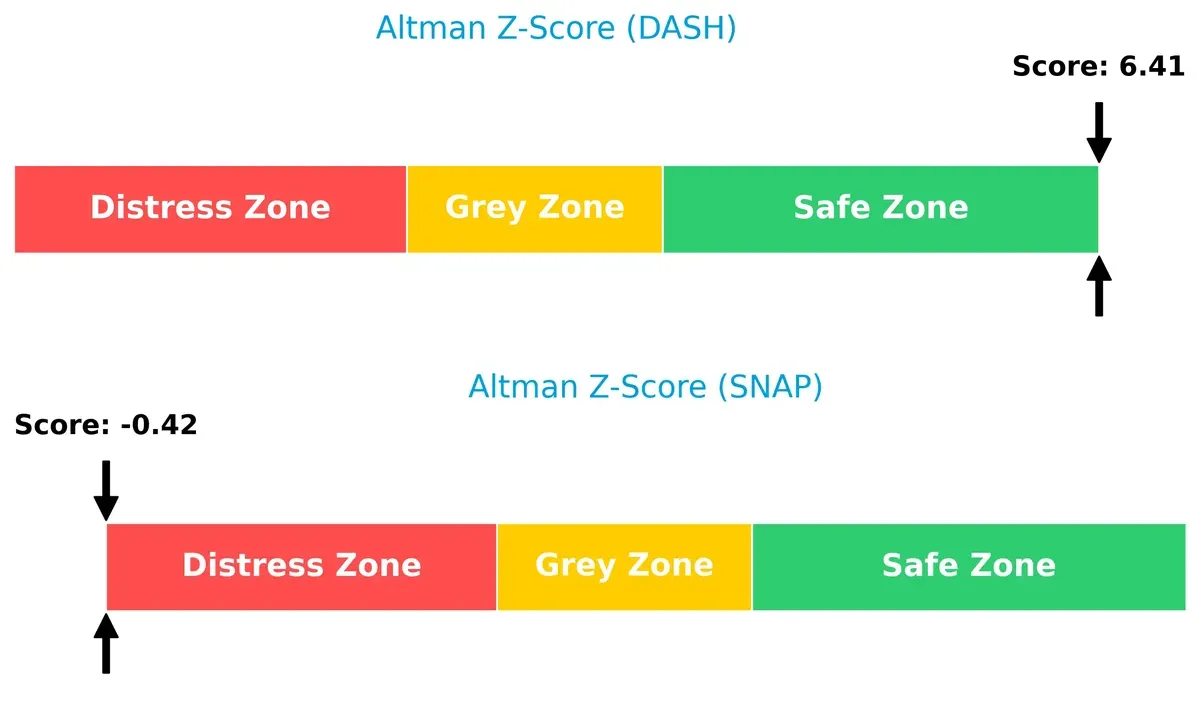
Bankruptcy Risk: Solvency Showdown
DoorDash’s Altman Z-Score at 6.41 places it firmly in the safe zone, signaling strong financial resilience. Snap’s score of -0.42 signals distress, implying a high bankruptcy risk if current trends persist:
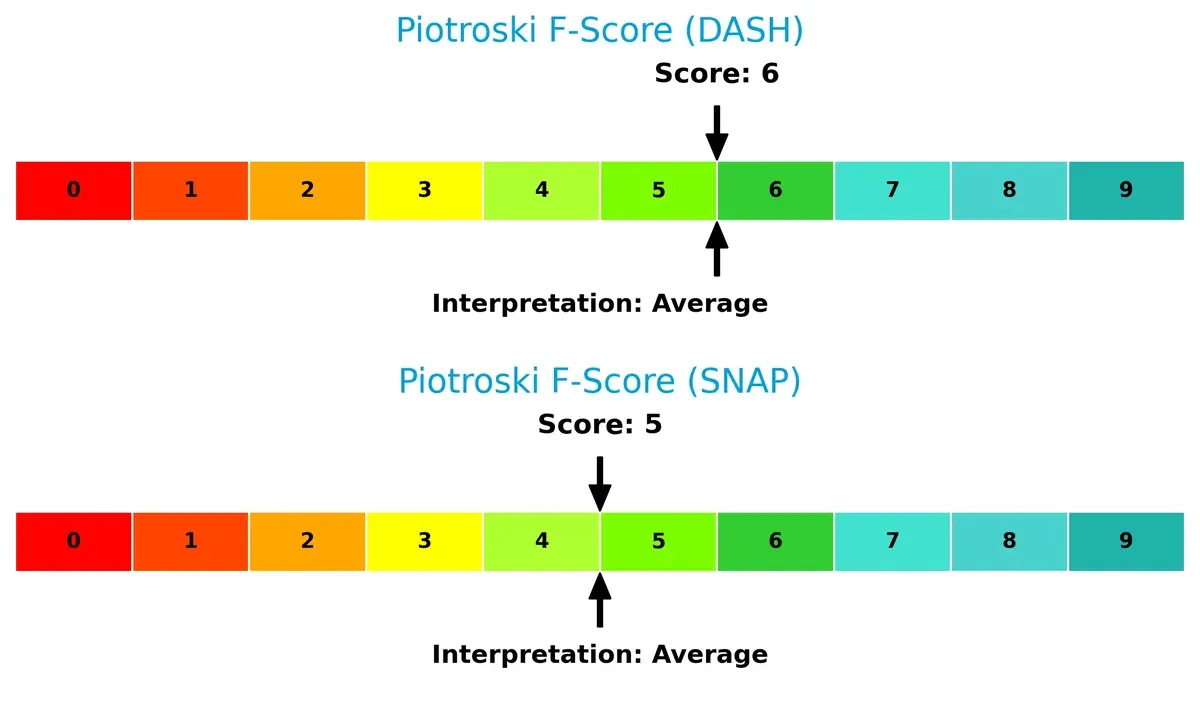
Financial Health: Quality of Operations
Both firms show average Piotroski F-Scores—DoorDash at 6 and Snap at 5—indicating moderate financial health without glaring red flags in operations. DoorDash slightly edges out Snap in operational quality:
How are the two companies positioned?
This section dissects the operational DNA of DoorDash and Snap by comparing their revenue distribution and internal strengths and weaknesses. The goal is to confront their economic moats and identify which model offers the most resilient competitive advantage today.
Revenue Segmentation: The Strategic Mix
This visual comparison dissects how DoorDash and Snap Inc. diversify income streams and highlights their primary sector bets:
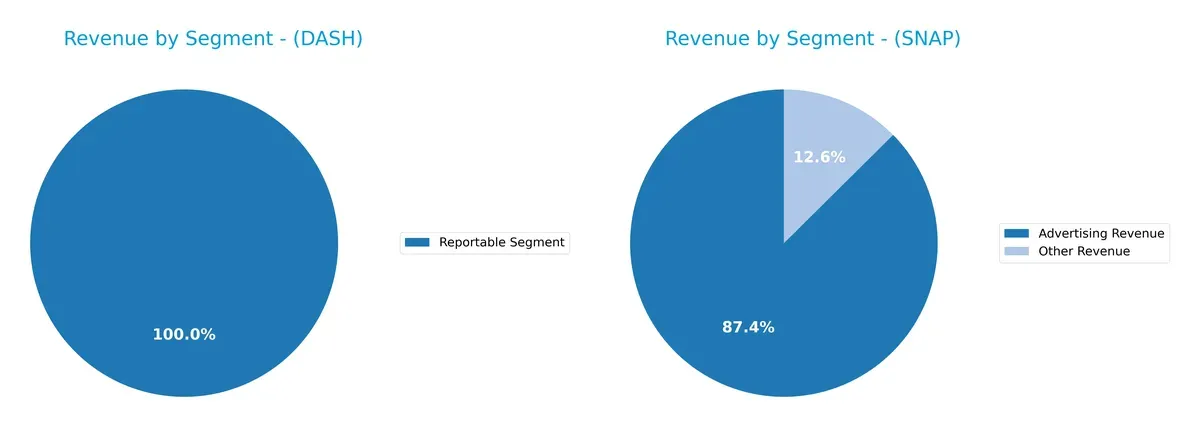
DoorDash’s revenue anchors heavily on Marketplaces and Platform Services, reaching $8.6B in 2023, showing a concentrated focus on its core delivery ecosystem. Snap, by contrast, diversifies with $5.2B in Advertising Revenue and $745M in Other Revenue for 2025. Snap’s mix reduces concentration risk, while DoorDash’s reliance on a single dominant segment suggests strong ecosystem lock-in but exposes it to sector-specific shifts.
Strengths and Weaknesses Comparison
This table compares the strengths and weaknesses of DoorDash and Snap based on diversification, profitability, financials, innovation, global presence, and market share:
DoorDash Strengths
- Strong U.S. market dominance with $9.4B in revenue
- Growing non-U.S. presence at $1.3B
- Low debt levels with 4.17% debt-to-assets
- Favorable liquidity ratios (current and quick ratio 1.66)
- Efficient fixed asset turnover at 9.19
Snap Strengths
- Diversified global revenue with North America $3.5B, Europe $1.1B, Rest of World $1.4B
- Favorable WACC at 6.23% indicating lower capital costs
- Quick ratio favorable at 3.56 showing strong short-term liquidity
- Innovation implied by advertising revenue $5.2B
- Fixed asset turnover favorable at 5.47
DoorDash Weaknesses
- Low profitability with net margin 1.15% and ROE 1.58%
- Negative ROIC at -0.34% below WACC 12.17%
- Extremely high P/E at 561.28 and P/B at 8.85 signal overvaluation
- Zero interest coverage and dividend yield
- Global ratios opinion unfavorable with 57% negative
Snap Weaknesses
- Negative profitability with net margin -7.76%, ROE -20.18%, and ROIC -8.2%
- High debt-to-assets at 61.23% and D/E of 2.06 indicate leverage risk
- Negative interest coverage at -3.7 and unfavorable current ratio 3.56
- P/B at 6.05 unfavorable and overall negative global ratio view
- Negative P/E (-29.98) reflects losses
Both companies face profitability challenges and unfavorable global ratios. DoorDash’s strength lies in its U.S. market control and conservative leverage. Snap benefits from greater geographic diversification and lower capital costs but carries more financial risk due to high debt and losses. Each company’s strategic focus must address these structural financial weaknesses.
The Moat Duel: Analyzing Competitive Defensibility
A structural moat is the only reliable barrier protecting long-term profits from relentless competitive erosion. Here’s how DoorDash and Snap stack up:
DoorDash, Inc.: Logistics Network & Scale Advantage
DoorDash’s moat hinges on its vast logistics network and merchant partnerships. This generates stable gross margins (48%) and rapid revenue growth (24% last year). Expansion into international markets and white-label services could deepen its moat in 2026.
Snap Inc.: Intangible Assets & User Engagement
Snap’s moat derives from its unique camera platform and strong user engagement, fueling higher gross margins (55%) but negative net margins. Its moat is more vulnerable than DoorDash’s, yet innovations in AR ads and new product lines may expand market reach.
Network Scale vs. Intangible Asset Moats
DoorDash’s scale-driven moat offers wider competitive defensibility with superior margin stability and faster growth. Snap’s intangible asset moat is promising but faces profitability headwinds. DoorDash is better positioned to defend its market share in 2026.
Which stock offers better returns?
The past year reveals contrasting trajectories: DoorDash posted a strong overall gain with recent softness, while Snap’s decline accelerated, reflecting divergent investor confidence and trading dynamics.
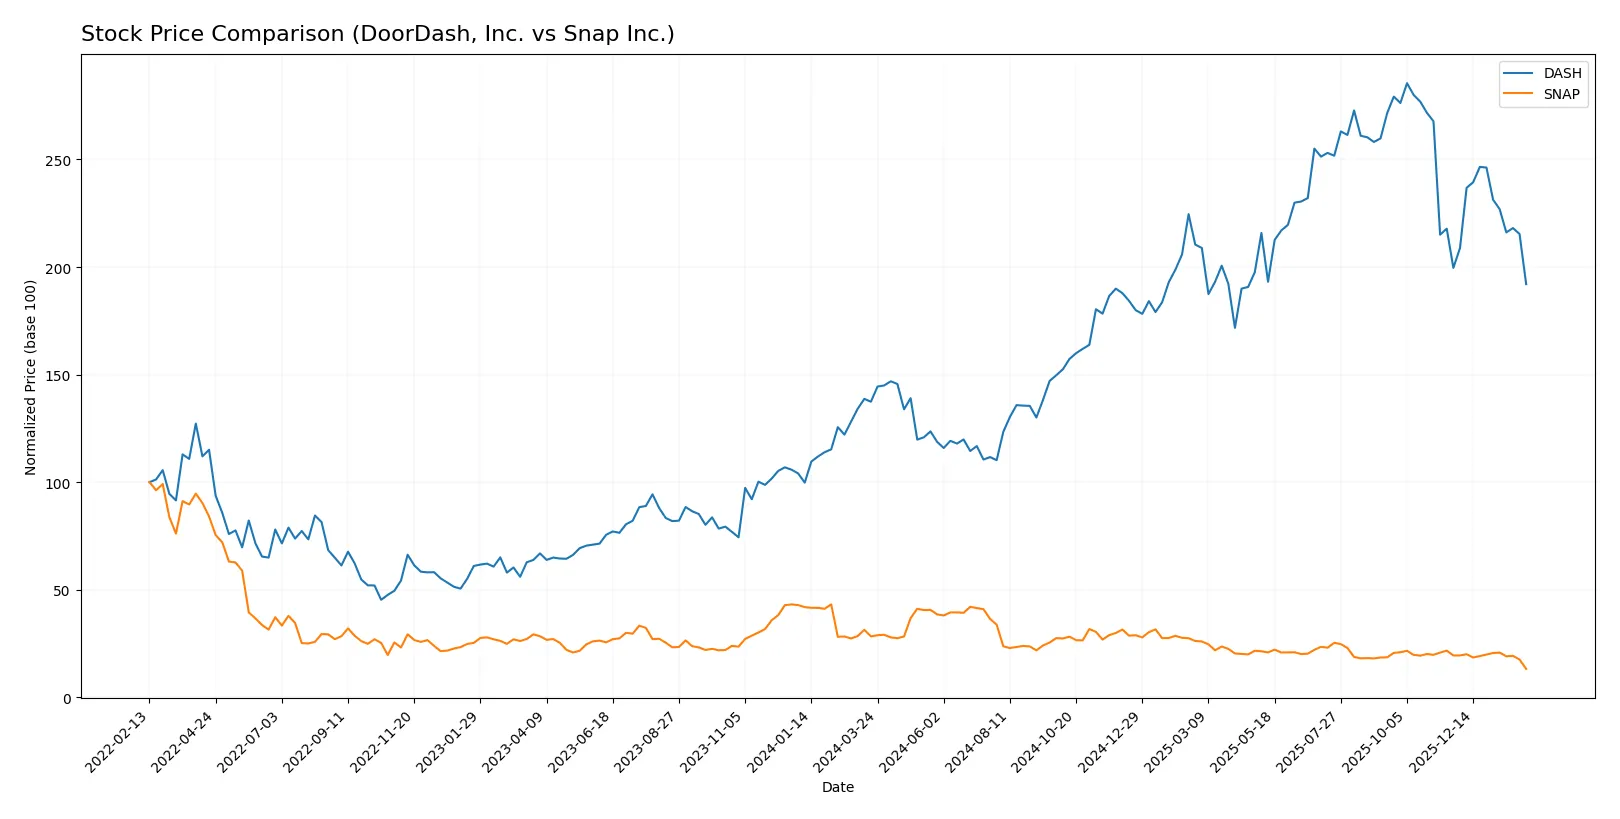
Trend Comparison
DoorDash’s stock rose 39.77% over 12 months, marking a bullish trend with decelerating momentum. Price volatility is high, ranging from $104.74 to $271.22, indicating significant market swings.
Snap’s stock fell 53.35% over the same period, confirming a bearish trend with decelerating losses. Price stability is higher, fluctuating between $5.22 and $16.61, showing less volatility than DoorDash.
DoorDash delivered the strongest market performance, outperforming Snap by a wide margin in price appreciation over the last year.
Target Prices
Analysts present a mixed but generally optimistic target consensus for DoorDash and Snap Inc.
| Company | Target Low | Target High | Consensus |
|---|---|---|---|
| DoorDash, Inc. | 224 | 350 | 281.42 |
| Snap Inc. | 5.5 | 9.5 | 7.69 |
DoorDash’s consensus target of 281.42 implies a significant upside from the current 182.47 price. Snap’s 7.69 consensus also suggests modest appreciation potential above the current 5.22 price.

Don’t Let Luck Decide Your Entry Point
Optimize your entry points with our advanced ProRealTime indicators. You’ll get efficient buy signals with precise price targets for maximum performance. Start outperforming now!
How do institutions grade them?
DoorDash, Inc. Grades
This table lists recent institutional grades for DoorDash, Inc. from major grading firms.
| Grading Company | Action | New Grade | Date |
|---|---|---|---|
| Guggenheim | Maintain | Buy | 2026-01-29 |
| Stifel | Maintain | Hold | 2026-01-27 |
| Keybanc | Maintain | Overweight | 2026-01-20 |
| Wells Fargo | Maintain | Equal Weight | 2026-01-08 |
| Cantor Fitzgerald | Maintain | Overweight | 2026-01-08 |
| Wedbush | Maintain | Outperform | 2025-12-19 |
| Argus Research | Maintain | Buy | 2025-12-12 |
| Jefferies | Maintain | Buy | 2025-12-11 |
| Guggenheim | Maintain | Buy | 2025-11-19 |
| Jefferies | Upgrade | Buy | 2025-11-19 |
Snap Inc. Grades
The following table summarizes recent institutional grades for Snap Inc. from recognized grading firms.
| Grading Company | Action | New Grade | Date |
|---|---|---|---|
| Stifel | Upgrade | Hold | 2026-02-06 |
| B. Riley Securities | Upgrade | Buy | 2026-02-05 |
| Citizens | Maintain | Market Perform | 2026-02-05 |
| Mizuho | Maintain | Neutral | 2026-02-05 |
| Susquehanna | Maintain | Neutral | 2026-02-05 |
| UBS | Maintain | Neutral | 2026-02-05 |
| TD Cowen | Maintain | Hold | 2026-02-05 |
| JP Morgan | Maintain | Underweight | 2026-02-05 |
| Wells Fargo | Maintain | Equal Weight | 2026-02-05 |
| Rosenblatt | Maintain | Neutral | 2026-02-05 |
Which company has the best grades?
DoorDash consistently receives higher grades such as Buy, Overweight, and Outperform. Snap’s ratings range mostly from Neutral to Hold with fewer upgrades. Investors may perceive DoorDash as having stronger institutional support.
Risks specific to each company
The following categories identify the critical pressure points and systemic threats facing both firms in the 2026 market environment:
1. Market & Competition
DoorDash, Inc.
- Faces intense competition in food delivery with pressure on margins and customer acquisition costs.
Snap Inc.
- Operates in a highly competitive social media and AR advertising space with rapid innovation cycles.
2. Capital Structure & Debt
DoorDash, Inc.
- Maintains low debt levels (D/E 0.07), supporting financial stability and flexibility.
Snap Inc.
- Carries high leverage (D/E 2.06), increasing financial risk and interest burden.
3. Stock Volatility
DoorDash, Inc.
- Exhibits high beta (1.795), indicating above-market volatility and sensitivity to economic cycles.
Snap Inc.
- Shows moderate beta (0.796), less volatile but more exposed to idiosyncratic risks.
4. Regulatory & Legal
DoorDash, Inc.
- Faces regulatory scrutiny on gig economy labor laws and data privacy in multiple jurisdictions.
Snap Inc.
- Deals with evolving privacy regulations and content moderation challenges impacting user engagement.
5. Supply Chain & Operations
DoorDash, Inc.
- Relies on complex logistics and merchant partnerships, vulnerable to operational disruptions.
Snap Inc.
- Depends on technology infrastructure and content delivery networks with risks of outages and platform changes.
6. ESG & Climate Transition
DoorDash, Inc.
- Pressure to reduce delivery carbon footprint and improve labor conditions amid rising ESG expectations.
Snap Inc.
- Faces scrutiny over data privacy, user safety, and carbon emissions from data centers.
7. Geopolitical Exposure
DoorDash, Inc.
- Exposure mainly to US and international markets with risks from trade policies and local regulations.
Snap Inc.
- Global user base faces risks from geopolitical tensions affecting digital content accessibility.
Which company shows a better risk-adjusted profile?
DoorDash’s low leverage and strong liquidity position it better to withstand financial shocks. Snap’s high debt, negative profitability, and distress-zone Altman Z-Score raise significant caution. DoorDash’s high market beta signals volatility risk, but its safer capital structure offsets this. Snap’s operational and regulatory risks compound its financial fragility. I am most concerned about Snap’s financial distress amid rising debt costs and regulatory challenges, while DoorDash’s competitive pressure on margins remains a key risk. Overall, DoorDash presents a better risk-adjusted profile in 2026.
Final Verdict: Which stock to choose?
DoorDash shines as a cash-efficient growth engine with accelerating profitability. Its superpower lies in scaling revenue while improving margins, a rare feat in this sector. The key point of vigilance remains its negative ROIC versus WACC, signaling ongoing capital inefficiency. It suits portfolios seeking aggressive growth with a bullish outlook on operational leverage.
Snap’s strategic moat hinges on its entrenched social media platform and potential for recurring ad revenue streams. It offers a safer liquidity profile than DoorDash but wrestles with high leverage and persistent losses. Snap fits well in a GARP portfolio, appealing to investors who value steady innovation and improving free cash flow amidst market headwinds.
If you prioritize rapid growth backed by improving operational metrics, DoorDash is the compelling choice due to its scalable business model and margin expansion. However, if you seek a more defensive growth strategy with stronger liquidity and platform stickiness, Snap offers better stability despite ongoing profitability challenges. Both remain speculative with clear risks, demanding careful risk management.
Disclaimer: Investment carries a risk of loss of initial capital. The past performance is not a reliable indicator of future results. Be sure to understand risks before making an investment decision.
Go Further
I encourage you to read the complete analyses of DoorDash, Inc. and Snap Inc. to enhance your investment decisions: