Workday, Inc. and Domo, Inc. are two prominent players in the software application industry, both offering innovative cloud-based solutions to businesses worldwide. While Workday focuses on enterprise cloud applications for finance and human capital management, Domo specializes in real-time business intelligence platforms. Their overlapping market presence and distinct innovation strategies make this comparison essential. In this article, I will help you identify which company presents the most compelling investment opportunity in 2026.

Table of contents
Companies Overview
I will begin the comparison between Workday and Domo by providing an overview of these two companies and their main differences.
Workday Overview
Workday, Inc. provides enterprise cloud applications globally, focusing on financial management, human capital management, planning, and analytics. The company’s solutions help organizations streamline financial processes, manage the employee lifecycle, and leverage machine learning for operational insights. Founded in 2005 and headquartered in Pleasanton, California, Workday serves diverse sectors including healthcare, education, and technology.
Domo Overview
Domo, Inc. operates a cloud-based business intelligence platform designed to connect executives and employees with real-time data and insights across organizations. The platform supports business management via smartphones and integrates data from various systems. Founded in 2010 and based in American Fork, Utah, Domo primarily targets customers in the United States and Japan with its software applications.
Key similarities and differences
Both companies operate in the software application industry and offer cloud-based solutions that emphasize data accessibility and business process optimization. Workday focuses broadly on enterprise resource planning with modules for finance and HR, while Domo specializes in business intelligence and data visualization. Workday is significantly larger, with over 20K employees and a market cap of nearly 50B, compared to Domo’s 888 employees and 257M market cap.
Income Statement Comparison
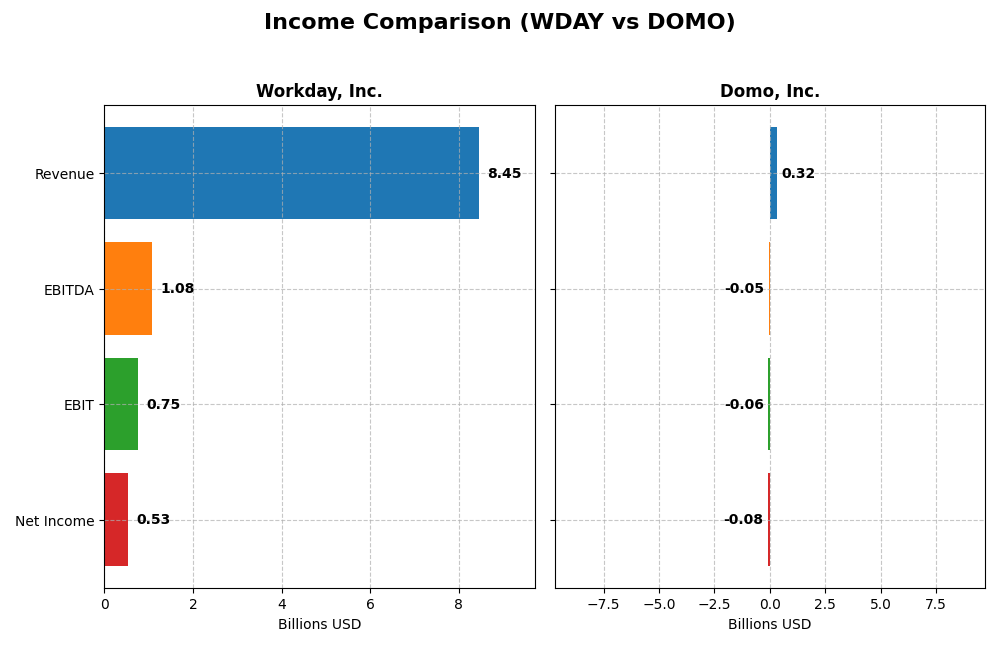
The table below presents a clear comparison of key income statement metrics for Workday, Inc. and Domo, Inc. for the fiscal year 2025, allowing investors to assess their financial performance side by side.
| Metric | Workday, Inc. (WDAY) | Domo, Inc. (DOMO) |
|---|---|---|
| Market Cap | 49.9B | 257M |
| Revenue | 8.45B | 317M |
| EBITDA | 1.08B | -50M |
| EBIT | 752M | -59M |
| Net Income | 526M | -82M |
| EPS | 1.98 | -2.13 |
| Fiscal Year | 2025 | 2025 |
Income Statement Interpretations
Workday, Inc.
Workday’s revenue grew significantly from 4.32B in 2021 to 8.45B in 2025, nearly doubling over five years. Net income recovered from losses in 2021 to 526M in 2025, reflecting strong profitability improvements. Gross margin remained high at 75.5%, while net margin at 6.23% was favorable. The latest year saw strong revenue and EBIT growth but a net margin decline.
Domo, Inc.
Domo’s revenue increased moderately from 210M in 2021 to 317M in 2025, with a slight decline in the most recent year. Net losses persisted, with -82M in 2025, despite a modest net income growth overall. Gross margin was favorable at 74.45%, but EBIT margin and net margin were negative and unfavorable. Recent performance showed declining revenue and worsening profitability metrics.
Which one has the stronger fundamentals?
Workday demonstrates stronger fundamentals with robust revenue and net income growth, favorable margins, and improving profitability despite a recent net margin dip. Domo faces ongoing losses, negative EBIT and net margins, and a recent decline in revenue and profitability. Workday’s overall financial health appears more solid based on these income statement trends.
Financial Ratios Comparison
The table below compares key financial ratios for Workday, Inc. and Domo, Inc. based on their latest fiscal year data from 2025.
| Ratios | Workday, Inc. (WDAY) | Domo, Inc. (DOMO) |
|---|---|---|
| ROE | 5.82% | 46.23% |
| ROIC | 2.73% | 194.73% |
| P/E | 132.15 | -3.98 |
| P/B | 7.69 | -1.84 |
| Current Ratio | 1.85 | 0.56 |
| Quick Ratio | 1.85 | 0.56 |
| D/E (Debt-to-Equity) | 0.37 | -0.76 |
| Debt-to-Assets | 18.70% | 63.23% |
| Interest Coverage | 3.64 | -2.99 |
| Asset Turnover | 0.47 | 1.48 |
| Fixed Asset Turnover | 5.36 | 8.17 |
| Payout Ratio | 0 | 0 |
| Dividend Yield | 0 | 0 |
Interpretation of the Ratios
Workday, Inc.
Workday exhibits a balanced ratio profile with favorable liquidity ratios (current and quick ratios at 1.85) and solid debt management (debt-to-equity 0.37, debt-to-assets 18.7%). However, profitability metrics such as ROE (5.82%) and ROIC (2.73%) are marked unfavorable, alongside a high PE ratio of 132.15. The company does not pay dividends, reflecting a focus on reinvestment and growth rather than shareholder payouts.
Domo, Inc.
Domo presents a mixed ratio picture with strong profitability indicators like ROE (46.23%) and ROIC (194.73%), but weak liquidity (current ratio 0.56) and solvency concerns, evidenced by a high debt-to-assets ratio (63.23%) and negative interest coverage (-2.99). The negative net margin (-25.84%) suggests operational losses. Domo also does not pay dividends, likely prioritizing growth and R&D investments.
Which one has the best ratios?
Both companies show a neutral overall ratio evaluation, with Workday demonstrating stronger liquidity and debt metrics but weaker profitability, while Domo boasts impressive profitability ratios yet struggles with liquidity and debt management. Neither stands out conclusively, as each has an equal proportion of favorable and unfavorable ratios, balancing the risk and strengths differently.
Strategic Positioning
This section compares the strategic positioning of Workday, Inc. and Domo, Inc. regarding market position, key segments, and exposure to technological disruption:
Workday, Inc.
- Large market cap of 49.9B, faces competitive pressure in enterprise cloud software.
- Key segments include subscription services (7.7B) and professional services (728M).
- Exposure includes advanced analytics, machine learning, and cloud spend management.
Domo, Inc.
- Smaller market cap of 257M, operates in the cloud-based BI platform niche.
- Key segments are subscription (286M) and professional services (31M).
- Focused on real-time data access and mobile business management.
Workday, Inc. vs Domo, Inc. Positioning
Workday pursues a diversified approach with large-scale enterprise cloud applications spanning finance, HR, and analytics. Domo concentrates on cloud-based business intelligence connecting users to real-time data. Workday’s scale offers broad industry reach; Domo’s niche focus allows agility but limits scale.
Which has the best competitive advantage?
Domo demonstrates a very favorable MOAT with ROIC well above WACC and growing profitability, indicating a strong competitive advantage. Workday shows a slightly unfavorable MOAT, shedding value despite improving ROIC trends, suggesting weaker competitive positioning.
Stock Comparison
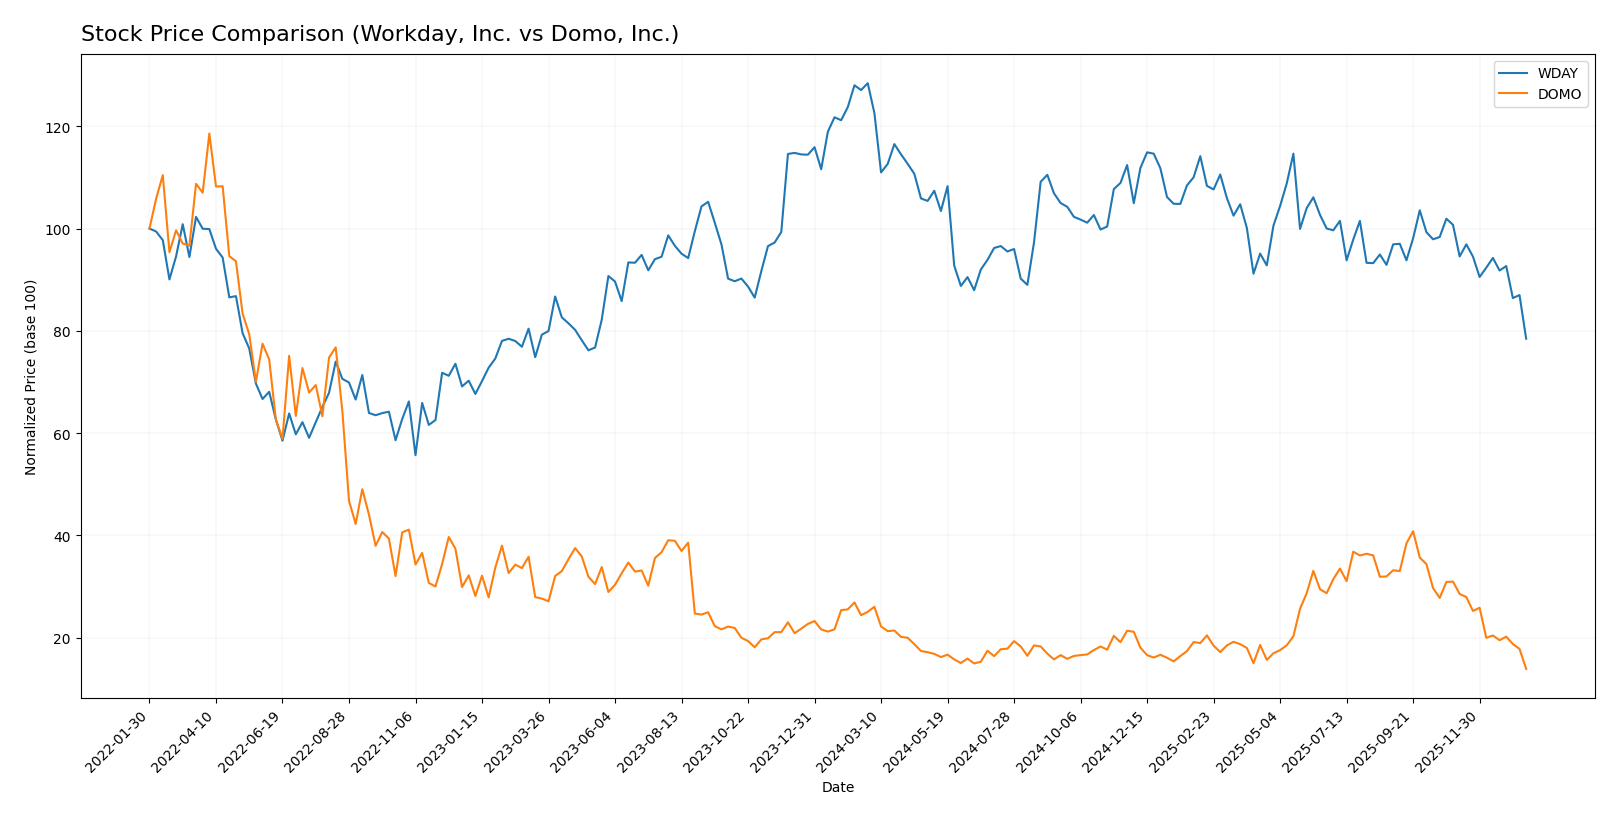
The stock price chart highlights a pronounced bearish trend for both Workday, Inc. (WDAY) and Domo, Inc. (DOMO) over the past 12 months, with significant price declines and decelerating downward momentum.
Trend Analysis
Workday, Inc. experienced a bearish trend over the past 12 months with a price decline of -38.91%. The trend shows deceleration and high volatility with a standard deviation of 20.22, reaching a high of 305.88 and a low of 186.86.
Domo, Inc. also recorded a bearish trend over the same period, with a larger price drop of -44.54%. The decline decelerated, exhibiting low volatility (std deviation 3.01), with a highest price of 18.06 and a lowest of 6.15.
Comparing both, Workday’s stock outperformed Domo’s, delivering a smaller negative return over the year despite both showing bearish, decelerating trends.
Target Prices
Analysts present a clear target consensus for both Workday, Inc. and Domo, Inc.
| Company | Target High | Target Low | Consensus |
|---|---|---|---|
| Workday, Inc. | 320 | 235 | 274.47 |
| Domo, Inc. | 13 | 10 | 11.5 |
The target consensus for Workday, Inc. at $274.47 significantly exceeds its current price of $186.86, suggesting potential upside. Similarly, Domo, Inc.’s consensus target of $11.5 doubles the current price of $6.15, indicating positive expectations from analysts.
Analyst Opinions Comparison
This section compares analysts’ ratings and grades for Workday, Inc. and Domo, Inc.:
Rating Comparison
Workday, Inc. Rating
- Rating: B-, evaluated as Very Favorable overall
- Discounted Cash Flow Score: 4, rated Favorable
- ROE Score: 3, rated Moderate
- ROA Score: 3, rated Moderate
- Debt To Equity Score: 2, rated Moderate
- Overall Score: 2, rated Moderate
Domo, Inc. Rating
- Rating: C, also evaluated as Very Favorable overall
- Discounted Cash Flow Score: 1, rated Very Unfavorable
- ROE Score: 5, rated Very Favorable
- ROA Score: 1, rated Very Unfavorable
- Debt To Equity Score: 1, rated Very Unfavorable
- Overall Score: 2, rated Moderate
Which one is the best rated?
Based strictly on the provided data, Workday, Inc. holds a better rating (B-) and more favorable scores in discounted cash flow and debt-to-equity metrics. Domo, Inc. excels in return on equity but scores lower in other key areas. Overall, Workday’s ratings appear more balanced.
Scores Comparison
The financial scores of Workday, Inc. and Domo, Inc. are compared below:
WDAY Scores
- Altman Z-Score: 4.41, indicating a safe zone for bankruptcy risk.
- Piotroski Score: 6, classified as average financial strength.
DOMO Scores
- Altman Z-Score: -10.10, signaling distress zone and high bankruptcy risk.
- Piotroski Score: 3, reflecting very weak financial strength.
Which company has the best scores?
Based on the provided data, Workday, Inc. has stronger financial scores with a safe Altman Z-Score and average Piotroski Score, compared to Domo, Inc.’s distress zone Z-Score and very weak Piotroski Score.
Grades Comparison
Here is a comparison of the latest available grades and ratings for Workday, Inc. and Domo, Inc.:
Workday, Inc. Grades
The table below summarizes recent grades from major financial institutions for Workday, Inc.:
| Grading Company | Action | New Grade | Date |
|---|---|---|---|
| Barclays | Maintain | Overweight | 2026-01-12 |
| RBC Capital | Maintain | Outperform | 2026-01-05 |
| TD Cowen | Maintain | Buy | 2025-11-26 |
| DA Davidson | Maintain | Neutral | 2025-11-26 |
| Wells Fargo | Maintain | Overweight | 2025-11-26 |
| Barclays | Maintain | Overweight | 2025-11-26 |
| Keybanc | Maintain | Overweight | 2025-11-26 |
| Citigroup | Maintain | Neutral | 2025-11-26 |
| JP Morgan | Maintain | Overweight | 2025-11-26 |
| UBS | Maintain | Neutral | 2025-11-26 |
Workday’s grades predominantly reflect positive sentiment, with a strong bias towards “Overweight” and “Buy” ratings from leading banks, indicating confidence in the stock’s potential.
Domo, Inc. Grades
The following table presents recent grades for Domo, Inc. from recognized grading companies:
| Grading Company | Action | New Grade | Date |
|---|---|---|---|
| DA Davidson | Maintain | Neutral | 2025-12-05 |
| TD Cowen | Maintain | Buy | 2025-12-05 |
| Lake Street | Maintain | Hold | 2025-12-05 |
| DA Davidson | Maintain | Neutral | 2025-12-01 |
| JMP Securities | Maintain | Market Outperform | 2025-09-10 |
| DA Davidson | Maintain | Neutral | 2025-08-28 |
| Cantor Fitzgerald | Maintain | Overweight | 2025-08-28 |
| TD Cowen | Upgrade | Buy | 2025-08-26 |
| JMP Securities | Maintain | Market Outperform | 2025-06-25 |
| Cantor Fitzgerald | Maintain | Overweight | 2025-06-25 |
Domo’s grades show a mix of “Neutral,” “Hold,” and “Buy” ratings with some “Market Outperform” designations, reflecting a more cautious but generally positive outlook.
Which company has the best grades?
Workday, Inc. has received consistently stronger grades with multiple “Overweight” and “Buy” ratings from top-tier firms, whereas Domo, Inc. shows more mixed ratings including “Neutral” and “Hold.” This suggests Workday benefits from higher analyst confidence, potentially impacting investor sentiment and portfolio positioning differently.
Strengths and Weaknesses
Below is a comparison table highlighting the key strengths and weaknesses of Workday, Inc. (WDAY) and Domo, Inc. (DOMO) based on recent data from 2025.
| Criterion | Workday, Inc. (WDAY) | Domo, Inc. (DOMO) |
|---|---|---|
| Diversification | Strong focus on subscription services with growing professional services segment; revenue diversification within cloud solutions. | Limited diversification; mainly subscription and small professional services segment. |
| Profitability | Moderate net margin (6.23%) but unfavorable ROIC (2.73%) and ROE (5.82%), indicating some profitability challenges. | Negative net margin (-25.84%) but very high ROIC (194.73%) and ROE (46.23%), showing mixed signals with strong capital returns but operational losses. |
| Innovation | Consistent revenue growth in subscription services signals ongoing innovation and customer retention. | High ROIC growth suggests innovation effectiveness, but operational losses hint at scaling challenges. |
| Global presence | Established global footprint with strong recurring revenue base. | Smaller scale global presence, reflected by lower revenue and liquidity ratios. |
| Market Share | Larger market share in enterprise cloud applications with $7.7B subscription revenue. | Smaller market share with $286M subscription revenue, focusing on niche data analytics. |
Key takeaways: Workday shows steady growth and diversification with moderate profitability but faces efficiency challenges. Domo demonstrates exceptional capital efficiency and innovation potential but struggles with profitability and liquidity, indicating higher risk. Investors should weigh growth prospects against financial stability carefully.
Risk Analysis
Below is a comparison of key risks for Workday, Inc. (WDAY) and Domo, Inc. (DOMO) based on the most recent data from 2025.
| Metric | Workday, Inc. (WDAY) | Domo, Inc. (DOMO) |
|---|---|---|
| Market Risk | Beta 1.14 (moderate volatility) | Beta 1.65 (high volatility) |
| Debt level | Debt/Equity 0.37 (low risk) | Debt/Equity -0.76 (complex, high leverage) |
| Regulatory Risk | Moderate, US tech sector exposure | Moderate, US and international exposure |
| Operational Risk | Moderate, large scale operations | Higher, smaller scale and financial distress |
| Environmental Risk | Low, typical for software sector | Low, typical for software sector |
| Geopolitical Risk | Moderate, global client base | Moderate, global client base |
The most impactful risk is Domo’s financial distress, reflected in its Altman Z-Score in the distress zone and weak Piotroski score, indicating a higher bankruptcy risk. Workday’s risks center on market volatility and valuation concerns but maintain stronger financial stability with a safe Altman Z-Score and moderate Piotroski score.
Which Stock to Choose?
Workday, Inc. has shown favorable income growth with a 16.35% revenue increase in the last year and a strong 286% net income rise over five years. Its financial ratios are mixed: 43% favorable, 43% unfavorable, and a neutral overall stance. Profitability is moderate, with a 6.23% net margin and a slightly unfavorable return on invested capital, indicating some value destruction despite growing ROIC. Its debt profile is solid, supported by a strong current ratio and interest coverage. The company holds a very favorable overall rating of B-.
Domo, Inc. presents an unfavorable income trend with a slight revenue decline last year and a modest 3.2% net income growth over five years. Its financial ratios are evenly split between favorable and unfavorable, with a neutral global opinion. Profitability metrics are weak, including a negative 25.84% net margin but supported by a very favorable ROE and ROIC, signaling efficient capital use and value creation. The company faces liquidity challenges, reflected in a low current ratio and unfavorable debt ratios. Its overall rating is very favorable at C, despite mixed score components.
For investors prioritizing stable income growth and balanced financial health, Workday might appear more favorable due to its strong income statement and prudent debt management. Conversely, those with a tolerance for higher risk and interest in companies showing strong capital efficiency and potential value creation may find Domo’s profile more appealing. The differing ratings and financial characteristics suggest that the preferred stock could depend significantly on the investor’s risk appetite and investment strategy.
Disclaimer: Investment carries a risk of loss of initial capital. The past performance is not a reliable indicator of future results. Be sure to understand risks before making an investment decision.
Go Further
I encourage you to read the complete analyses of Workday, Inc. and Domo, Inc. to enhance your investment decisions: