Unity Software Inc. and Domo, Inc. are two prominent players in the software application industry, each innovating in distinct yet overlapping markets. Unity specializes in real-time 3D content creation across multiple platforms, while Domo focuses on cloud-based business intelligence and data connectivity. Comparing these companies highlights contrasting growth strategies and market potentials. In this article, I will help you determine which company offers the most compelling investment opportunity for your portfolio.
Table of contents
Companies Overview
I will begin the comparison between Unity Software Inc. and Domo, Inc. by providing an overview of these two companies and their main differences.
Unity Software Inc. Overview
Unity Software Inc. develops and operates an interactive real-time 3D content platform, enabling the creation, running, and monetization of 2D and 3D content across various devices including mobile phones, PCs, consoles, and AR/VR hardware. Founded in 2004 and headquartered in San Francisco, Unity serves a broad range of creators such as developers, artists, and engineers, with a global presence across multiple continents.
Domo, Inc. Overview
Domo, Inc. offers a cloud-based business intelligence platform that connects all organizational levels with real-time data and insights, enabling business management via smartphones. Founded in 2010 and based in American Fork, Utah, Domo operates internationally, focusing on integrating people, data, and systems to enhance decision-making processes within enterprises through its software solutions.
Key similarities and differences
Both Unity and Domo operate in the Software – Application industry, providing technology platforms that enhance user interaction with data and content. Unity specializes in 3D content creation and monetization across diverse devices, targeting creative professionals, while Domo focuses on business intelligence and data management, targeting organizational decision-makers. Additionally, Unity is substantially larger with a market cap of 17.5B and nearly 5,000 employees, compared to Domo’s 257M market cap and 888 employees.
Income Statement Comparison
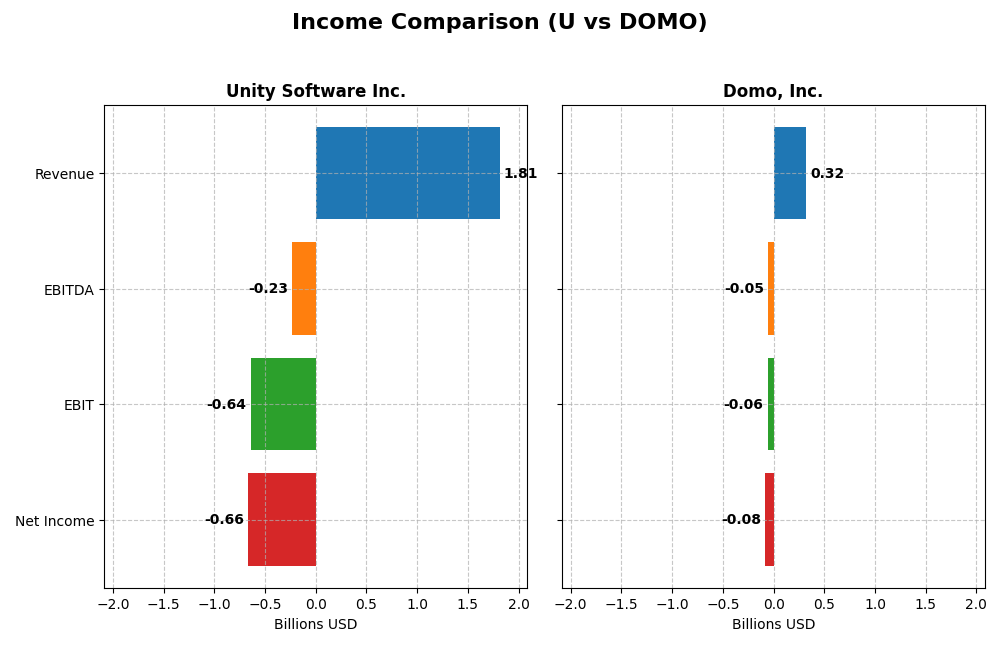
This table presents a side-by-side comparison of the latest fiscal year income statement metrics for Unity Software Inc. and Domo, Inc., offering a clear view of their financial performance.
| Metric | Unity Software Inc. | Domo, Inc. |
|---|---|---|
| Market Cap | 17.5B | 257M |
| Revenue | 1.81B | 318M |
| EBITDA | -235M | -50M |
| EBIT | -644M | -59M |
| Net Income | -664M | -82M |
| EPS | -1.68 | -2.13 |
| Fiscal Year | 2024 | 2025 |
Income Statement Interpretations
Unity Software Inc.
Unity Software’s revenue grew significantly by 135% from 2020 to 2024 but declined 17.1% in the last year, with net income consistently negative and worsening overall by 135%. Gross margins remained strong at 73.5%, yet EBIT and net margins stayed unfavorable, reflecting ongoing operational losses. The 2024 performance showed some EBIT improvement, while net margins remained stable.
Domo, Inc.
Domo’s revenue increased 51% over 2021-2025 but slightly dropped 0.6% in the last year. Gross margin remained favorable at 74.5%, with net margin consistently negative but improving overall by 36%. EBIT margin stayed unfavorable but less severe than Unity’s. The recent year saw declines in EBIT and EPS, indicating margin pressures despite stable revenue.
Which one has the stronger fundamentals?
Both companies exhibit unfavorable overall income statements with persistent net losses and negative EBIT margins. Unity shows stronger revenue growth but larger net losses and margin deterioration, while Domo’s revenue growth is more modest with signs of margin improvement. Neither demonstrates robust profitability, but Domo’s more stable margins and improving net margin growth suggest relatively stronger fundamentals.
Financial Ratios Comparison
The table below compares the most recent financial ratios of Unity Software Inc. and Domo, Inc., providing a snapshot of their profitability, liquidity, leverage, efficiency, and dividend metrics as of fiscal year-end 2024 for Unity and fiscal year-end January 2025 for Domo.
| Ratios | Unity Software Inc. (2024) | Domo, Inc. (2025) |
|---|---|---|
| ROE | -20.8% | 46.2% |
| ROIC | -12.8% | 194.7% |
| P/E | -13.4 | -4.0 |
| P/B | 2.79 | -1.84 |
| Current Ratio | 2.50 | 0.56 |
| Quick Ratio | 2.50 | 0.56 |
| D/E | 0.74 | -0.76 |
| Debt-to-Assets | 34.9% | 63.2% |
| Interest Coverage | -32.1 | -3.0 |
| Asset Turnover | 0.27 | 1.48 |
| Fixed Asset Turnover | 18.3 | 8.17 |
| Payout ratio | 0% | 0% |
| Dividend yield | 0% | 0% |
Interpretation of the Ratios
Unity Software Inc.
Unity Software shows a mixed financial profile with several unfavorable profitability ratios, including a net margin of -36.63% and a return on equity of -20.81%, signaling operational challenges. However, liquidity is strong with a current ratio of 2.5, and leverage metrics remain neutral. The company does not pay dividends, likely prioritizing reinvestment in its high R&D expenditures and growth initiatives.
Domo, Inc.
Domo presents a more favorable profitability outlook with a return on equity of 46.23% and an impressive return on invested capital of 194.73%, despite a net margin of -25.84%. Liquidity ratios are weak, with a current ratio of 0.56, and debt levels are concerning at 63.23% debt to assets. Like Unity, Domo pays no dividends, reflecting a focus on reinvestment and growth over shareholder payouts.
Which one has the best ratios?
Domo holds a more favorable overall ratio profile, with half of its ratios rated positively, notably strong returns on equity and invested capital. Unity has fewer favorable ratios and several key profitability concerns. However, Domo’s weak liquidity and high leverage balance the comparison, making its global ratios opinion neutral versus Unity’s slightly unfavorable rating.
Strategic Positioning
This section compares the strategic positioning of Unity Software Inc. and Domo, Inc. including Market position, Key segments, and disruption:
Unity Software Inc.
- Market position and competitive pressure
- Key segments and business drivers
- Exposure to technological disruption
Domo, Inc.
- Large market cap of 17.5B; operates globally with diversified sales channels.
- Two main segments: Create Solutions and Operate Solutions, with growing Operate revenue.
- Platform for interactive real-time 2D/3D content across multiple devices.
Unity Software Inc. vs Domo, Inc. Positioning
Unity is diversified in interactive content creation and operation solutions globally, while Domo concentrates on cloud BI subscriptions and services. Unity’s broader platform supports varied content types; Domo targets business data management with a more focused product suite.
Which has the best competitive advantage?
Domo shows a very favorable moat with growing ROIC and value creation, indicating durable competitive advantage. Unity’s declining ROIC and value destruction suggest weaker competitive positioning despite larger scale.
Stock Comparison
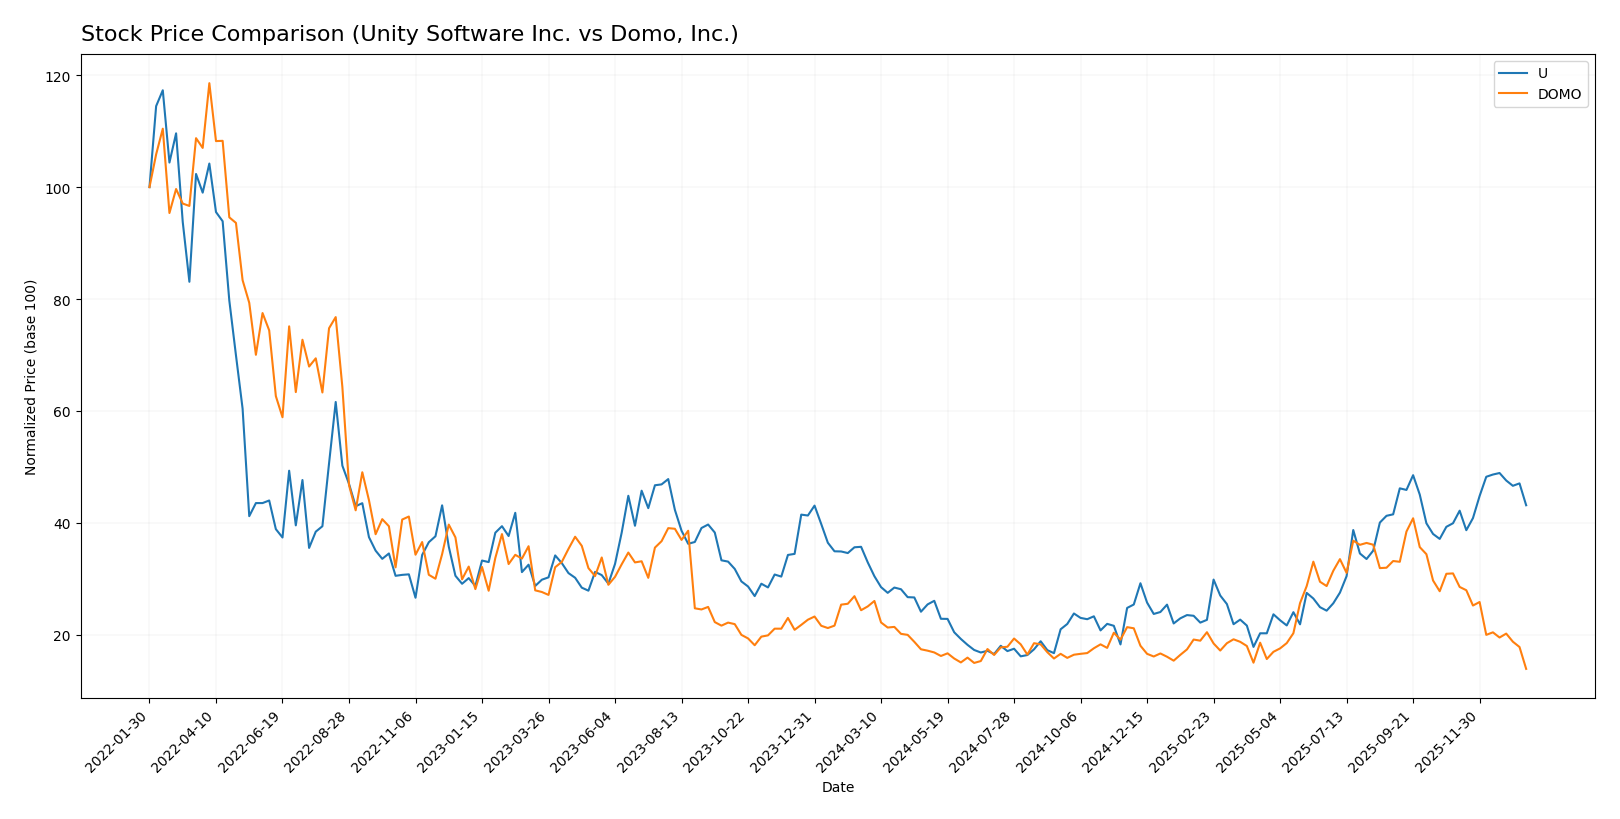
The stock price movements over the past year reveal contrasting trajectories, with Unity Software Inc. showing strong gains and acceleration, while Domo, Inc. exhibits significant declines and deceleration.
Trend Analysis
Unity Software Inc. experienced a bullish trend over the past 12 months, with a 31.0% price increase and accelerating momentum, reaching a high of 46.42 and a low of 15.32, accompanied by notable volatility (std deviation 9.04).
Domo, Inc. faced a bearish trend over the same period, with a 44.54% price decline and decelerating loss, hitting a high of 18.06 and a low of 6.15, with lower volatility (std deviation 3.01).
Comparing both, Unity Software delivered the highest market performance with a substantial positive return, whereas Domo’s stock showed a significant negative trend and weaker recent buyer interest.
Target Prices
The current analyst consensus shows clear target price ranges for both Unity Software Inc. and Domo, Inc.
| Company | Target High | Target Low | Consensus |
|---|---|---|---|
| Unity Software Inc. | 60 | 39 | 50.98 |
| Domo, Inc. | 13 | 10 | 11.5 |
Analysts expect Unity Software’s price to rise significantly above its current $40.95, while Domo’s consensus target of $11.5 is nearly double its present $6.15 stock price.
Analyst Opinions Comparison
This section compares analysts’ ratings and grades for Unity Software Inc. and Domo, Inc.:
Rating Comparison
Unity Software Inc. Rating
- Rating: D+ indicating a very favorable status.
- Discounted Cash Flow Score: 1, very unfavorable.
- ROE Score: 1, very unfavorable.
- ROA Score: 1, very unfavorable.
- Debt To Equity Score: 1, very unfavorable.
- Overall Score: 1, very unfavorable.
Domo, Inc. Rating
- Rating: C indicating a very favorable status.
- Discounted Cash Flow Score: 1, very unfavorable.
- ROE Score: 5, very favorable.
- ROA Score: 1, very unfavorable.
- Debt To Equity Score: 1, very unfavorable.
- Overall Score: 2, moderate.
Which one is the best rated?
Based on the data, Domo has a higher overall score and a significantly better ROE score than Unity, indicating a more favorable analyst rating, despite both companies sharing several very unfavorable financial scores.
Scores Comparison
The scores comparison between Unity Software Inc. and Domo, Inc. is as follows:
Unity Software Inc. Scores
- Altman Z-Score: 2.93, indicating moderate bankruptcy risk in the grey zone.
- Piotroski Score: 4, reflecting average financial strength.
Domo, Inc. Scores
- Altman Z-Score: -10.10, indicating high bankruptcy risk in the distress zone.
- Piotroski Score: 3, indicating very weak financial strength.
Which company has the best scores?
Unity Software Inc. shows a higher Altman Z-Score in the grey zone and a better Piotroski Score, indicating stronger financial health than Domo, Inc., which is in distress with very weak financial strength.
Grades Comparison
The following tables present recent grades assigned to Unity Software Inc. and Domo, Inc. by reputable financial institutions:
Unity Software Inc. Grades
This table summarizes recent grades and rating actions from major grading companies for Unity Software Inc.:
| Grading Company | Action | New Grade | Date |
|---|---|---|---|
| Morgan Stanley | Maintain | Overweight | 2026-01-13 |
| Goldman Sachs | Maintain | Neutral | 2026-01-13 |
| Wells Fargo | Maintain | Overweight | 2026-01-08 |
| Jefferies | Maintain | Buy | 2026-01-05 |
| Piper Sandler | Upgrade | Overweight | 2025-12-11 |
| BTIG | Upgrade | Buy | 2025-12-11 |
| Wells Fargo | Upgrade | Overweight | 2025-12-05 |
| Arete Research | Upgrade | Buy | 2025-12-01 |
| Citigroup | Maintain | Buy | 2025-11-11 |
| Wells Fargo | Maintain | Equal Weight | 2025-11-07 |
Unity Software Inc. shows a generally positive trend with several upgrades from Neutral to Buy or Overweight grades, reflecting improving analyst sentiment.
Domo, Inc. Grades
This table summarizes recent grades and rating actions from major grading companies for Domo, Inc.:
| Grading Company | Action | New Grade | Date |
|---|---|---|---|
| DA Davidson | Maintain | Neutral | 2025-12-05 |
| TD Cowen | Maintain | Buy | 2025-12-05 |
| Lake Street | Maintain | Hold | 2025-12-05 |
| DA Davidson | Maintain | Neutral | 2025-12-01 |
| JMP Securities | Maintain | Market Outperform | 2025-09-10 |
| DA Davidson | Maintain | Neutral | 2025-08-28 |
| Cantor Fitzgerald | Maintain | Overweight | 2025-08-28 |
| TD Cowen | Upgrade | Buy | 2025-08-26 |
| JMP Securities | Maintain | Market Outperform | 2025-06-25 |
| Cantor Fitzgerald | Maintain | Overweight | 2025-06-25 |
Domo, Inc. maintains a steady rating profile with mostly neutral to positive grades, including consistent Market Outperform and Overweight ratings without recent downgrades.
Which company has the best grades?
Both Unity Software Inc. and Domo, Inc. have an overall “Buy” consensus rating. Unity Software Inc. has a higher number of recent upgrades and Buy/Overweight grades, indicating stronger analyst conviction. Investors may interpret Unity’s more active upgrades as a signal of improving momentum, while Domo’s stable ratings suggest steady but less dynamic outlooks.
Strengths and Weaknesses
Here is a comparative overview of the key strengths and weaknesses of Unity Software Inc. (U) and Domo, Inc. (DOMO) based on the most recent financial and operational data:
| Criterion | Unity Software Inc. (U) | Domo, Inc. (DOMO) |
|---|---|---|
| Diversification | Moderate: Revenue split between Create Solutions (614M) and Operate Solutions (1.2B) with some strategic partnerships. | Moderate: Primarily subscription-based (286M) with smaller professional services (31M). |
| Profitability | Weak: Negative net margin (-36.6%), ROIC -12.8%, declining profitability. | Mixed: Negative net margin (-25.8%) but strong ROE (46.2%) and ROIC (194.7%), showing value creation. |
| Innovation | Moderate: Focus on creative and operational software solutions, but declining ROIC suggests challenges in sustaining competitive edge. | Strong: High ROIC growth and favorable profitability ratios indicate innovation and efficient capital use. |
| Global presence | Reasonable: Large revenue base with consistent growth in Operate Solutions. | Smaller scale but growing subscription revenue suggests expanding market reach. |
| Market Share | Established in gaming and interactive content software with stable revenue segments. | Emerging player in subscription analytics with rapidly increasing profitability and market traction. |
Key takeaways: Unity struggles with profitability and value destruction despite solid revenue streams, posing a risk. Domo, while less diversified and facing liquidity concerns, demonstrates strong capital efficiency and a durable competitive advantage, making it a cautiously optimistic choice.
Risk Analysis
Below is a comparison of key risks for Unity Software Inc. (U) and Domo, Inc. (DOMO) based on the most recent data available.
| Metric | Unity Software Inc. (U) | Domo, Inc. (DOMO) |
|---|---|---|
| Market Risk | High beta (2.05) indicates high volatility | Moderate beta (1.65) indicates moderate volatility |
| Debt level | Moderate debt-to-assets ratio at 35% | High debt-to-assets ratio at 63% |
| Regulatory Risk | Moderate, operating globally with exposure in multiple countries | Moderate, with international presence but smaller scale |
| Operational Risk | Negative net margin (-36.6%) and low asset turnover | Negative net margin (-25.8%) but better asset turnover (1.48) |
| Environmental Risk | Standard for software sector, no significant exposure | Standard for software sector, no significant exposure |
| Geopolitical Risk | Exposure in multiple international markets | Less diversified internationally, some exposure in Japan and US |
The most impactful risks are Unity’s high market volatility and persistent operational losses, while Domo faces significant financial distress with a very high debt level and a distress-zone Altman Z-score, indicating a higher bankruptcy risk. Both companies have no dividend yield, reflecting reinvestment or financial strain. Caution is warranted, especially with Domo’s fragile financial health and Unity’s operational inefficiencies.
Which Stock to Choose?
Unity Software Inc. (U) shows mixed income trends with a 17.1% revenue decline in 2024 but a 134.7% growth over 2020-2024. Its profitability ratios are mostly unfavorable, including a -36.6% net margin and negative ROE, with moderate debt levels and a slightly unfavorable global financial ratio rating. The company is rated D+ with very unfavorable financial scores, yet its Altman Z-Score suggests moderate bankruptcy risk.
Domo, Inc. (DOMO) displays a more stable income evolution with a slight 0.6% revenue decrease in 2025 but a positive 50.8% growth over 2021-2025. Its profitability includes a -25.8% net margin but strong ROE and ROIC, offset by a weak current ratio and high debt-to-assets ratio. DOMO holds a C rating with moderate overall scores but signs of financial distress from its Altman Z-Score and a very weak Piotroski Score.
Investors focused on value creation and profitability might find DOMO appealing due to its very favorable moat and improving return metrics, despite financial distress signals. Conversely, those prioritizing liquidity and moderate bankruptcy risk could consider Unity, which shows a slightly unfavorable ratio profile but a more stable Z-Score. Thus, the choice may depend on an investor’s tolerance for financial risk versus preference for growth and competitive advantage.
Disclaimer: Investment carries a risk of loss of initial capital. The past performance is not a reliable indicator of future results. Be sure to understand risks before making an investment decision.
Go Further
I encourage you to read the complete analyses of Unity Software Inc. and Domo, Inc. to enhance your investment decisions: