In the dynamic world of technology, Uber Technologies, Inc. and Domo, Inc. stand out as innovative software application companies shaping distinct yet overlapping markets. Uber revolutionizes mobility and delivery services globally, while Domo empowers businesses with real-time data intelligence through its cloud platform. This comparison explores their strategies and growth potential to help you decide which company is the more compelling investment opportunity in 2026. Let’s dive in to find out which one fits best in your portfolio.
Table of contents
Companies Overview
I will begin the comparison between Uber and Domo by providing an overview of these two companies and their main differences.
Uber Overview
Uber Technologies, Inc. operates proprietary technology applications globally, connecting consumers with independent providers for ridesharing, delivery, and freight services. Its business is segmented into Mobility, Delivery, and Freight, offering a wide range of transportation and logistics solutions. Founded in 2009 and headquartered in San Francisco, Uber is a major player in the technology sector with a market cap of 176.3B USD.
Domo Overview
Domo, Inc. provides a cloud-based business intelligence platform that connects all levels of an organization with real-time data and insights. Operating primarily in the US and Japan, it enables management of business operations via smartphones. Incorporated in 2010 and based in American Fork, Utah, Domo is a smaller technology company with a market cap of 257M USD, focusing on data-driven decision-making tools.
Key similarities and differences
Both Uber and Domo operate in the software application industry within the technology sector and are publicly traded US companies. Uber focuses on mobility, delivery, and freight services through a digital platform connecting consumers and providers, while Domo specializes in cloud-based business intelligence software, facilitating organizational data access and management. Their business models differ significantly in service scope and market size, with Uber operating a broad consumer-facing platform and Domo providing enterprise data solutions.
Income Statement Comparison
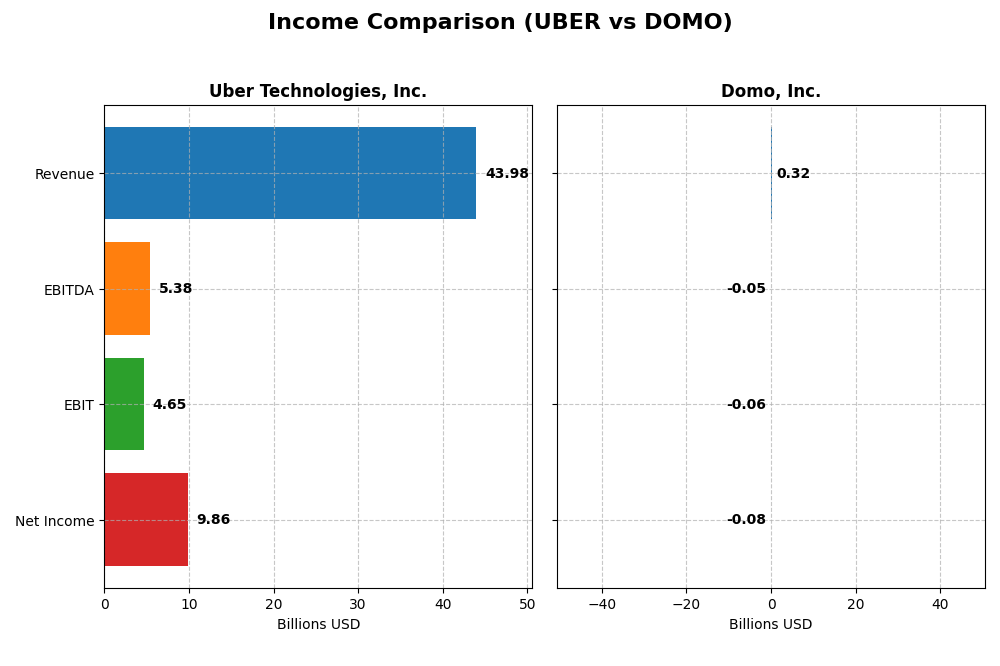
This table presents a factual comparison of key income statement metrics for Uber Technologies, Inc. and Domo, Inc. based on their most recent fiscal year data.
| Metric | Uber Technologies, Inc. | Domo, Inc. |
|---|---|---|
| Market Cap | 176.3B | 257M |
| Revenue | 43.98B | 317M |
| EBITDA | 5.39B | -50M |
| EBIT | 4.65B | -59M |
| Net Income | 9.81B | -82M |
| EPS | 4.71 | -2.13 |
| Fiscal Year | 2024 | 2025 |
Income Statement Interpretations
Uber Technologies, Inc.
Uber exhibited strong revenue growth from 2020 to 2024, increasing from $11.1B to $44B, alongside a significant turnaround in net income from a $6.7B loss in 2020 to a $9.8B profit in 2024. Gross, EBIT, and net margins improved consistently, with the 2024 net margin reaching 22.4%. The latest year showed robust 18% revenue growth and a 343% net margin increase, reflecting marked profitability gains.
Domo, Inc.
Domo’s revenue rose moderately from $210M in 2021 to $317M in 2025, but net losses persisted, with a net margin of -25.8% in 2025. Gross margin remained favorable at 74.5%, yet EBIT margin stayed negative at -18.7%. The most recent year saw a slight 0.6% revenue decline and worsening net margin, indicating challenges in achieving profitability despite operational efficiencies.
Which one has the stronger fundamentals?
Uber’s income statement shows consistent and sizable growth in revenue, profitability, and margins, supported by a fully favorable evaluation. In contrast, Domo’s income exhibits mixed results with moderate revenue growth but sustained losses and unfavorable margins. Overall, Uber demonstrates stronger and more stable fundamentals based on income metrics compared to Domo’s uneven performance.
Financial Ratios Comparison
The table below presents the most recent financial ratios for Uber Technologies, Inc. and Domo, Inc. for a clear side-by-side comparison as of their latest fiscal year.
| Ratios | Uber Technologies, Inc. (2024) | Domo, Inc. (2025) |
|---|---|---|
| ROE | 45.7% | 46.2% |
| ROIC | 6.8% | 194.7% |
| P/E | 12.8 | -3.98 |
| P/B | 5.86 | -1.84 |
| Current Ratio | 1.07 | 0.56 |
| Quick Ratio | 1.07 | 0.56 |
| D/E (Debt-to-Equity) | 0.53 | -0.76 |
| Debt-to-Assets | 22.3% | 63.2% |
| Interest Coverage | 5.35 | -2.99 |
| Asset Turnover | 0.86 | 1.48 |
| Fixed Asset Turnover | 14.14 | 8.17 |
| Payout Ratio | 0 | 0 |
| Dividend Yield | 0 | 0 |
Interpretation of the Ratios
Uber Technologies, Inc.
Uber shows a generally solid ratio profile with favorable net margin at 22.41% and strong ROE of 45.72%. However, the price-to-book ratio at 5.86 is unfavorable, suggesting a relatively high valuation compared to book value. Liquidity ratios are neutral to favorable, while leverage and coverage metrics remain balanced. Uber pays no dividends, likely reflecting a focus on reinvestment and growth rather than shareholder payouts.
Domo, Inc.
Domo presents a mixed ratio picture with a negative net margin of -25.84%, signaling ongoing profitability challenges despite a high ROE of 46.23% and exceptional ROIC of 194.73%. Liquidity and interest coverage ratios are unfavorable, indicating potential short-term financial pressure. Domo also does not pay dividends, consistent with its negative earnings and probable prioritization of R&D and expansion.
Which one has the best ratios?
Uber’s ratios are slightly favorable overall, balancing profitability and financial stability despite valuation concerns. Domo’s ratios are more polarized, with equal favorable and unfavorable marks, largely due to profitability and liquidity weaknesses. From a ratios perspective, Uber appears to offer a more stable profile, while Domo’s metrics reflect higher operational and financial risk.
Strategic Positioning
This section compares the strategic positioning of Uber and Domo, focusing on Market position, Key segments, and Exposure to technological disruption:
Uber
- Large global presence with significant competitive pressure in multiple regions.
- Operates through three segments: Mobility, Delivery, and Freight driving revenues.
- Proprietary technology platforms in transportation and delivery, exposed to tech innovation risks.
Domo
- Smaller market cap, niche player with less competitive intensity.
- Focuses on cloud-based business intelligence platform with subscription and services.
- Cloud-based BI platform reliant on real-time data connectivity, sensitive to tech shifts.
Uber vs Domo Positioning
Uber pursues a diversified strategy across mobility, delivery, and freight segments, leveraging global scale but facing intense competition and operational complexity. Domo concentrates on cloud BI with subscription-driven revenue, offering specialization but limited scale and market breadth.
Which has the best competitive advantage?
Domo shows a very favorable moat with strong value creation and growing ROIC, indicating a durable competitive advantage. Uber, despite growing ROIC, has a slightly unfavorable moat due to value destruction, reflecting weaker capital efficiency.
Stock Comparison
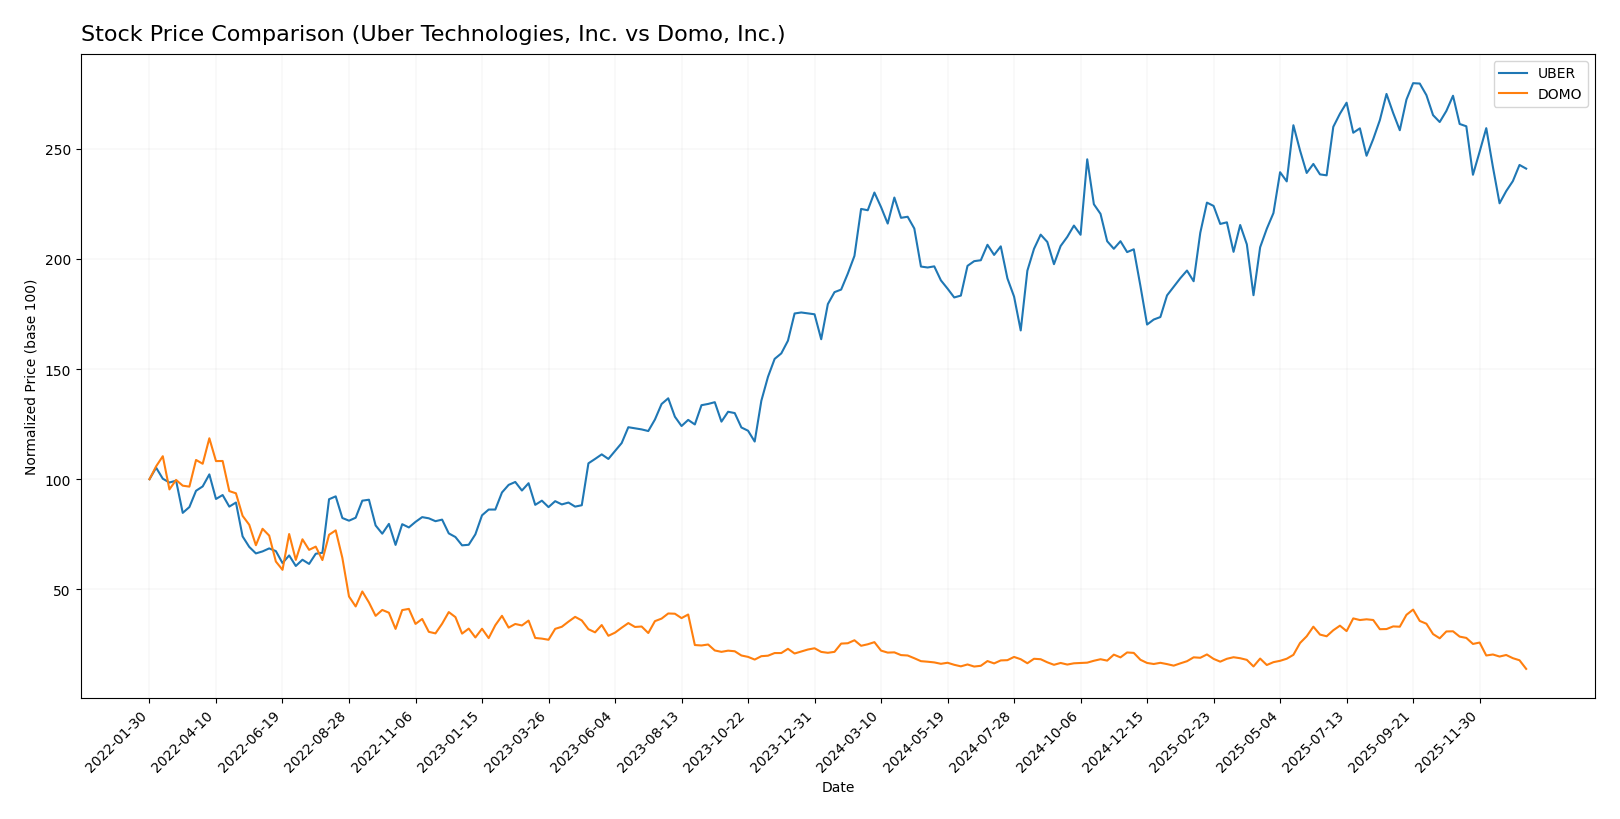
The stock price chart highlights key movements over the past 12 months, with Uber Technologies, Inc. showing an overall bullish trend despite recent declines, while Domo, Inc. displays a sustained bearish trajectory with accelerating losses.
Trend Analysis
Uber Technologies, Inc. experienced an 8.5% price increase over the past year, indicating a bullish trend with deceleration. The stock ranged between 58.99 and 98.51, but recent months show a 12.07% decline and seller dominance.
Domo, Inc. posted a significant 44.54% price decrease over the last 12 months, confirming a bearish trend with deceleration. The stock hit a high of 18.06 and a low of 6.15, with recent declines accelerating to -55.11%.
Comparing both, Uber delivered the highest market performance with positive annual growth, whereas Domo’s shares suffered steep losses and stronger downward momentum.
Target Prices
The current analyst target consensus suggests moderate upside potential for Uber Technologies, Inc. and Domo, Inc.
| Company | Target High | Target Low | Consensus |
|---|---|---|---|
| Uber Technologies, Inc. | 140 | 73 | 111.26 |
| Domo, Inc. | 13 | 10 | 11.5 |
Analysts expect Uber’s stock to rise from its current $84.85 price toward a consensus target of $111.26, indicating significant growth potential. Domo’s target consensus of $11.5 also suggests upside versus its current $6.15 price, reflecting cautious optimism.
Analyst Opinions Comparison
This section compares analysts’ ratings and grades for Uber Technologies, Inc. and Domo, Inc.:
Rating Comparison
Uber Rating
- Rating: B, classified as Very Favorable
- Discounted Cash Flow Score: 1, indicating Very Unfavorable
- ROE Score: 5, indicating Very Favorable
- ROA Score: 5, indicating Very Favorable
- Debt To Equity Score: 2, indicating Moderate risk
- Overall Score: 3, indicating Moderate
Domo Rating
- Rating: C, classified as Very Favorable
- Discounted Cash Flow Score: 1, indicating Very Unfavorable
- ROE Score: 5, indicating Very Favorable
- ROA Score: 1, indicating Very Unfavorable
- Debt To Equity Score: 1, indicating Very Unfavorable
- Overall Score: 2, indicating Moderate
Which one is the best rated?
Uber holds a higher rating of B versus Domo’s C and scores better overall, particularly in ROA and debt management. Domo matches Uber’s ROE score but scores lower in asset efficiency and financial stability.
Scores Comparison
Here is a comparison of the financial scores for Uber and Domo:
Uber Scores
- Altman Z-Score: 4.44 indicating a safe zone, low bankruptcy risk.
- Piotroski Score: 6, reflecting average financial strength.
Domo Scores
- Altman Z-Score: -10.10 indicating distress zone, high bankruptcy risk.
- Piotroski Score: 3, reflecting very weak financial strength.
Which company has the best scores?
Based on the provided data, Uber shows stronger financial health with a safe-zone Altman Z-Score and an average Piotroski Score. Domo’s scores indicate financial distress and very weak financial strength.
Grades Comparison
Here is a comparison of the latest available grades from reputable grading companies for both companies:
Uber Technologies, Inc. Grades
The table below summarizes recent grades and rating actions from recognized firms for Uber Technologies, Inc.:
| Grading Company | Action | New Grade | Date |
|---|---|---|---|
| BTIG | Maintain | Buy | 2026-01-15 |
| Wells Fargo | Maintain | Overweight | 2026-01-08 |
| Cantor Fitzgerald | Maintain | Overweight | 2026-01-08 |
| Wolfe Research | Maintain | Outperform | 2026-01-06 |
| Wedbush | Maintain | Neutral | 2025-12-19 |
| Morgan Stanley | Maintain | Overweight | 2025-12-08 |
| Arete Research | Upgrade | Buy | 2025-12-03 |
| Wells Fargo | Maintain | Overweight | 2025-11-05 |
| Guggenheim | Maintain | Buy | 2025-11-05 |
| DA Davidson | Maintain | Buy | 2025-11-05 |
Overall, Uber has a strong consensus with multiple Buy and Overweight ratings, indicating a positive trend in analyst sentiment.
Domo, Inc. Grades
The table below presents recent grades and rating actions from established firms for Domo, Inc.:
| Grading Company | Action | New Grade | Date |
|---|---|---|---|
| DA Davidson | Maintain | Neutral | 2025-12-05 |
| TD Cowen | Maintain | Buy | 2025-12-05 |
| Lake Street | Maintain | Hold | 2025-12-05 |
| DA Davidson | Maintain | Neutral | 2025-12-01 |
| JMP Securities | Maintain | Market Outperform | 2025-09-10 |
| DA Davidson | Maintain | Neutral | 2025-08-28 |
| Cantor Fitzgerald | Maintain | Overweight | 2025-08-28 |
| TD Cowen | Upgrade | Buy | 2025-08-26 |
| JMP Securities | Maintain | Market Outperform | 2025-06-25 |
| Cantor Fitzgerald | Maintain | Overweight | 2025-06-25 |
Domo’s grades show a mix of Neutral, Hold, Buy, and Market Outperform ratings, reflecting moderate analyst confidence with some upgrades.
Which company has the best grades?
Uber Technologies, Inc. has generally received stronger and more consistent Buy and Overweight ratings compared to Domo, Inc., which has a broader range including Neutral and Hold grades. This difference in grades may influence investor perception of relative confidence and growth potential.
Strengths and Weaknesses
Below is a comparative table highlighting the key strengths and weaknesses of Uber Technologies, Inc. and Domo, Inc. based on the most recent financial and operational data.
| Criterion | Uber Technologies, Inc. | Domo, Inc. |
|---|---|---|
| Diversification | Strong diversification with Mobility ($25B), Delivery ($13.75B), and Freight ($5.14B) segments | Limited diversification: primarily Subscription ($286M) and Professional Services ($31M) |
| Profitability | Positive net margin (22.41%), ROE 45.72%, but ROIC slightly below WACC indicating value shedding | Negative net margin (-25.84%) but strong ROE (46.23%) and very high ROIC exceeding WACC, showing value creation |
| Innovation | Growing ROIC trend suggesting improving profitability; strong fixed asset turnover (14.14) | Very favorable ROIC trend, high asset turnover (1.48), but struggling with liquidity and interest coverage |
| Global presence | Large global footprint in mobility and delivery markets | Smaller scale with limited global reach and weaker liquidity ratios |
| Market Share | Leading market positions in ride-sharing and food delivery | Niche player in business intelligence software with growing subscription base |
Key takeaways: Uber shows strong market diversification and profitability with improving returns, despite slight value destruction currently. Domo demonstrates a durable competitive advantage with exceptional ROIC growth but faces profitability and liquidity challenges. Investors should weigh Uber’s scale and steady growth against Domo’s high-risk, high-reward profile.
Risk Analysis
Below is a comparative table highlighting key risks for Uber Technologies, Inc. and Domo, Inc. as of the most recent fiscal years:
| Metric | Uber Technologies, Inc. | Domo, Inc. |
|---|---|---|
| Market Risk | Moderate (Beta 1.20) | High (Beta 1.65) |
| Debt Level | Moderate (Debt/Equity 0.53) | Elevated (Debt/Equity -0.76, Debt to Assets 63.23%) |
| Regulatory Risk | Moderate (Ride-sharing regulations) | Moderate (Data privacy and cloud regulations) |
| Operational Risk | Moderate (Platform reliance, gig economy labor issues) | High (Smaller scale, reliance on cloud infrastructure) |
| Environmental Risk | Low (Limited direct impact) | Low (Limited direct impact) |
| Geopolitical Risk | Moderate (Global operations exposure) | Low (Primarily US and Japan) |
Uber faces moderate market and regulatory risks due to its global footprint and evolving gig economy regulations. Its debt profile is stable, with solid interest coverage. Domo, however, shows higher financial distress signals, including a negative Altman Z-score and weak liquidity, increasing bankruptcy risk. Operationally, Domo’s smaller size and financial fragility pose significant challenges. Investors should weigh Uber’s moderate but manageable risks against Domo’s elevated financial and operational vulnerabilities.
Which Stock to Choose?
Uber Technologies, Inc. shows a favorable income evolution with a 17.96% revenue growth in 2024, strong profitability indicated by a 22.41% net margin, moderate debt levels, and a very favorable overall rating of B. Its financial ratios are slightly favorable, supported by strong returns on equity (45.7%) and assets, but a relatively high price-to-book ratio.
Domo, Inc. presents a less favorable income evolution with negative one-year revenue growth and a -25.84% net margin, despite very favorable return on equity (46.2%) and invested capital. Its financial ratios are neutral overall but split evenly between favorable and unfavorable, reflecting high debt-to-assets and weak liquidity, with a very favorable rating of C.
Investors focused on growth might find Domo’s strong return on invested capital and value creation appealing despite its risks, while those prioritizing stability and consistent profitability could see Uber as a more favorable choice given its solid income growth, financial strength, and slightly favorable ratio profile.
Disclaimer: Investment carries a risk of loss of initial capital. The past performance is not a reliable indicator of future results. Be sure to understand risks before making an investment decision.
Go Further
I encourage you to read the complete analyses of Uber Technologies, Inc. and Domo, Inc. to enhance your investment decisions: