Choosing the right technology stock requires careful comparison, especially when companies operate in overlapping sectors. Tyler Technologies, Inc. (TYL) specializes in integrated software solutions for the public sector, while Domo, Inc. (DOMO) offers a cloud-based business intelligence platform. Both innovate in software applications but target distinct market needs. In this article, I will analyze these companies to help you decide which is the more compelling investment opportunity.
Table of contents
Companies Overview
I will begin the comparison between Tyler Technologies, Inc. and Domo, Inc. by providing an overview of these two companies and their main differences.
Tyler Technologies Overview
Tyler Technologies, Inc. provides integrated information management solutions and services primarily for the public sector. Its offerings include enterprise software for government agencies, judicial systems, public safety, tax assessment, and K-12 schools. The company also delivers cloud hosting services in partnership with Amazon Web Services. Tyler is headquartered in Plano, Texas, and operates with a workforce of 7,462 employees, positioning itself as a key technology provider for public sector operations.
Domo Overview
Domo, Inc. operates a cloud-based business intelligence platform that connects employees across organizations with real-time data and insights accessible via smartphones. The company serves markets in the United States, Japan, and internationally. Headquartered in American Fork, Utah, Domo employs 888 people and focuses on enabling business management through its digital platform. Established in 2010, it targets enterprises seeking enhanced data-driven decision-making.
Key similarities and differences
Both Tyler and Domo operate in the software application industry within the technology sector, providing cloud-based solutions. Tyler focuses on public sector software with a broad range of government and educational applications, while Domo specializes in business intelligence platforms for varied industries. Tyler’s larger scale and extensive product suite contrast with Domo’s more niche, data-centric approach. Both companies trade publicly but differ in market capitalization and employee size, reflecting their distinct market positions and operational scopes.
Income Statement Comparison
This table compares the key income statement metrics for Tyler Technologies, Inc. and Domo, Inc. for their most recent fiscal years.
| Metric | Tyler Technologies, Inc. (TYL) | Domo, Inc. (DOMO) |
|---|---|---|
| Market Cap | 18.9B | 257M |
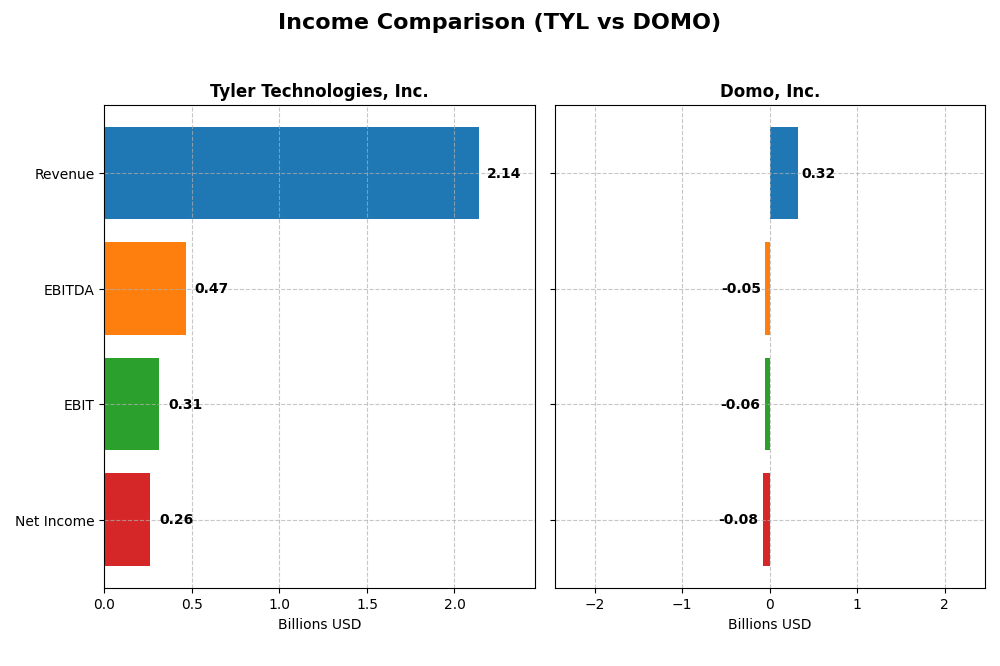
| Revenue | 2.14B | 317M |
| EBITDA | 466M | -50M |
| EBIT | 314M | -59M |
| Net Income | 263M | -82M |
| EPS | 6.17 | -2.13 |
| Fiscal Year | 2024 | 2025 |
Income Statement Interpretations
Tyler Technologies, Inc.
Tyler Technologies showed strong revenue growth from $1.12B in 2020 to $2.14B in 2024, with net income rising from $195M to $263M. Margins remained robust, with a favorable gross margin around 41% and net margin near 12%. The 2024 performance highlighted accelerated EBIT growth of 42%, reflecting improved profitability and operational efficiency.
Domo, Inc.
Domo’s revenue increased from $210M in 2021 to $317M in 2025, but net income remained negative, with losses widening to $82M in 2025. Gross margin stayed high at 74%, yet EBIT and net margins were unfavorable, showing negative returns. Recent results indicate slight revenue decline and worsening net margin, signaling persistent operational challenges.
Which one has the stronger fundamentals?
Tyler Technologies exhibits stronger fundamentals with consistent revenue and net income growth, favorable margins, and improved profitability in the latest year. Conversely, Domo, despite revenue growth over the longer term, faces negative earnings and unfavorable margins, resulting in an overall unfavorable income statement evaluation. Tyler’s financial trends suggest more stable earnings quality.
Financial Ratios Comparison
Below is a comparison of key financial ratios for Tyler Technologies, Inc. (TYL) and Domo, Inc. (DOMO) based on their most recent fiscal year data.
| Ratios | Tyler Technologies, Inc. (2024) | Domo, Inc. (2025) |
|---|---|---|
| ROE | 7.76% | 46.23% |
| ROIC | 6.20% | 194.73% |
| P/E | 93.42 | -3.98 |
| P/B | 7.25 | -1.84 |
| Current Ratio | 1.35 | 0.56 |
| Quick Ratio | 1.35 | 0.56 |
| D/E (Debt-to-Equity) | 0.19 | -0.76 |
| Debt-to-Assets | 12.32% | 63.23% |
| Interest Coverage | 50.50 | -2.99 |
| Asset Turnover | 0.41 | 1.48 |
| Fixed Asset Turnover | 10.95 | 8.17 |
| Payout Ratio | 0 | 0 |
| Dividend Yield | 0 | 0 |
Interpretation of the Ratios
Tyler Technologies, Inc.
Tyler Technologies shows a mixed ratio profile with strong net margin at 12.3% and solid interest coverage of 52.96, reflecting good profitability and debt service capacity. However, high P/E of 93.42 and P/B of 7.25 indicate potential overvaluation risks. The company does not pay dividends, suggesting a focus on reinvestment and growth rather than shareholder distributions.
Domo, Inc.
Domo exhibits contrasting ratios with a negative net margin of -25.84% but impressive returns on equity (46.23%) and invested capital (194.73%), indicating high growth potential despite losses. Its low current and quick ratios (0.56) and negative interest coverage highlight liquidity and solvency concerns. Domo also does not pay dividends, likely prioritizing reinvestment and expansion over payouts.
Which one has the best ratios?
Tyler Technologies presents a slightly favorable overall ratio profile, balancing profitability and financial stability despite valuation concerns. Domo’s ratios are more polarized, showing strong growth metrics but significant liquidity and profitability weaknesses. Based on these evaluations, Tyler’s ratios appear more balanced, while Domo’s reflect higher risk and volatility.
Strategic Positioning
This section compares the strategic positioning of Tyler Technologies and Domo, including market position, key segments, and exposure to disruption:
Tyler Technologies
- Leading provider in public sector software with strong NYSE presence; faces moderate competitive pressure.
- Diverse public sector solutions: enterprise software, appraisal, tax, SaaS, professional services, and transaction fees.
- Strategic AWS collaboration supports cloud hosting; operates in established public sector niche with moderate disruption risk.
Domo
- Smaller market cap with NASDAQ listing; operates in competitive cloud BI sector.
- Focused on cloud-based business intelligence platform with subscription and professional services.
- Cloud-native BI platform faces higher technological disruption risks in fast-evolving data analytics market.
Tyler Technologies vs Domo Positioning
Tyler Technologies pursues a diversified approach across public sector software and services, offering broad revenue streams. Domo concentrates on cloud BI subscriptions, implying focused but potentially higher growth and disruption exposure. Tyler’s scale contrasts with Domo’s niche specialization.
Which has the best competitive advantage?
Domo shows a very favorable moat with growing ROIC and value creation, indicating a durable competitive advantage. Tyler Technologies has a very unfavorable moat, with declining ROIC and value destruction, reflecting weaker competitive positioning.
Stock Comparison
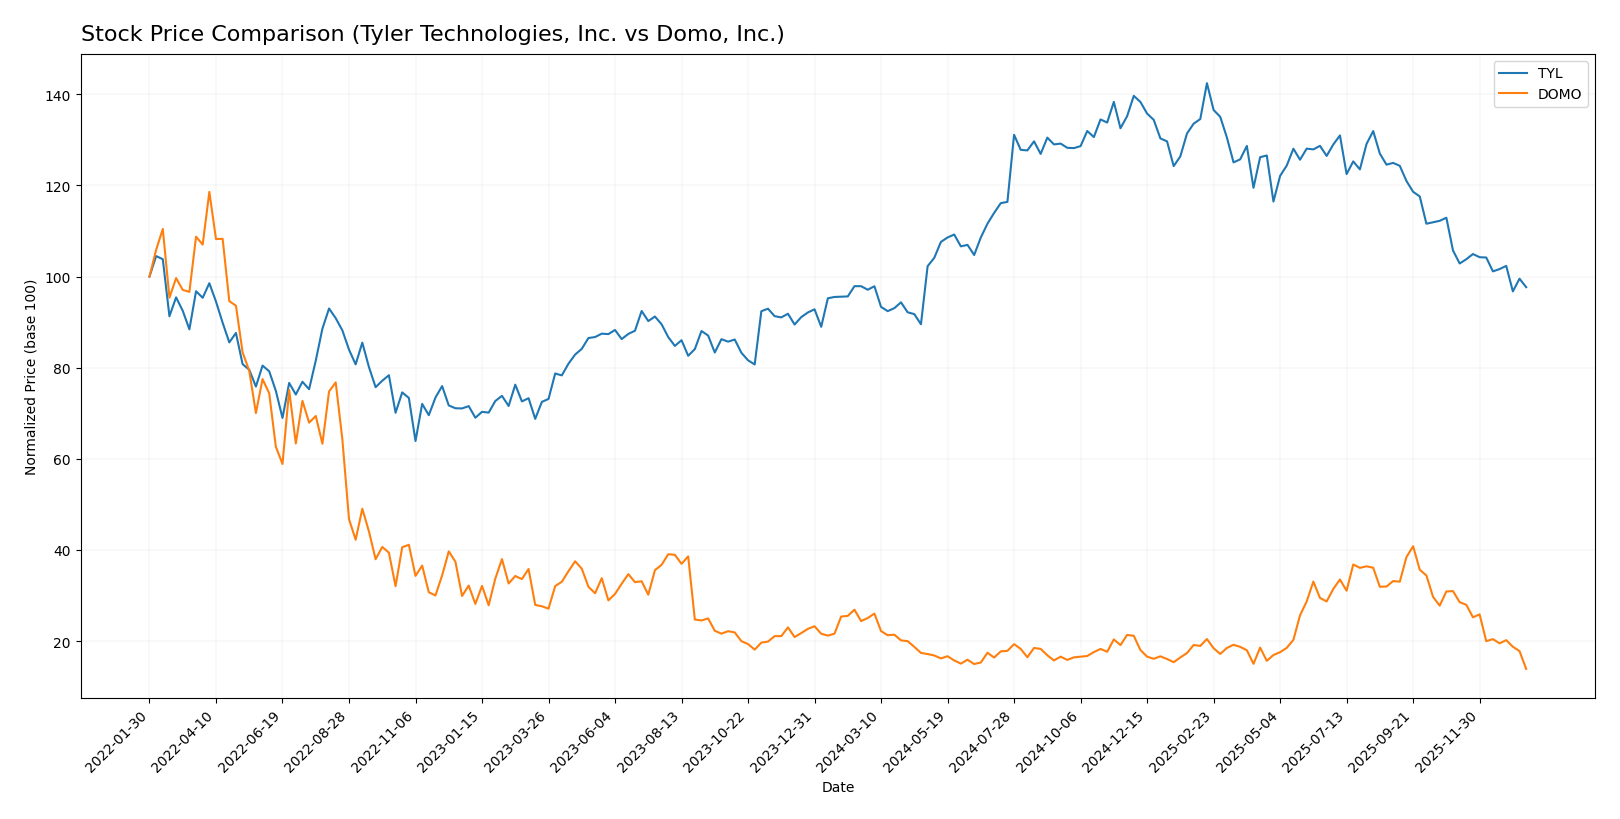
The stock price movements over the past year reveal contrasting trends: Tyler Technologies, Inc. (TYL) shows a modest overall gain with recent weakness, while Domo, Inc. (DOMO) experiences a pronounced decline with accelerating selling pressure.
Trend Analysis
Tyler Technologies, Inc. recorded a 0.58% price increase over the past 12 months, indicating a neutral trend with decelerating momentum. The stock traded between 403.35 and 641.7, showing high volatility (std deviation 61.82). Recent weeks show a -7.61% drop with increased seller dominance.
Domo, Inc. posted a -44.54% price change over the same period, confirming a bearish trend with decelerating losses. The stock ranged from 6.15 to 18.06 with low volatility (std deviation 3.01). Recent trading intensified the decline by -55.11%, accompanied by strong seller dominance.
Comparing both stocks, Tyler Technologies delivered the highest market performance with a slight overall gain, while Domo experienced a significant loss, reflecting divergent investor sentiment and trading dynamics.
Target Prices
The current analyst consensus indicates a favorable outlook with defined high and low targets for both companies.
| Company | Target High | Target Low | Consensus |
|---|---|---|---|
| Tyler Technologies, Inc. | 675 | 470 | 584 |
| Domo, Inc. | 13 | 10 | 11.5 |
Analysts expect Tyler Technologies to trade well above its current price of 440, signaling potential upside. Domo’s consensus target is nearly double its current price of 6.15, indicating strong growth expectations.
Analyst Opinions Comparison
This section compares analysts’ ratings and grades for Tyler Technologies, Inc. and Domo, Inc.:
Rating Comparison
TYL Rating
- Rated B, indicating a very favorable overall standing.
- Discounted Cash Flow Score of 4, reflecting favorable cash flow projections.
- Return on Equity Score of 3, a moderate efficiency in generating shareholder profit.
- Return on Assets Score of 4, demonstrating favorable asset utilization.
- Debt To Equity Score of 3, moderate financial risk due to debt levels.
- Overall Score of 3, signifying a moderate overall financial performance.
DOMO Rating
- Rated C, also marked as very favorable overall rating.
- Discounted Cash Flow Score of 1, indicating a very unfavorable cash flow view.
- Return on Equity Score of 5, showing very favorable profit generation from equity.
- Return on Assets Score of 1, reflecting very unfavorable asset efficiency.
- Debt To Equity Score of 1, indicating very unfavorable financial risk profile.
- Overall Score of 2, representing moderate but lower overall performance than TYL.
Which one is the best rated?
Tyler Technologies holds a higher overall rating (B) and stronger scores in discounted cash flow, return on assets, and debt to equity compared to Domo, which scores better only in return on equity but has weaker marks elsewhere. Based on these metrics, Tyler is better rated overall.
Scores Comparison
Here is a comparison of the Altman Z-Score and Piotroski Score for Tyler Technologies, Inc. and Domo, Inc.:
TYL Scores
- Altman Z-Score: 7.42, indicating a safe zone with low bankruptcy risk.
- Piotroski Score: 6, reflecting average financial strength.
DOMO Scores
- Altman Z-Score: -10.10, indicating distress zone with high bankruptcy risk.
- Piotroski Score: 3, reflecting very weak financial strength.
Which company has the best scores?
Tyler Technologies shows a strong Altman Z-Score in the safe zone and an average Piotroski Score, while Domo is in distress with a much lower Altman Z-Score and very weak Piotroski Score. Tyler clearly has better scores here.
Grades Comparison
Here is the comparison of recent grades and ratings for Tyler Technologies, Inc. and Domo, Inc.:
Tyler Technologies, Inc. Grades
The table below displays recent analyst grades from reputable firms for Tyler Technologies, Inc.:
| Grading Company | Action | New Grade | Date |
|---|---|---|---|
| Piper Sandler | Maintain | Overweight | 2026-01-13 |
| Wells Fargo | Maintain | Equal Weight | 2026-01-08 |
| DA Davidson | Maintain | Neutral | 2025-12-09 |
| Evercore ISI Group | Maintain | In Line | 2025-10-31 |
| DA Davidson | Maintain | Neutral | 2025-10-31 |
| DA Davidson | Maintain | Neutral | 2025-10-10 |
| DA Davidson | Maintain | Neutral | 2025-08-05 |
| Barclays | Maintain | Overweight | 2025-07-31 |
| Needham | Maintain | Buy | 2025-05-13 |
| Barclays | Maintain | Overweight | 2025-04-25 |
Tyler Technologies shows a stable trend with mostly “Overweight,” “Buy,” and “Neutral” grades, indicating consistent confidence among analysts.
Domo, Inc. Grades
Below is the recent grading data from recognized firms for Domo, Inc.:
| Grading Company | Action | New Grade | Date |
|---|---|---|---|
| DA Davidson | Maintain | Neutral | 2025-12-05 |
| TD Cowen | Maintain | Buy | 2025-12-05 |
| Lake Street | Maintain | Hold | 2025-12-05 |
| DA Davidson | Maintain | Neutral | 2025-12-01 |
| JMP Securities | Maintain | Market Outperform | 2025-09-10 |
| DA Davidson | Maintain | Neutral | 2025-08-28 |
| Cantor Fitzgerald | Maintain | Overweight | 2025-08-28 |
| TD Cowen | Upgrade | Buy | 2025-08-26 |
| JMP Securities | Maintain | Market Outperform | 2025-06-25 |
| Cantor Fitzgerald | Maintain | Overweight | 2025-06-25 |
Domo, Inc. grades indicate a generally positive outlook with several “Buy,” “Overweight,” and “Market Outperform” recommendations, demonstrating analyst optimism.
Which company has the best grades?
Both Tyler Technologies and Domo have a consensus “Buy” rating, yet Tyler Technologies has more frequent “Overweight” and “Buy” grades from multiple firms, suggesting marginally stronger analyst support. For investors, this may reflect a more consistent positive outlook on Tyler Technologies compared to Domo’s mixed “Neutral” and “Hold” alongside its positive ratings.
Strengths and Weaknesses
The table below compares key strengths and weaknesses of Tyler Technologies, Inc. (TYL) and Domo, Inc. (DOMO) based on recent financial and strategic data.
| Criterion | Tyler Technologies, Inc. (TYL) | Domo, Inc. (DOMO) |
|---|---|---|
| Diversification | Moderate: Revenue spread across software, services, and fees segments | Moderate: Focused on subscription and professional services |
| Profitability | Moderate: Net margin 12.3%, ROIC 6.2%, but declining ROIC trend and value destruction | Mixed: Negative net margin (-25.8%) but very high ROIC (194.7%) and strong ROE (46.2%) |
| Innovation | Stable, but with declining economic moat and value destruction risk | High: Strong economic moat with growing ROIC, signaling innovation and competitive advantage |
| Global presence | Established in public sector software with steady revenue streams | More limited scale and liquidity; growing but less stable financials |
| Market Share | Strong in government software markets; steady revenue segments | Growing in cloud-based analytics market; subscription revenues increasing |
In summary, Tyler Technologies offers steady revenue and moderate profitability but faces challenges with declining returns on invested capital, signaling caution for investors. Domo shows impressive ROIC growth and innovation but struggles with profitability and liquidity, implying higher risk with potential for reward if financials stabilize.
Risk Analysis
Below is a risk comparison table for Tyler Technologies, Inc. (TYL) and Domo, Inc. (DOMO) based on the most recent data available in 2026:
| Metric | Tyler Technologies, Inc. (TYL) | Domo, Inc. (DOMO) |
|---|---|---|
| Market Risk | Moderate (Beta 0.916) | High (Beta 1.65) |
| Debt level | Low (Debt-to-Equity 0.19, favorable) | High (Debt-to-Assets 63.23%, unfavorable) |
| Regulatory Risk | Moderate (Public sector software, some compliance needs) | Moderate (Cloud-based BI platform, data privacy concerns) |
| Operational Risk | Low (Established with 7,462 employees) | High (Smaller size, 888 employees, and operational losses) |
| Environmental Risk | Low (Software sector, minimal direct impact) | Low (Software sector, minimal direct impact) |
| Geopolitical Risk | Low (US-focused public sector) | Moderate (International presence adds exposure) |
In summary, Domo faces the most impactful risks with high market volatility, significant debt burden, and operational challenges, reflected also by its distress zone Altman Z-score. Tyler Technologies shows moderate market risk but benefits from strong financial stability and low debt, making it a safer choice for cautious investors.
Which Stock to Choose?
Tyler Technologies, Inc. (TYL) shows favorable income evolution with a 9.53% revenue growth in 2024, strong net margin at 12.3%, and solid financial ratios. Its debt levels are low and manageable, supported by a favorable interest coverage and a B rating reflecting very favorable overall financial health.
Domo, Inc. (DOMO) exhibits an unfavorable income statement with negative net margin of -25.84% and declining revenue growth of -0.61% in 2025. Financial ratios are mixed with high ROE but unfavorable liquidity and debt metrics. Despite a C rating marked as very favorable, the company faces challenges with financial stability.
Investors prioritizing stability and solid profitability may find Tyler Technologies’ profile more favorable due to its strong income growth, low debt, and stable financial ratios. Conversely, those with a higher risk tolerance focused on turnaround potential might see Domo’s improving ROIC and growth metrics as indicative of possible future value creation.
Disclaimer: Investment carries a risk of loss of initial capital. The past performance is not a reliable indicator of future results. Be sure to understand risks before making an investment decision.
Go Further
I encourage you to read the complete analyses of Tyler Technologies, Inc. and Domo, Inc. to enhance your investment decisions: