In the fast-evolving software industry, PTC Inc. and Domo, Inc. stand out as innovative players reshaping enterprise solutions. Both companies operate in the software application sector, offering platforms that enhance business efficiency through digital transformation and data intelligence. While PTC focuses on product lifecycle and augmented reality, Domo excels in cloud-based business intelligence. This article will explore which company presents a more compelling investment opportunity for your portfolio.
Table of contents
Companies Overview
I will begin the comparison between PTC Inc. and Domo, Inc. by providing an overview of these two companies and their main differences.
PTC Overview
PTC Inc. is a software and services company headquartered in Boston, Massachusetts, operating globally across the Americas, Europe, and Asia Pacific. It specializes in application software with products like ThingWorx for digital transformation, Vuforia for augmented reality, and multiple product lifecycle management tools. Founded in 1985, PTC serves enterprises by enabling innovation through scalable and easy-to-implement solutions.
Domo Overview
Domo, Inc., based in American Fork, Utah, offers a cloud-based business intelligence platform that connects all organizational levels with real-time data and insights, accessible via smartphones. Founded in 2010, Domo focuses on enhancing decision-making globally, including the U.S. and Japan, by integrating people, data, and systems digitally. It operates within the technology sector, emphasizing data-driven business management.
Key similarities and differences
Both PTC and Domo operate in the software application industry and focus on digital solutions that enhance business operations. PTC emphasizes product lifecycle management and augmented reality tools, targeting enterprise digital transformation, while Domo centers on cloud-based business intelligence and real-time data accessibility. The companies differ significantly in scale, with PTC having a market cap near $20B and a larger workforce compared to Domo’s $257M market cap and smaller team.
Income Statement Comparison
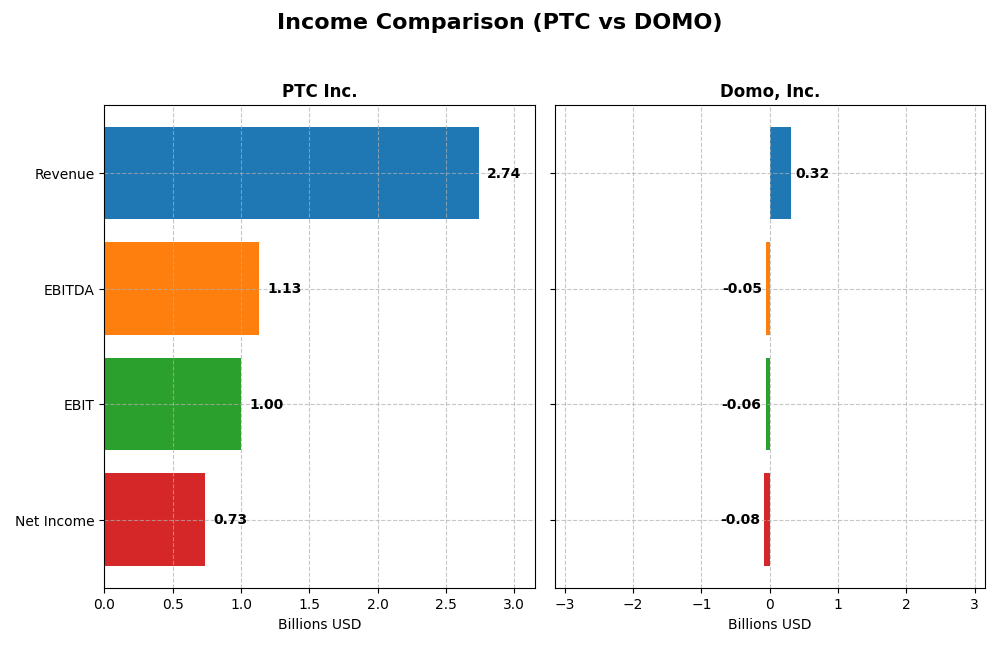
This table compares key income statement metrics of PTC Inc. and Domo, Inc. for their most recent fiscal year, providing a clear overview of their financial performance.
| Metric | PTC Inc. | Domo, Inc. |
|---|---|---|
| Market Cap | 19.9B | 257M |
| Revenue | 2.74B | 317M |
| EBITDA | 1.13B | -50M |
| EBIT | 997M | -59M |
| Net Income | 734M | -82M |
| EPS | 6.18 | -2.13 |
| Fiscal Year | 2025 | 2025 |
Income Statement Interpretations
PTC Inc.
PTC Inc. has demonstrated strong growth in revenue and net income over the 2021-2025 period, with revenue rising from $1.81B in 2021 to $2.74B in 2025 and net income increasing from $477M to $734M. Margins have remained robust, with a gross margin of 83.8% and a net margin of 26.8% in 2025. The latest year saw a significant 19.2% revenue growth and a near doubling of EPS, indicating improved profitability.
Domo, Inc.
Domo, Inc. experienced revenue growth from $210M in 2021 to $317M in 2025 but posted consistent net losses throughout this period, with a net loss of $82M in 2025. Gross margin was favorable at 74.5%, yet EBIT and net margins were negative, -18.7% and -25.8% respectively in the latest year. Recent performance shows a slight revenue decline and worsening net margin, reflecting ongoing profitability challenges.
Which one has the stronger fundamentals?
PTC Inc. presents stronger fundamentals, supported by steady revenue and significant net income growth, alongside favorable margins and profitability metrics. In contrast, Domo, Inc. has struggled with negative earnings and unfavorable EBIT and net margins despite revenue expansion. Overall, PTC’s consistent profitability and margin improvements underscore a more robust income statement profile.
Financial Ratios Comparison
Below is a comparison of key financial ratios for PTC Inc. and Domo, Inc. based on their most recent fiscal year data.
| Ratios | PTC Inc. (2025) | Domo, Inc. (2025) |
|---|---|---|
| ROE | 19.2% | 46.2% |
| ROIC | 14.4% | 194.7% |
| P/E | 33.2 | -3.98 |
| P/B | 6.37 | -1.84 |
| Current Ratio | 1.12 | 0.56 |
| Quick Ratio | 1.12 | 0.56 |
| D/E | 0.36 | -0.76 |
| Debt-to-Assets | 20.7% | 63.2% |
| Interest Coverage | 12.8 | -3.0 |
| Asset Turnover | 0.41 | 1.48 |
| Fixed Asset Turnover | 15.6 | 8.17 |
| Payout Ratio | 0% | 0% |
| Dividend Yield | 0% | 0% |
Interpretation of the Ratios
PTC Inc.
PTC shows a majority of favorable ratios, including a strong net margin of 26.8% and a return on equity of 19.18%, indicating solid profitability and efficient equity use. However, elevated P/E and P/B ratios suggest possibly overvaluation. The company does not pay dividends, implying a focus on reinvestment and growth rather than shareholder payouts.
Domo, Inc.
Domo’s ratios reflect mixed performance with strong returns on equity (46.23%) and invested capital (194.73%), but a negative net margin of -25.84% and poor liquidity ratios highlight operational and financial challenges. It does not pay dividends, consistent with its negative net income and likely reinvestment in development and growth initiatives.
Which one has the best ratios?
PTC’s ratios are generally favorable with balanced profitability and manageable debt, despite valuation concerns. Domo exhibits high returns but struggles with profitability and liquidity, creating a neutral overall profile. Based solely on ratio strength and stability, PTC appears to present a more consistent financial foundation.
Strategic Positioning
This section compares the strategic positioning of PTC and Domo, including Market position, Key segments, and disruption:
PTC
- Large market cap of 19.9B, established since 1985, faces moderate competitive pressure.
- Diversified software segments: License, Support and Cloud Services, Technology Service.
- Operates platforms like ThingWorx and Vuforia, integrating AR and SaaS solutions.
Domo
- Smaller market cap of 257M, younger company since 2010, with higher beta indicating volatility.
- Focused on cloud-based BI platform with Subscription and Professional Services revenue.
- Cloud-based platform connects all organizational levels with real-time data access.
PTC vs Domo Positioning
PTC employs a diversified approach across multiple software and service segments with established products, offering broad industrial digital transformation. Domo concentrates on cloud BI with a streamlined subscription model, emphasizing connectivity and real-time insights but with narrower segment exposure.
Which has the best competitive advantage?
Both show very favorable MOAT evaluations with growing ROIC surpassing WACC, indicating durable competitive advantages; Domo’s higher ROIC growth suggests stronger recent profitability improvements, while PTC benefits from scale and diversified offerings.
Stock Comparison
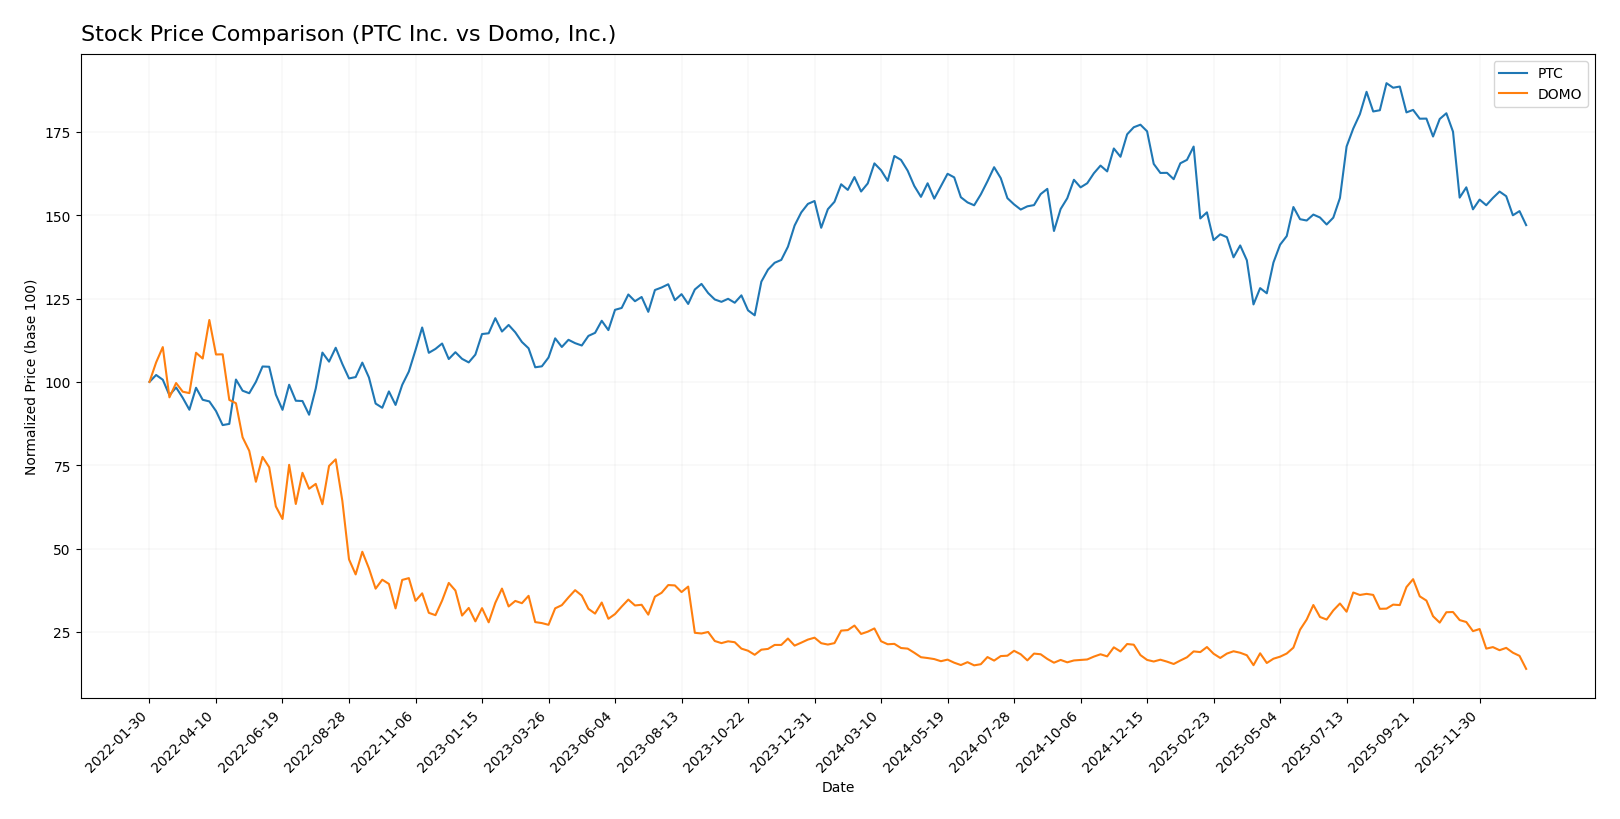
The stock price dynamics over the past year reveal distinct bearish trends for both PTC Inc. and Domo, Inc., with PTC showing a moderate decline and Domo a steeper loss, accompanied by varying trading volumes and buyer-seller behaviors.
Trend Analysis
PTC Inc. experienced a bearish trend over the past 12 months, with a price decline of 7.84% and decelerating momentum, exhibiting significant volatility with a standard deviation of 15.47 and prices ranging from 139.77 to 215.05.
Domo, Inc. registered a sharper bearish trend over the same period, with a 44.54% price drop and deceleration in trend, lower volatility at 3.01 standard deviation, and a price range between 6.15 and 18.06.
Comparing both, PTC outperformed Domo in market performance, showing a less severe decline and higher buyer volume, while Domo faced stronger seller dominance and deeper losses.
Target Prices
The current analyst consensus presents clear target price ranges for PTC Inc. and Domo, Inc.
| Company | Target High | Target Low | Consensus |
|---|---|---|---|
| PTC Inc. | 255 | 120 | 213.25 |
| Domo, Inc. | 13 | 10 | 11.5 |
Analysts expect PTC’s stock to appreciate significantly from its current price of $166.75, with a consensus target of $213.25. Domo’s consensus target of $11.5 also suggests upside potential compared to its current $6.15 price.
Analyst Opinions Comparison
This section compares analysts’ ratings and grades for PTC Inc. and Domo, Inc.:
Rating Comparison
PTC Rating
- Rating: B+, considered very favorable by analysts.
- Discounted Cash Flow Score: 4, indicating a favorable valuation outlook.
- ROE Score: 4, reflecting favorable profit generation from equity.
- ROA Score: 5, very favorable, showing effective use of assets to generate earnings.
- Debt To Equity Score: 2, moderate financial risk with some reliance on debt.
- Overall Score: 3, moderate overall financial standing.
DOMO Rating
- Rating: C, also noted as very favorable in status.
- Discounted Cash Flow Score: 1, seen as very unfavorable for valuation.
- ROE Score: 5, very favorable, showing strong efficiency in generating shareholder returns.
- ROA Score: 1, very unfavorable, indicating less effective asset utilization.
- Debt To Equity Score: 1, very unfavorable, indicating higher financial risk due to debt.
- Overall Score: 2, moderate overall financial standing but lower than PTC.
Which one is the best rated?
Based strictly on the provided data, PTC holds a higher overall rating (B+) and scores better in discounted cash flow, ROA, and debt-to-equity metrics, suggesting a more balanced financial profile compared to Domo.
Scores Comparison
The following table compares the Altman Z-Score and Piotroski Score of PTC Inc. and Domo, Inc.:
PTC Scores
- Altman Z-Score: 5.67, indicating a safe zone status with low bankruptcy risk.
- Piotroski Score: 8, classified as very strong financial health.
DOMO Scores
- Altman Z-Score: -10.10, indicating distress zone status with high bankruptcy risk.
- Piotroski Score: 3, considered very weak financial health.
Which company has the best scores?
Based on the provided data, PTC Inc. has significantly better scores than Domo, Inc., showing strong financial health and low bankruptcy risk, unlike Domo, which is in distress.
Grades Comparison
Here is a detailed comparison of recent grades assigned to PTC Inc. and Domo, Inc.:
PTC Inc. Grades
The following table summarizes PTC Inc.’s recent grades from established financial institutions:
| Grading Company | Action | New Grade | Date |
|---|---|---|---|
| Piper Sandler | Maintain | Neutral | 2025-11-07 |
| Rosenblatt | Maintain | Buy | 2025-11-06 |
| Rosenblatt | Maintain | Buy | 2025-10-30 |
| Oppenheimer | Maintain | Outperform | 2025-07-31 |
| Rosenblatt | Maintain | Buy | 2025-07-31 |
| Barclays | Maintain | Overweight | 2025-07-31 |
| Stifel | Maintain | Buy | 2025-07-31 |
| Keybanc | Maintain | Overweight | 2025-07-31 |
| RBC Capital | Maintain | Outperform | 2025-07-31 |
| Piper Sandler | Maintain | Neutral | 2025-07-31 |
Overall, PTC Inc. maintains a predominantly positive rating trend, with multiple buy and outperform grades and no downgrades observed.
Domo, Inc. Grades
The following table summarizes Domo, Inc.’s recent grades from recognized grading firms:
| Grading Company | Action | New Grade | Date |
|---|---|---|---|
| DA Davidson | Maintain | Neutral | 2025-12-05 |
| TD Cowen | Maintain | Buy | 2025-12-05 |
| Lake Street | Maintain | Hold | 2025-12-05 |
| DA Davidson | Maintain | Neutral | 2025-12-01 |
| JMP Securities | Maintain | Market Outperform | 2025-09-10 |
| DA Davidson | Maintain | Neutral | 2025-08-28 |
| Cantor Fitzgerald | Maintain | Overweight | 2025-08-28 |
| TD Cowen | Upgrade | Buy | 2025-08-26 |
| JMP Securities | Maintain | Market Outperform | 2025-06-25 |
| Cantor Fitzgerald | Maintain | Overweight | 2025-06-25 |
Domo, Inc.’s grades show a stable to positive outlook with several buy and market outperform ratings, along with neutral and hold positions, reflecting mixed but generally favorable sentiment.
Which company has the best grades?
PTC Inc. has received a higher number of buy and outperform ratings compared to Domo, Inc., which has a mix of buy, hold, and neutral grades. This suggests PTC may be viewed more favorably by analysts, potentially influencing investor confidence and portfolio weighting decisions.
Strengths and Weaknesses
The table below compares key strengths and weaknesses of PTC Inc. and Domo, Inc. based on recent financial performance, market presence, and innovation capacity.
| Criterion | PTC Inc. | Domo, Inc. |
|---|---|---|
| Diversification | Strong with License, Cloud, and Tech Services revenues exceeding $2.8B in 2025 | Focused on Subscription and Professional Services, total about $317M in 2025 |
| Profitability | High net margin (26.8%) and ROIC (14.4%), value creator with growing returns | Mixed profitability: negative net margin (-25.8%) but very high ROIC (194.7%) |
| Innovation | Consistent technology service revenue growth and strong asset turnover | High asset turnover (1.48) and innovation reflected in rapid ROIC growth |
| Global presence | Established global footprint with diversified revenue streams | More limited scale and geographic reach compared to PTC |
| Market Share | Significant market share in industrial software and IoT markets | Niche player in business intelligence with growing subscription base |
PTC shows robust diversification and consistent profitability supported by strong operational efficiency. Domo displays impressive growth in capital returns but struggles with profitability and liquidity, indicating higher risk. Investors should weigh PTC’s stability against Domo’s potential for rapid value creation.
Risk Analysis
Below is a comparative risk assessment table for PTC Inc. and Domo, Inc. based on their latest 2025 financial and operational data:
| Metric | PTC Inc. | Domo, Inc. |
|---|---|---|
| Market Risk | Beta 1.01 (moderate) | Beta 1.65 (high volatility) |
| Debt level | Debt/Equity 0.36 (low) | Debt/Equity negative but Debt-to-Assets 63.2% (high leverage) |
| Regulatory Risk | Moderate, US tech sector | Moderate, US tech sector |
| Operational Risk | Low, stable revenues & scalable SaaS platforms | High, negative net margin and liquidity constraints |
| Environmental Risk | Low, software industry | Low, software industry |
| Geopolitical Risk | Moderate, global operations | Moderate, some international exposure |
The most impactful risk for Domo is its financial distress indicated by a negative net margin (-25.8%), weak liquidity (current ratio 0.56), and a high debt burden (63.2% debt-to-assets), which elevates bankruptcy risk (Altman Z-score in distress zone). PTC maintains stronger financial health with favorable profitability, moderate leverage, and a safe Altman Z-score, though its relatively high valuation multiples (PE 33.2, PB 6.4) could temper upside. Investors should weigh Domo’s high operational and financial risks against PTC’s steadier but moderately valued profile.
Which Stock to Choose?
PTC Inc. shows a favorable income evolution with strong revenue and net income growth over 2021–2025, supported by solid profitability metrics and a manageable debt level. Its financial ratios are mostly favorable, reflecting a sound balance sheet and efficient capital use, validated by a B+ rating.
Domo, Inc. displays a mixed income profile with overall unfavorable recent profitability and income growth, despite some long-term improvements. Financial ratios highlight significant weaknesses, including liquidity concerns and high debt-to-assets, though the firm has a very favorable ROIC trend but a lower overall rating of C.
Investors focused on stability and quality might find PTC’s consistent profitability and favorable rating more appealing, whereas those with a higher risk tolerance and interest in potential turnaround or growth might see Domo’s improving ROIC and unique profile as worth monitoring, considering its financial challenges and neutral ratios evaluation.
Disclaimer: Investment carries a risk of loss of initial capital. The past performance is not a reliable indicator of future results. Be sure to understand risks before making an investment decision.
Go Further
I encourage you to read the complete analyses of PTC Inc. and Domo, Inc. to enhance your investment decisions: