In today’s fast-evolving tech landscape, selecting the right software company to invest in requires careful analysis. Domo, Inc. and Perfect Corp. both operate in the application software sector but focus on different niches—business intelligence versus AI-driven beauty and fashion tech. Their innovation strategies and market approaches highlight unique growth potentials. This article will help you determine which company offers the most compelling opportunity for your investment portfolio.

Table of contents
Companies Overview
I will begin the comparison between Domo and Perfect Corp. by providing an overview of these two companies and their main differences.
Domo Overview
Domo, Inc. operates a cloud-based business intelligence platform designed to connect all levels of an organization, from CEOs to frontline employees, with real-time data and insights. Headquartered in American Fork, Utah, Domo provides tools to manage business through smartphones and serves clients in the US, Japan, and internationally. The company is positioned in the Software – Application industry with a market cap of approximately 257M USD.
Perfect Corp. Overview
Perfect Corp. offers SaaS solutions integrating artificial intelligence and augmented reality to enhance beauty and fashion tech experiences. Based in New Taipei City, Taiwan, the company develops virtual try-on applications and AI-powered analysis tools across multiple cosmetic and fashion categories. Founded in 2015, Perfect Corp. operates within the Software – Application sector and holds a market cap near 179M USD.
Key similarities and differences
Both Domo and Perfect Corp. operate in the Software – Application industry, focusing on innovative technology solutions. Domo emphasizes cloud-based business intelligence and organizational data connectivity, while Perfect Corp. specializes in AI and AR applications for beauty and fashion sectors. Their markets differ geographically and by application, with Domo targeting enterprise data management and Perfect Corp. catering to consumer-oriented tech in beauty and fashion.
Income Statement Comparison
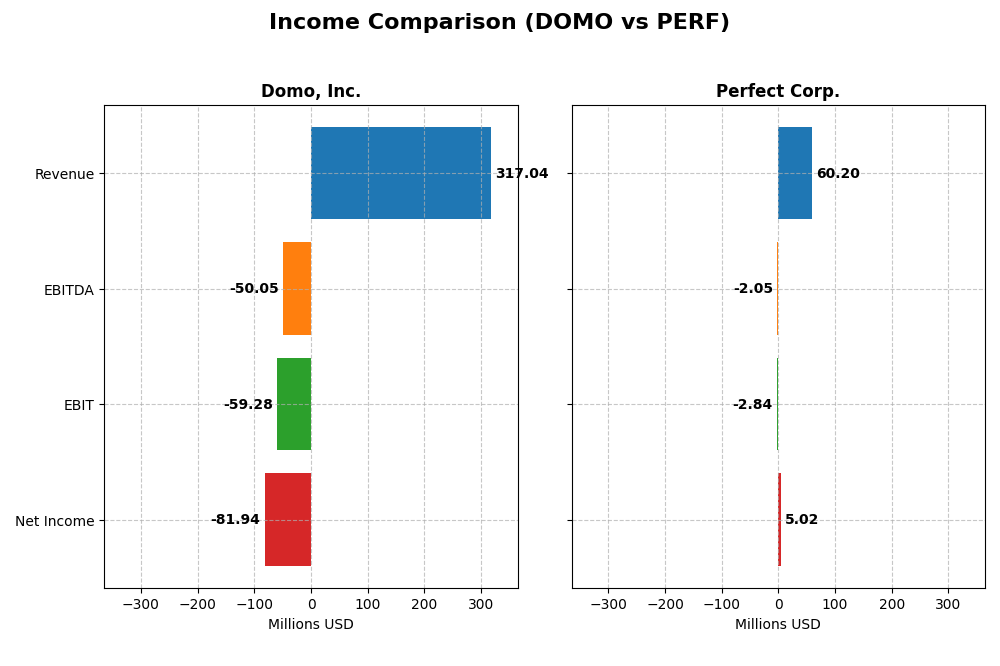
The table below compares key income statement metrics for Domo, Inc. and Perfect Corp. for their most recent fiscal years, highlighting revenue, profitability, and earnings per share.
| Metric | Domo, Inc. (DOMO) | Perfect Corp. (PERF) |
|---|---|---|
| Market Cap | 257M | 179M |
| Revenue | 317M | 60M |
| EBITDA | -50M | -2M |
| EBIT | -59M | -3M |
| Net Income | -82M | 5M |
| EPS | -2.13 | 0.05 |
| Fiscal Year | 2025 | 2024 |
Income Statement Interpretations
Domo, Inc.
Domo’s revenue grew by 50.84% from 2021 to 2025, but it slightly declined by 0.61% in the most recent year. Gross margins remained strong at 74.45%, yet EBIT and net margins stayed negative at -18.7% and -25.84%, respectively. The latest fiscal year showed a slowdown in growth with deteriorating profitability and a slight net income decline, reflecting ongoing operational challenges.
Perfect Corp.
Perfect Corp. demonstrated robust revenue growth of 101.53% over 2020–2024, with a 12.52% increase in the last year. Gross margin is solid at 77.98%, and net margin positive at 8.34%, though EBIT margin remains negative at -4.72%. Despite a recent dip in EBIT and net margin growth, the company’s overall profitability and EPS improved, reflecting strengthened fundamentals and operational efficiency.
Which one has the stronger fundamentals?
Perfect Corp. shows stronger fundamentals with favorable growth across revenue, net income, and margins, alongside positive net profitability and improving EPS. Conversely, Domo struggles with negative EBIT and net margins, with recent revenue and profitability declines. The contrasting margin profiles and growth trends suggest Perfect Corp. holds a more favorable income statement position over the evaluated period.
Financial Ratios Comparison
The table below presents a side-by-side comparison of key financial ratios for Domo, Inc. and Perfect Corp. based on their most recent fiscal year data, providing insight into their financial health and market valuation.
| Ratios | Domo, Inc. (2025) | Perfect Corp. (2024) |
|---|---|---|
| ROE | 0.46 | 0.03 |
| ROIC | 1.95 | -0.02 |
| P/E | -3.98 | 56.6 |
| P/B | -1.84 | 1.93 |
| Current Ratio | 0.56 | 5.52 |
| Quick Ratio | 0.56 | 5.52 |
| D/E | -0.76 | 0.00 |
| Debt-to-Assets | 0.63 | 0.00 |
| Interest Coverage | -2.99 | -449 |
| Asset Turnover | 1.48 | 0.33 |
| Fixed Asset Turnover | 8.17 | 57.94 |
| Payout ratio | 0 | 0 |
| Dividend yield | 0 | 0 |
Interpretation of the Ratios
Domo, Inc.
Domo exhibits a mixed ratio profile with strong returns on equity (46.23%) and invested capital (194.73%), but it suffers from a weak net margin (-25.84%) and liquidity issues, indicated by a low current ratio (0.56). Debt metrics are mixed, with favorable debt-to-equity but high debt-to-assets (63.23%). The company does not pay dividends, likely prioritizing reinvestment and growth given its negative free cash flow and operating cash flow.
Perfect Corp.
Perfect Corp. shows a neutral net margin (8.34%) but weak returns on equity (3.42%) and invested capital (-2.1%). Its balance sheet is strong with a high current ratio (5.52) and low debt-to-assets (0.28%), though interest coverage is negative. The company does not distribute dividends, consistent with a growth or reinvestment strategy, supported by positive free cash flow but negative earnings yield.
Which one has the best ratios?
Domo presents a balanced mix of favorable profitability and efficiency ratios but struggles with liquidity and solvency. Perfect Corp. has a stronger liquidity position and low leverage but weaker profitability and efficiency metrics. Considering overall ratio evaluations, Domo’s profile is neutral while Perfect’s is slightly unfavorable, reflecting divergent financial strengths and weaknesses.
Strategic Positioning
This section compares the strategic positioning of Domo, Inc. and Perfect Corp., focusing on market position, key segments, and exposure to technological disruption:
Domo, Inc.
- Operates in cloud-based business intelligence with moderate competitive pressure.
- Key segments include subscription services and professional services driving revenue.
- Positioned in technology with potential disruption from evolving AI and cloud platforms.
Perfect Corp.
- Provides AI and AR beauty and fashion tech solutions in a niche market.
- Focuses on SaaS AI and AR applications for virtual try-ons and beauty tech.
- Highly exposed to AI and AR technology advancements in beauty and fashion.
Domo, Inc. vs Perfect Corp. Positioning
Domo adopts a diversified approach with cloud-based business intelligence serving multiple industries, offering stable subscription revenues. Perfect Corp. has a concentrated focus on AI-driven beauty and fashion tech, specializing in virtual try-on solutions, which may limit market breadth but enhances niche expertise.
Which has the best competitive advantage?
Domo shows a very favorable MOAT with growing ROIC well above WACC, indicating durable competitive advantage and value creation. Perfect Corp. has a slightly unfavorable MOAT, shedding value but improving profitability, reflecting weaker competitive positioning.
Stock Comparison
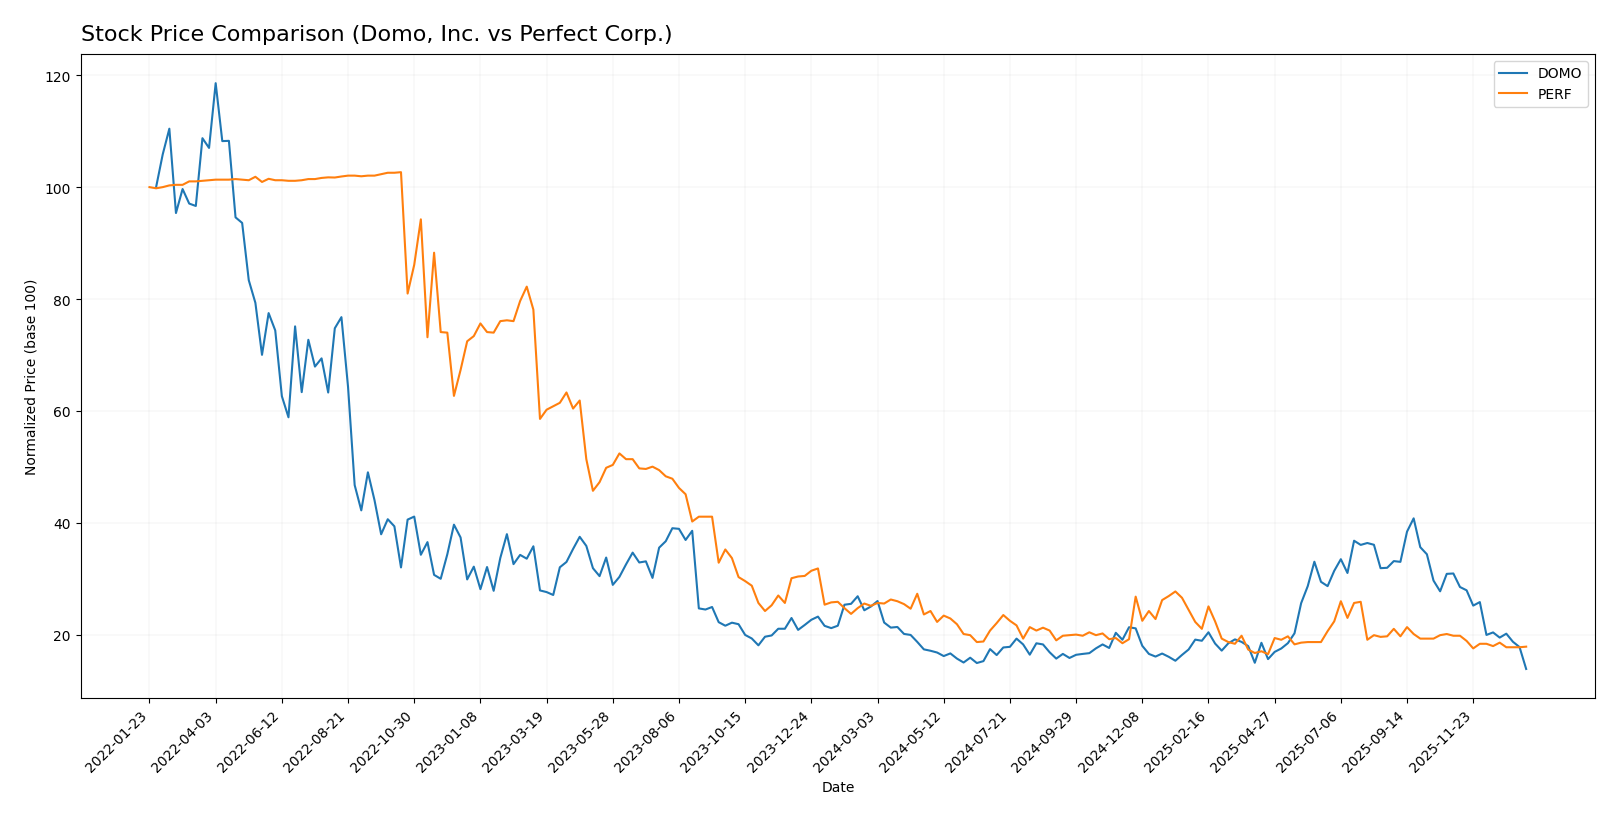
The stock price movements over the past year reveal significant declines for both Domo, Inc. and Perfect Corp., with persistent bearish trends and decelerating momentum, highlighting challenging market dynamics for these companies.
Trend Analysis
Domo, Inc. experienced a pronounced bearish trend with a -44.54% price change over the past 12 months, showing deceleration and elevated volatility at a 3.01 standard deviation, peaking at 18.06 and bottoming at 6.15.
Perfect Corp. also faced a bearish trend with a -28.98% decline over the same period, accompanied by decelerating momentum and lower volatility of 0.27 standard deviation, with a high of 2.7 and a low of 1.61.
Comparing both, Domo, Inc. underperformed Perfect Corp. with a larger negative price change, indicating that Perfect Corp. delivered the relatively higher market performance over the last year.
Target Prices
The consensus target prices indicate moderate upside potential for both Domo, Inc. and Perfect Corp.
| Company | Target High | Target Low | Consensus |
|---|---|---|---|
| Domo, Inc. | 13 | 10 | 11.5 |
| Perfect Corp. | 7 | 7 | 7 |
Analysts expect Domo’s stock to rise significantly from its current price of 6.15 USD, while Perfect Corp. shows a strong target at 7 USD compared to its current price of 1.74 USD, indicating notable potential gains.
Analyst Opinions Comparison
This section compares analysts’ ratings and grades for Domo, Inc. and Perfect Corp.:
Rating Comparison
DOMO Rating
- Rating: C, evaluated as Very Favorable overall.
- Discounted Cash Flow Score: 1, considered Very Unfavorable.
- ROE Score: 5, assessed as Very Favorable, indicating strong profit efficiency.
- ROA Score: 1, rated Very Unfavorable, showing weak asset utilization.
- Debt To Equity Score: 1, Very Unfavorable, indicating higher financial risk.
- Overall Score: 2, Moderate overall assessment.
PERF Rating
- Rating: A-, evaluated as Very Favorable overall.
- Discounted Cash Flow Score: 5, considered Very Favorable.
- ROE Score: 2, assessed as Moderate, indicating moderate profit efficiency.
- ROA Score: 3, rated Moderate, showing average asset utilization.
- Debt To Equity Score: 4, Favorable, indicating lower financial risk.
- Overall Score: 4, Favorable overall assessment.
Which one is the best rated?
Based strictly on the provided data, Perfect Corp. is better rated than Domo, Inc., with higher scores in overall rating, discounted cash flow, ROA, and debt-to-equity metrics, despite Domo’s stronger ROE score.
Scores Comparison
The following table compares the Altman Z-Score and Piotroski Score for Domo, Inc. and Perfect Corp.:
Domo, Inc. Scores
- Altman Z-Score: -10.10, placing Domo in distress zone with high bankruptcy risk.
- Piotroski Score: 3, considered very weak financial health and weak investment quality.
Perfect Corp. Scores
- Altman Z-Score: 1.31, also in distress zone showing significant financial risk.
- Piotroski Score: 6, representing average financial strength and moderate investment potential.
Which company has the best scores?
Perfect Corp. shows better scores overall with a higher Piotroski Score of 6 compared to Domo’s 3, and a less negative Altman Z-Score, although both remain in the distress zone. This indicates relatively stronger financial health for Perfect Corp. based on the provided data.
Grades Comparison
Here is a detailed comparison of the recent grades assigned to Domo, Inc. and Perfect Corp.:
Domo, Inc. Grades
The following table shows recent grades from well-known grading companies for Domo, Inc.:
| Grading Company | Action | New Grade | Date |
|---|---|---|---|
| DA Davidson | Maintain | Neutral | 2025-12-05 |
| TD Cowen | Maintain | Buy | 2025-12-05 |
| Lake Street | Maintain | Hold | 2025-12-05 |
| DA Davidson | Maintain | Neutral | 2025-12-01 |
| JMP Securities | Maintain | Market Outperform | 2025-09-10 |
| DA Davidson | Maintain | Neutral | 2025-08-28 |
| Cantor Fitzgerald | Maintain | Overweight | 2025-08-28 |
| TD Cowen | Upgrade | Buy | 2025-08-26 |
| JMP Securities | Maintain | Market Outperform | 2025-06-25 |
| Cantor Fitzgerald | Maintain | Overweight | 2025-06-25 |
Overall, Domo, Inc. has received mostly positive grades with a strong consensus rating of “Buy,” reflecting a generally favorable outlook among analysts.
Perfect Corp. Grades
The following table presents recent grades from recognized grading firms for Perfect Corp.:
| Grading Company | Action | New Grade | Date |
|---|---|---|---|
| Piper Sandler | Maintain | Neutral | 2024-02-29 |
| Goldman Sachs | Maintain | Neutral | 2023-10-26 |
| Piper Sandler | Maintain | Neutral | 2023-10-25 |
| Piper Sandler | Maintain | Neutral | 2023-07-26 |
| Piper Sandler | Maintain | Neutral | 2023-07-25 |
| Piper Sandler | Maintain | Neutral | 2023-04-27 |
| Oppenheimer | Downgrade | Perform | 2023-04-20 |
| Oppenheimer | Downgrade | Perform | 2023-04-19 |
| Oppenheimer | Downgrade | Perform | 2023-04-18 |
| Piper Sandler | Maintain | Neutral | 2023-03-08 |
Perfect Corp. shows a consistent pattern of “Neutral” grades with a consensus rating of “Hold,” indicating a cautious analyst sentiment.
Which company has the best grades?
Domo, Inc. has received better and more optimistic grades than Perfect Corp., with several “Buy” and “Market Outperform” ratings compared to Perfect Corp.’s mostly “Neutral” and “Perform” grades. This suggests Domo might be seen as having stronger growth or value potential by analysts, which could influence investor confidence and portfolio decisions.
Strengths and Weaknesses
The table below summarizes the key strengths and weaknesses of Domo, Inc. (DOMO) and Perfect Corp. (PERF) based on their recent financial and strategic evaluations.
| Criterion | Domo, Inc. (DOMO) | Perfect Corp. (PERF) |
|---|---|---|
| Diversification | Moderate: Revenue mainly from Subscription (286M in 2025) and Professional Services (~31M) | Limited data; likely focused business model |
| Profitability | Mixed: High ROIC (195%) and ROE (46%), but negative net margin (-25.8%) | Low profitability with negative ROIC (-2.1%) and low ROE (3.4%) |
| Innovation | Strong: Demonstrates durable competitive advantage with growing ROIC | Moderate: Improving profitability but still value destructive |
| Global presence | Solid: Established with global subscription services | Unclear, but financial ratios suggest smaller scale |
| Market Share | Significant in data analytics software sector | Likely niche player in beauty tech or related sectors |
Key takeaways: Domo excels with a strong competitive moat, high capital efficiency, and solid market presence, despite current net losses. Perfect Corp. shows improving profitability but remains less efficient and value-destructive, warranting cautious monitoring.
Risk Analysis
Below is a comparative risk table for Domo, Inc. (DOMO) and Perfect Corp. (PERF) based on the latest 2025 and 2024 data.
| Metric | Domo, Inc. (DOMO) | Perfect Corp. (PERF) |
|---|---|---|
| Market Risk | High beta (1.65) indicates higher volatility. | Low beta (0.45) suggests lower volatility. |
| Debt level | High debt-to-assets ratio (63.23%), weak interest coverage. | Very low debt (0.28% debt-to-assets), good coverage. |
| Regulatory Risk | Moderate, US tech sector subject to evolving regulations. | Moderate, Taiwan tech sector with some geopolitical sensitivity. |
| Operational Risk | Unfavorable liquidity ratios (current and quick 0.56), operational losses. | Strong liquidity (current ratio 5.52), but lower asset turnover (0.33). |
| Environmental Risk | Typical tech industry risk, no major exposures reported. | Typical tech industry risk, no major exposures reported. |
| Geopolitical Risk | Moderate, US-based but international operations. | Elevated due to Taiwan location amid regional tensions. |
The most impactful risks are Domo’s high leverage and weak liquidity, which place it in financial distress with a very weak Piotroski score, signaling caution for investors. Perfect Corp., while financially more stable with low debt and better scores, faces geopolitical risk that could affect operations in Taiwan. Both companies require careful monitoring, but Domo’s financial distress is the more immediate concern.
Which Stock to Choose?
Domo, Inc. has shown a mixed income evolution with a slight recent revenue decline but favorable long-term growth. Its financial ratios are balanced, showing strengths in ROE (46.23%) and ROIC (194.73%) but weaknesses in liquidity and debt metrics. Profitability remains challenged with negative net margins and unfavorable interest coverage, yet the company holds a very favorable rating and a very favorable moat due to durable competitive advantages.
Perfect Corp. experienced favorable income growth and profitability improvements, with a positive net margin of 8.34% and gross margin near 78%. However, financial ratios are slightly unfavorable overall, with moderate ROE and negative ROIC, though liquidity and debt positions are strong. Its rating is very favorable, supported by a slightly unfavorable moat status indicating growing but still suboptimal capital efficiency.
Analytically, investors focused on strong economic moats and profitability might find Domo, Inc. more aligned with quality investing due to its durable competitive advantage and high ROIC. Meanwhile, investors emphasizing income growth and financial stability could view Perfect Corp. as more suitable, despite its slightly unfavorable moat, given its favorable income statement trends and solid liquidity. The choice might appear contingent on risk tolerance and investment strategy preferences.
Disclaimer: Investment carries a risk of loss of initial capital. The past performance is not a reliable indicator of future results. Be sure to understand risks before making an investment decision.
Go Further
I encourage you to read the complete analyses of Domo, Inc. and Perfect Corp. to enhance your investment decisions: