In the dynamic software application industry, Paycom Software, Inc. (PAYC) and Domo, Inc. (DOMO) stand out as innovators with distinct approaches to cloud-based solutions. Paycom focuses on comprehensive human capital management for businesses, while Domo specializes in real-time business intelligence platforms. Their market overlap and innovation strategies make them compelling candidates for comparison. Join me as we analyze which company offers the most promising investment opportunity in 2026.

Table of contents
Companies Overview
I will begin the comparison between Paycom Software, Inc. and Domo, Inc. by providing an overview of these two companies and their main differences.
Paycom Software, Inc. Overview
Paycom Software, Inc. provides cloud-based human capital management (HCM) solutions delivered as software-as-a-service for small to mid-sized U.S. companies. Its platform covers the entire employment life cycle, including talent acquisition, time and labor management, payroll, and talent management applications. Founded in 1998 and headquartered in Oklahoma City, Paycom serves a broad range of HR needs with integrated analytics and compliance tools.
Domo, Inc. Overview
Domo, Inc. operates a cloud-based business intelligence platform that connects executives to frontline employees with real-time data and insights. Its platform enables organizations across the U.S., Japan, and internationally to manage business via smartphones. Founded in 2010 and based in American Fork, Utah, Domo focuses on digital connectivity and data transparency to enhance decision-making across enterprises.
Key similarities and differences
Both companies operate in the software application industry with cloud-based platforms targeting business efficiency. Paycom specializes in human capital management for HR processes, while Domo focuses on business intelligence and data visualization solutions. Paycom serves mostly U.S. small to mid-sized businesses with a comprehensive HR suite, whereas Domo offers global data connectivity aimed at broad organizational management.
Income Statement Comparison
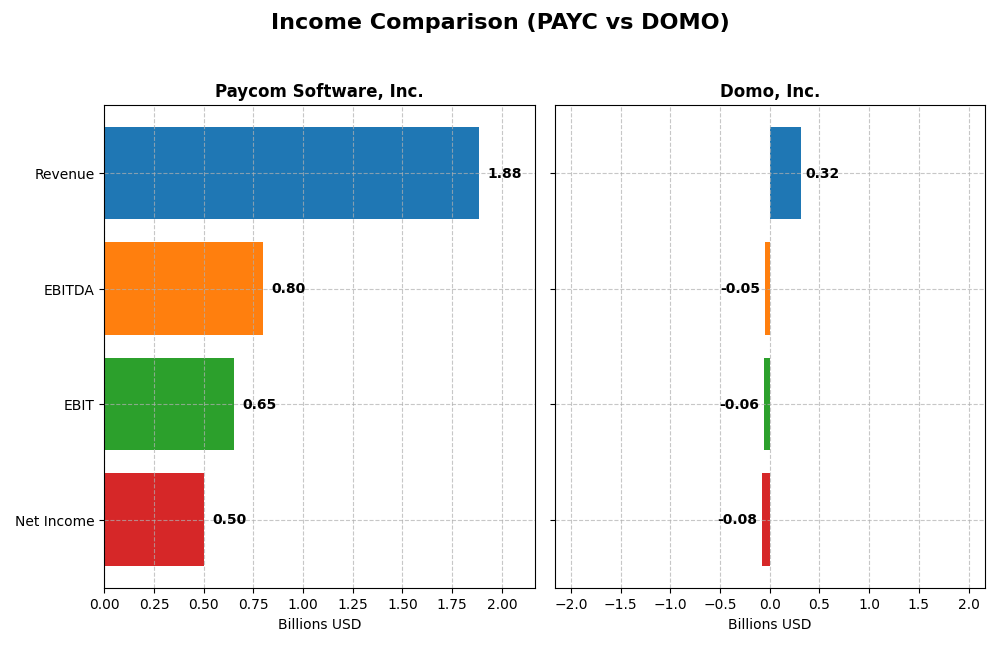
The table below compares the key income statement metrics for Paycom Software, Inc. and Domo, Inc. for their most recent fiscal years, providing a clear view of their financial performance.
| Metric | Paycom Software, Inc. (PAYC) | Domo, Inc. (DOMO) |
|---|---|---|
| Market Cap | 8.35B | 257M |
| Revenue | 1.88B | 318M |
| EBITDA | 798M | -50M |
| EBIT | 652M | -59M |
| Net Income | 502M | -82M |
| EPS | 8.93 | -2.13 |
| Fiscal Year | 2024 | 2025 |
Income Statement Interpretations
Paycom Software, Inc.
Paycom has demonstrated strong revenue growth from 2020 to 2024, increasing from 841M to 1.88B, with net income rising from 143M to 502M. Margins have improved steadily, with a gross margin of 82.23% and net margin of 26.66% in 2024. The latest year shows favorable growth in revenue (+11.2%) and net income (+47.3%), supported by expanding profitability.
Domo, Inc.
Domo’s revenue increased from 210M in 2021 to 317M in 2025, but net income remained negative, at -82M in 2025. Gross margin is favorable at 74.45%, yet EBIT and net margins are negative (-18.7% and -25.8%, respectively). The most recent year saw a slight revenue decline (-0.6%) and worsening net losses, indicating ongoing challenges in profitability.
Which one has the stronger fundamentals?
Paycom exhibits stronger fundamentals, highlighted by consistent revenue and net income growth, high and improving margins, and positive earnings. In contrast, Domo shows unfavorable profitability metrics and recent declines, despite revenue growth over the overall period. The favorable margin profile and earnings growth clearly favor Paycom’s financial stability and operational efficiency.
Financial Ratios Comparison
The table below presents a side-by-side comparison of key financial ratios for Paycom Software, Inc. (PAYC) and Domo, Inc. (DOMO) based on their most recent fiscal year data.
| Ratios | Paycom Software, Inc. (PAYC) | Domo, Inc. (DOMO) |
|---|---|---|
| ROE | 31.85% | 46.23% |
| ROIC | 24.86% | 194.73% |
| P/E | 22.95 | -3.98 |
| P/B | 7.31 | -1.84 |
| Current Ratio | 1.10 | 0.56 |
| Quick Ratio | 1.10 | 0.56 |
| D/E | 0.05 | -0.76 |
| Debt-to-Assets | 1.42% | 63.23% |
| Interest Coverage | 186.56 | -2.99 |
| Asset Turnover | 0.32 | 1.48 |
| Fixed Asset Turnover | 2.93 | 8.17 |
| Payout ratio | 16.89% | 0% |
| Dividend yield | 0.74% | 0% |
Interpretation of the Ratios
Paycom Software, Inc.
Paycom shows predominantly favorable financial ratios, with strong net margin at 26.66% and impressive return on equity of 31.85%, indicating solid profitability and efficient equity use. However, a high price-to-book ratio of 7.31 and low dividend yield of 0.74% suggest valuation concerns and limited income returns. The company pays dividends with a cautious payout supported by free cash flow, reducing risk of unsustainable distributions.
Domo, Inc.
Domo’s ratios present a mixed picture, with a negative net margin of -25.84% and weak liquidity ratios (current and quick at 0.56), highlighting operational and financial challenges. Yet, it boasts strong returns on equity (46.23%) and invested capital (194.73%), reflecting growth potential. The company does not pay dividends, likely due to negative earnings and a focus on reinvestment and R&D to support future expansion.
Which one has the best ratios?
Paycom exhibits a more balanced and favorable ratio profile overall, with strong profitability and solid risk metrics, despite some valuation concerns. Domo’s mixed ratios show potential in returns but are offset by significant operational losses and liquidity weaknesses. Thus, Paycom’s financial ratios are generally stronger and more stable compared to Domo’s.
Strategic Positioning
This section compares the strategic positioning of Paycom Software, Inc. and Domo, Inc., focusing on market position, key segments, and exposure to technological disruption:
Paycom Software, Inc.
- Leading HCM SaaS provider serving small to mid-sized U.S. companies with 8.3B market cap, moderate beta (0.824).
- Revenue driven by recurring HCM software subscriptions, plus implementation services; total recurring revenue ~1.7B in 2024.
- Proprietary HCM tools with focus on employment lifecycle management; limited direct information on disruption exposure.
Domo, Inc.
- Operates cloud-based business intelligence platform globally, smaller 257M market cap, higher beta (1.65).
- Revenue mainly from subscription BI platform and professional services, subscription revenue ~286M in 2025.
- Cloud BI platform connecting all employee levels with real-time data; no explicit technological disruption details provided.
Paycom Software, Inc. vs Domo, Inc. Positioning
Paycom emphasizes a concentrated focus on cloud-based HCM solutions for U.S. mid-sized companies with strong recurring revenue, while Domo pursues a broader, global BI platform approach with smaller scale. Paycom’s positioning benefits from scale and specialization; Domo offers a more diversified geographic reach but at a smaller market size.
Which has the best competitive advantage?
Both companies show very favorable MOAT status with growing ROIC well above WACC, indicating durable competitive advantages. Paycom’s larger scale and specialized HCM focus contrast with Domo’s smaller scale but strong BI platform growth, reflecting different but effective competitive moats.
Stock Comparison
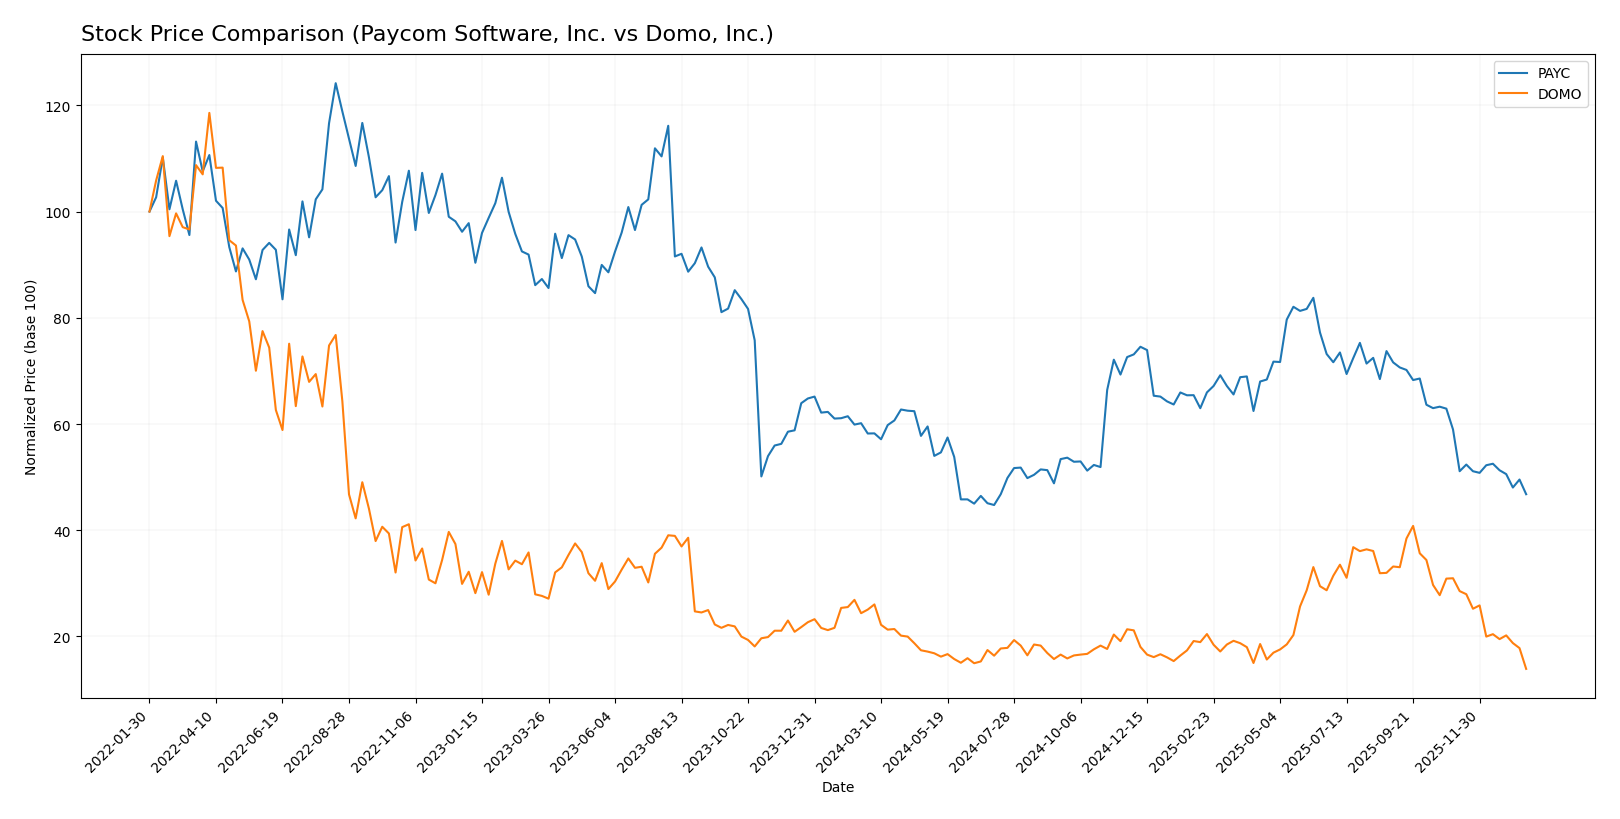
The stock prices of Paycom Software, Inc. (PAYC) and Domo, Inc. (DOMO) have shown notable declines over the past 12 months, with both experiencing bearish trends and varying degrees of deceleration in price movement.
Trend Analysis
Paycom Software, Inc. (PAYC) exhibited a bearish trend over the past year, with a price decline of 19.64%. The trend showed deceleration, a high volatility level with a 31.92 std deviation, and prices ranging between 265.71 and 141.96.
Domo, Inc. (DOMO) also experienced a bearish trend over the same 12-month period, with a more pronounced price drop of 44.54%. Its trend decelerated with lower volatility, a 3.01 std deviation, and prices fluctuating between 18.06 and 6.15.
Comparing the two, both stocks declined, but DOMO’s price fell more steeply, delivering a weaker market performance than PAYC over the past year.
Target Prices
Here is the current target price consensus from reliable analysts for the selected companies:
| Company | Target High | Target Low | Consensus |
|---|---|---|---|
| Paycom Software, Inc. | 290 | 165 | 215 |
| Domo, Inc. | 13 | 10 | 11.5 |
Analysts expect Paycom Software’s stock to appreciate significantly from its current price of $148.41, while Domo, Inc. shows moderate upside potential from $6.15. Overall, the target consensus indicates bullish sentiment for both stocks.
Analyst Opinions Comparison
This section compares analysts’ ratings and scores for Paycom Software, Inc. and Domo, Inc.:
Rating Comparison
PAYC Rating
- Rating: A, indicating a very favorable assessment of financial standing.
- Discounted Cash Flow Score: 5, very favorable, suggesting strong future cash flow projections.
- ROE Score: 5, very favorable, showing efficient profit generation from shareholders’ equity.
- ROA Score: 5, very favorable, reflecting effective asset utilization.
- Debt To Equity Score: 4, favorable, implying manageable financial risk.
- Overall Score: 4, favorable, summarizing strong financial health.
DOMO Rating
- Rating: C, indicating a very favorable assessment despite a lower letter grade.
- Discounted Cash Flow Score: 1, very unfavorable, indicating weak future cash flow projections.
- ROE Score: 5, very favorable, showing efficient profit generation from shareholders’ equity.
- ROA Score: 1, very unfavorable, indicating poor asset utilization.
- Debt To Equity Score: 1, very unfavorable, indicating higher financial risk.
- Overall Score: 2, moderate, reflecting weaker overall financial performance.
Which one is the best rated?
Based strictly on the provided data, Paycom Software, Inc. is better rated overall, with higher scores in discounted cash flow, ROA, debt-to-equity, and overall score. Domo, Inc. only matches Paycom’s ROE score but trails significantly elsewhere.
Scores Comparison
Here is a comparison of the Altman Z-Score and Piotroski Score for Paycom Software, Inc. and Domo, Inc.:
Paycom Software, Inc. Scores
- Altman Z-Score: 3.84, indicating a safe zone with low bankruptcy risk.
- Piotroski Score: 5, reflecting average financial strength.
Domo, Inc. Scores
- Altman Z-Score: -10.10, indicating distress zone with high bankruptcy risk.
- Piotroski Score: 3, reflecting very weak financial strength.
Which company has the best scores?
Paycom Software, Inc. shows a strong Altman Z-Score in the safe zone and an average Piotroski Score, while Domo, Inc. has a distress zone Altman Z-Score and a very weak Piotroski Score, indicating weaker financial health overall.
Grades Comparison
The following is a comparison of recent grades from reputable grading companies for Paycom Software, Inc. and Domo, Inc.:
Paycom Software, Inc. Grades
This table summarizes recent grades assigned to Paycom Software, Inc. by established financial institutions.
| Grading Company | Action | New Grade | Date |
|---|---|---|---|
| Barclays | Maintain | Equal Weight | 2026-01-12 |
| TD Cowen | Maintain | Buy | 2026-01-08 |
| Citigroup | Maintain | Neutral | 2025-12-23 |
| Keybanc | Maintain | Overweight | 2025-11-06 |
| TD Cowen | Maintain | Buy | 2025-11-06 |
| UBS | Maintain | Buy | 2025-11-06 |
| Jefferies | Maintain | Hold | 2025-11-06 |
| JP Morgan | Maintain | Neutral | 2025-11-06 |
| Mizuho | Maintain | Neutral | 2025-11-06 |
| Barclays | Maintain | Equal Weight | 2025-11-06 |
Paycom’s grades show a consistent pattern of “Buy,” “Hold,” and “Neutral” ratings, with no recent upgrades or downgrades.
Domo, Inc. Grades
This table summarizes recent grades assigned to Domo, Inc. by established financial institutions.
| Grading Company | Action | New Grade | Date |
|---|---|---|---|
| DA Davidson | Maintain | Neutral | 2025-12-05 |
| TD Cowen | Maintain | Buy | 2025-12-05 |
| Lake Street | Maintain | Hold | 2025-12-05 |
| DA Davidson | Maintain | Neutral | 2025-12-01 |
| JMP Securities | Maintain | Market Outperform | 2025-09-10 |
| DA Davidson | Maintain | Neutral | 2025-08-28 |
| Cantor Fitzgerald | Maintain | Overweight | 2025-08-28 |
| TD Cowen | Upgrade | Buy | 2025-08-26 |
| JMP Securities | Maintain | Market Outperform | 2025-06-25 |
| Cantor Fitzgerald | Maintain | Overweight | 2025-06-25 |
Domo’s grades indicate a stronger bias toward positive ratings, including “Buy,” “Overweight,” and “Market Outperform” with an upgrade noted by TD Cowen.
Which company has the best grades?
Domo, Inc. holds comparatively stronger grades, including multiple “Buy” and “Market Outperform” ratings, while Paycom Software, Inc. mostly receives “Hold” and “Neutral” ratings. This suggests Domo may be viewed more favorably by analysts, potentially impacting investor confidence and sentiment.
Strengths and Weaknesses
Below is a comparison table highlighting key strengths and weaknesses of Paycom Software, Inc. (PAYC) and Domo, Inc. (DOMO) based on their latest financial and operational data.
| Criterion | Paycom Software, Inc. (PAYC) | Domo, Inc. (DOMO) |
|---|---|---|
| Diversification | Primarily focused on HR and payroll software; strong recurring revenue (1.73B in 2024) | Focused on business intelligence and data visualization; subscription revenues growing steadily (286M in 2025) |
| Profitability | High net margin (26.66%), strong ROIC (24.86%), favorable debt management | Negative net margin (-25.84%), but high ROIC (194.73%) and ROE (46.23%); struggles with debt and liquidity ratios |
| Innovation | Consistent investment in product improvements; durable competitive advantage with growing ROIC | High innovation reflected in rapid ROIC growth; however, profitability and cash flow remain challenging |
| Global presence | Expanding presence, but primarily North America focused | Expanding internationally but limited scale compared to competitors |
| Market Share | Strong position in HR/payroll niche with high recurring revenue | Smaller market share in BI sector but growing subscription base |
Key takeaways: Paycom demonstrates stable profitability and a durable competitive advantage with manageable debt and strong recurring revenues, making it a lower-risk investment. Domo shows impressive ROIC growth and innovation, but its negative margins and liquidity issues suggest higher risk, calling for cautious consideration.
Risk Analysis
Below is a summary table highlighting key risk factors for Paycom Software, Inc. (PAYC) and Domo, Inc. (DOMO) based on their latest fiscal data.
| Metric | Paycom Software, Inc. (PAYC) | Domo, Inc. (DOMO) |
|---|---|---|
| Market Risk | Beta 0.82 (low volatility) | Beta 1.65 (high volatility) |
| Debt level | Very low debt (D/E 0.05) | High debt (D/E negative but Debt/Assets 63%) |
| Regulatory Risk | Moderate (US SaaS sector) | Moderate (US & international BI platform) |
| Operational Risk | Low (robust SaaS HCM platform) | Moderate (smaller scale, 888 employees) |
| Environmental Risk | Low (software sector) | Low (software sector) |
| Geopolitical Risk | Limited (US focus) | Moderate (US & Japan presence) |
The most likely and impactful risks center on market volatility and financial leverage. PAYC benefits from low volatility and very conservative debt, reducing financial distress risk. In contrast, DOMO shows high volatility and elevated debt levels, with an Altman Z-Score in the distress zone, signaling bankruptcy risk. Investors should weigh PAYC’s stable financial health against DOMO’s riskier profile and operational challenges.
Which Stock to Choose?
Paycom Software, Inc. (PAYC) shows a favorable income evolution with consistent revenue and net margin growth, strong profitability, low debt levels, and an overall very favorable rating. Its financial ratios indicate a solid balance sheet and effective capital use, supported by a very favorable moat status.
Domo, Inc. (DOMO) presents a less favorable income statement with negative net margins and declining recent revenue, despite a very favorable moat evaluation. Its financial ratios reflect mixed results with significant debt concerns and a moderate overall rating, indicating financial instability and operational challenges.
For investors, PAYC might appear more suitable for those prioritizing stability, strong financial health, and consistent profitability, while DOMO could be interpreted as appealing to risk-tolerant investors seeking potential growth amid financial volatility. The choice could depend significantly on individual risk appetite and investment strategy.
Disclaimer: Investment carries a risk of loss of initial capital. The past performance is not a reliable indicator of future results. Be sure to understand risks before making an investment decision.
Go Further
I encourage you to read the complete analyses of Paycom Software, Inc. and Domo, Inc. to enhance your investment decisions: