In the fast-evolving software application industry, monday.com Ltd. and Domo, Inc. stand out as dynamic players offering innovative cloud-based platforms. Both companies target business management solutions but differ in scale, approach, and market reach. Comparing these firms is essential to understand which has stronger growth potential and innovation strategy. Join me as we analyze their strengths and challenges to identify the more compelling investment opportunity.
Table of contents
Companies Overview
I will begin the comparison between monday.com Ltd. and Domo, Inc. by providing an overview of these two companies and their main differences.
monday.com Ltd. Overview
monday.com Ltd. develops cloud-based Work OS software applications, offering modular building blocks to create work management tools and solutions for marketing, CRM, project management, and software development. The company serves organizations across various sectors worldwide and is headquartered in Tel Aviv, Israel. It operates within the software application industry with a market cap of approximately 6.5B USD.
Domo, Inc. Overview
Domo, Inc. operates a cloud-based business intelligence platform that connects all organizational levels with real-time data accessible via smartphones. The company focuses on enabling business management through its platform across the US, Japan, and other regions. Based in American Fork, Utah, Domo is part of the software application industry and has a market cap of roughly 257M USD.
Key similarities and differences
Both monday.com and Domo operate in the software application sector, providing cloud-based platforms aimed at enhancing business operations through data and workflow management. monday.com emphasizes modular work operating systems for diverse business functions, while Domo specializes in business intelligence and data connectivity. They differ significantly in scale, with monday.com having a considerably larger market capitalization and workforce compared to Domo.
Income Statement Comparison
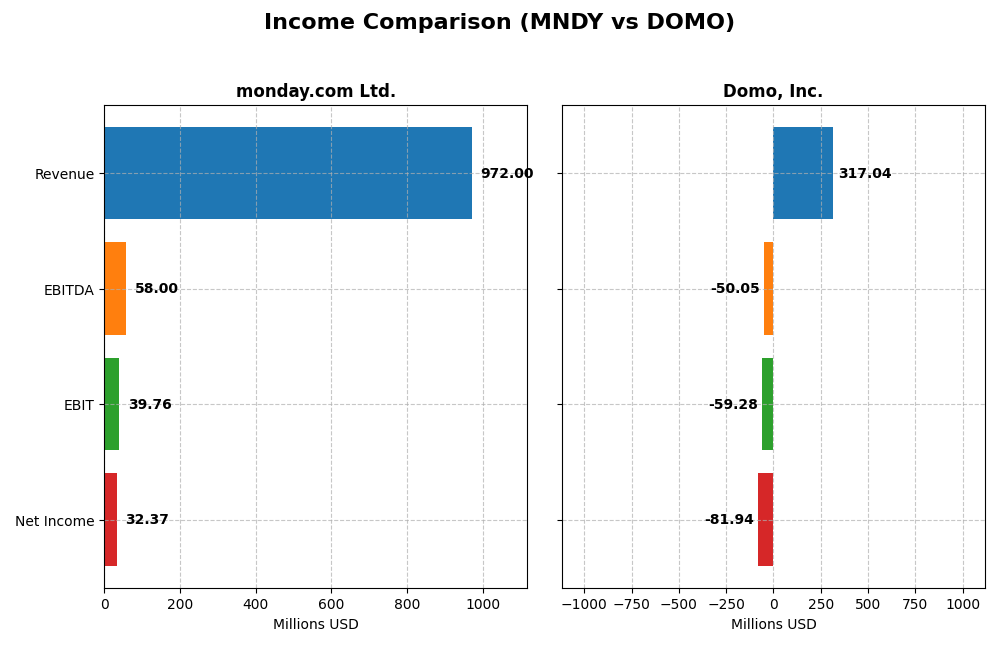
The table below compares key income statement metrics for monday.com Ltd. and Domo, Inc. for their most recent fiscal years, illustrating their financial performance.
| Metric | monday.com Ltd. (MNDY) | Domo, Inc. (DOMO) |
|---|---|---|
| Market Cap | 6.53B | 257M |
| Revenue | 972M | 317M |
| EBITDA | 58M | -50M |
| EBIT | 40M | -59M |
| Net Income | 32M | -82M |
| EPS | 0.65 | -2.13 |
| Fiscal Year | 2024 | 2025 |
Income Statement Interpretations
monday.com Ltd.
monday.com Ltd. has exhibited strong growth from 2020 to 2024, with revenue increasing from $161M to nearly $972M and net income turning positive at $32M in 2024 after several loss-making years. Gross margin remains robust at 89.33%, indicating efficient cost management, while net margin at 3.33% shows improving profitability. The 2024 year marked significant margin expansion and a substantial increase in net income.
Domo, Inc.
Domo, Inc. showed revenue growth from $210M in 2021 to $317M in 2025 but experienced a slight decline in the latest year. Despite favorable gross margin at 74.45%, the company struggled with persistent net losses, posting a net income of -$82M in 2025 and a negative net margin of -25.84%. Operating and net margins deteriorated further in the most recent year, reflecting ongoing profitability challenges.
Which one has the stronger fundamentals?
Based on the income statement analysis, monday.com Ltd. demonstrates stronger fundamentals with favorable growth in revenue, gross profit, and net income, along with improved margins in the latest year. In contrast, Domo, Inc. faces unfavorable trends in profitability and margin contraction despite revenue growth, resulting in an overall unfavorable income statement assessment.
Financial Ratios Comparison
The following table compares key financial ratios of monday.com Ltd. and Domo, Inc. for their most recent fiscal years, offering a snapshot of their profitability, liquidity, leverage, and efficiency metrics.
| Ratios | monday.com Ltd. (2024) | Domo, Inc. (2025) |
|---|---|---|
| ROE | 3.14% | 46.23% |
| ROIC | -1.73% | 194.73% |
| P/E | 363 | -3.98 |
| P/B | 11.41 | -1.84 |
| Current Ratio | 2.66 | 0.56 |
| Quick Ratio | 2.66 | 0.56 |
| D/E (Debt-to-Equity) | 0.10 | -0.76 |
| Debt-to-Assets | 6.29% | 63.23% |
| Interest Coverage | 0 | -2.99 |
| Asset Turnover | 0.58 | 1.48 |
| Fixed Asset Turnover | 7.13 | 8.17 |
| Payout ratio | 0 | 0 |
| Dividend yield | 0 | 0 |
Interpretation of the Ratios
monday.com Ltd.
monday.com Ltd. displays a mixed ratio profile with several unfavorable metrics including low net margin at 3.33%, weak return on equity at 3.14%, and negative return on invested capital at -1.73%. However, it benefits from strong liquidity with a current ratio of 2.66 and low debt levels. The company does not pay dividends, likely prioritizing reinvestment and growth given its financial structure.
Domo, Inc.
Domo, Inc. shows varied performance with favorable returns: a high return on equity of 46.23% and an exceptionally strong return on invested capital at 194.73%. Yet, it faces challenges including a negative net margin of -25.84%, weak liquidity with a current ratio of 0.56, and high debt-to-assets ratio of 63.23%. Domo does not distribute dividends, reflecting its focus on growth and capital allocation.
Which one has the best ratios?
Both companies have a balanced mix of favorable and unfavorable financial ratios, leading to a neutral overall assessment. monday.com Ltd. demonstrates better liquidity and lower leverage, while Domo excels in returns on equity and invested capital but struggles with profitability and liquidity. Neither company pays dividends, emphasizing reinvestment over shareholder payouts.
Strategic Positioning
This section compares the strategic positioning of monday.com Ltd. and Domo, Inc. across Market position, Key segments, and Exposure to technological disruption:
monday.com Ltd.
- Larger market cap of 6.5B, facing industry competition in application software sector.
- Offers Work OS with modular software for project management, marketing, CRM, serving diverse clients.
- No explicit data on technological disruption exposure provided.
Domo, Inc.
- Smaller market cap of 257M, operating in a competitive cloud-based business intelligence market.
- Focuses on cloud BI platform with subscription and professional services revenues driving growth.
- No explicit data on technological disruption exposure provided.
monday.com Ltd. vs Domo, Inc. Positioning
monday.com Ltd. has a diversified product portfolio serving various business functions globally, while Domo concentrates on cloud BI with subscription focus. monday.com’s broader client base contrasts with Domo’s specialization, reflecting different strategic scopes and growth drivers.
Which has the best competitive advantage?
Based on MOAT evaluation, Domo, Inc. shows a very favorable position with strong ROIC above WACC and growing profitability, indicating a durable competitive advantage. monday.com Ltd. has a slightly unfavorable MOAT, shedding value despite improving ROIC.
Stock Comparison
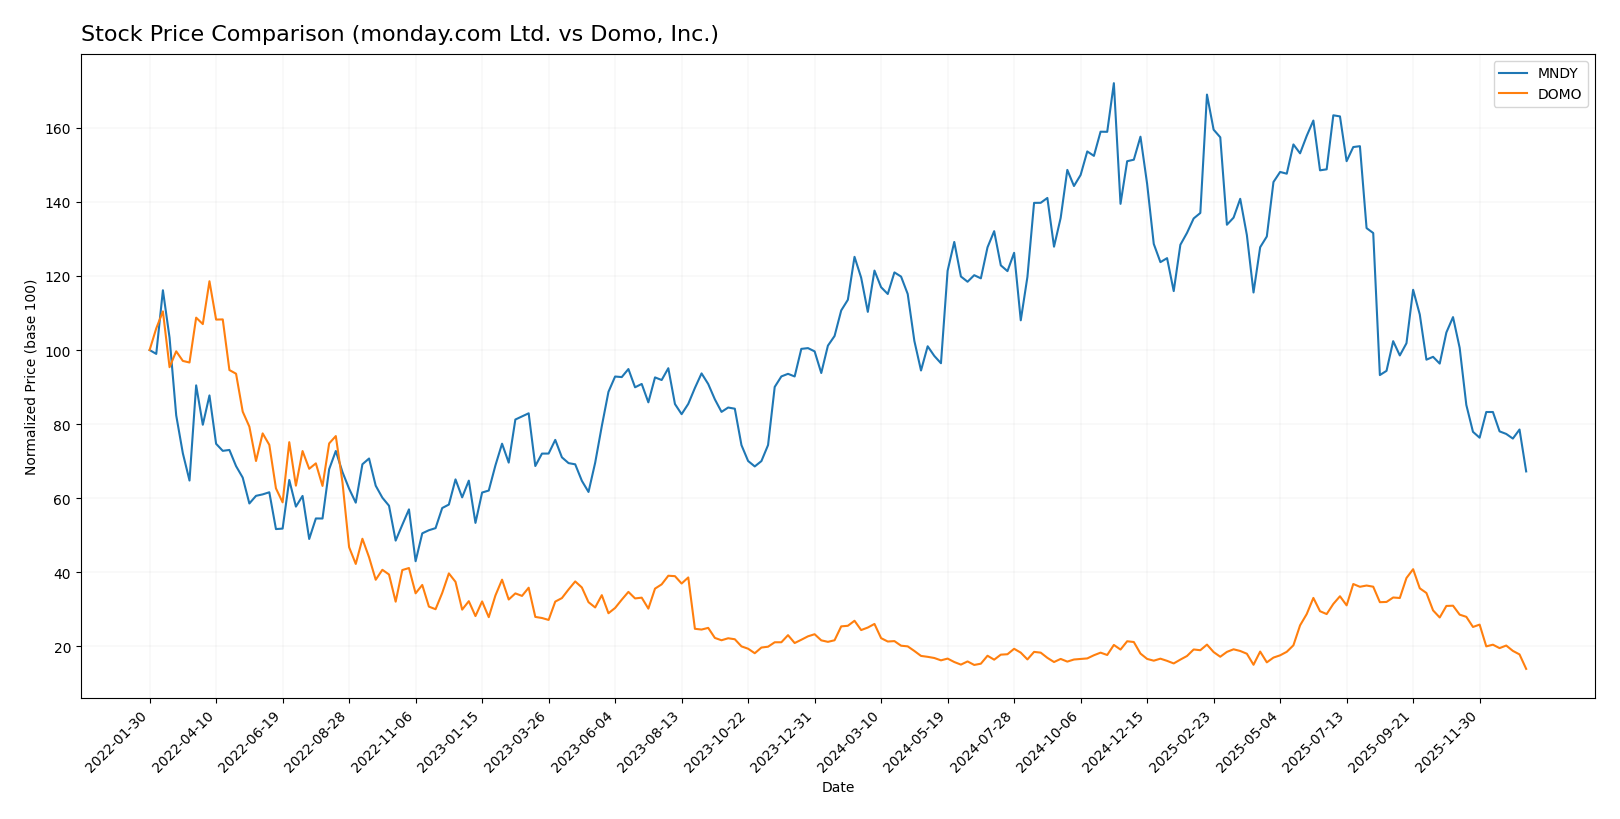
The stock prices of monday.com Ltd. (MNDY) and Domo, Inc. (DOMO) have both experienced significant declines over the past 12 months, reflecting bearish trends with decelerating momentum and differing volatility profiles.
Trend Analysis
monday.com Ltd. (MNDY) shows a bearish trend with a -39.06% price change over the past year, accompanied by high volatility (std deviation 47.32) and deceleration in downward momentum. The stock ranged from 324.31 to 126.7.
Domo, Inc. (DOMO) also exhibits a bearish trend with a steeper -44.54% price decline and lower volatility (std deviation 3.01). The trend decelerated, with prices fluctuating between 18.06 and 6.15 over the same period.
Comparatively, both stocks declined sharply, but MNDY outperformed DOMO by a smaller margin, delivering the highest market performance in terms of price retention.
Target Prices
The consensus target prices reflect cautious optimism from analysts for both monday.com Ltd. and Domo, Inc.
| Company | Target High | Target Low | Consensus |
|---|---|---|---|
| monday.com Ltd. | 330 | 194 | 264.42 |
| Domo, Inc. | 13 | 10 | 11.5 |
Analysts expect monday.com’s stock to more than double from its current price of 126.7 USD, indicating strong growth potential. Domo’s target consensus at 11.5 USD also suggests upside from its present 6.15 USD price, reflecting moderate confidence.
Analyst Opinions Comparison
This section compares analysts’ ratings and grades for monday.com Ltd. and Domo, Inc.:
Rating Comparison
monday.com Ltd. Rating
- Rating: B- indicating a very favorable assessment.
- Discounted Cash Flow Score: 4, favorable valuation outlook.
- ROE Score: 3, moderate efficiency in generating equity returns.
- ROA Score: 3, moderate asset utilization effectiveness.
- Debt To Equity Score: 3, moderate financial risk.
- Overall Score: 3, moderate overall financial standing.
Domo, Inc. Rating
- Rating: C indicating a very favorable assessment.
- Discounted Cash Flow Score: 1, very unfavorable valuation.
- ROE Score: 5, very favorable profitability on equity.
- ROA Score: 1, very unfavorable asset utilization.
- Debt To Equity Score: 1, very unfavorable financial risk.
- Overall Score: 2, moderate overall financial standing.
Which one is the best rated?
Based on the provided data, monday.com Ltd. holds a better overall rating (B-) and stronger valuation metrics, while Domo, Inc. excels in return on equity but scores poorly on valuation and financial risk measures.
Scores Comparison
Here is a comparison of the Altman Z-Score and Piotroski Score for monday.com Ltd. and Domo, Inc.:
monday.com Ltd. Scores
- Altman Z-Score: 6.33, indicating a safe zone with low bankruptcy risk.
- Piotroski Score: 5, categorized as average financial strength.
Domo, Inc. Scores
- Altman Z-Score: -10.10, in distress zone indicating high bankruptcy risk.
- Piotroski Score: 3, considered very weak financial strength.
Which company has the best scores?
Based on the data, monday.com Ltd. shows a strong Altman Z-Score in the safe zone and an average Piotroski Score, whereas Domo, Inc. is in the distress zone with a very weak Piotroski Score. Thus, monday.com Ltd. has better financial scores.
Grades Comparison
Here is a comparison of the most recent reliable grades for monday.com Ltd. and Domo, Inc.:
monday.com Ltd. Grades
This table summarizes the latest analyst grades for monday.com Ltd. from reputable firms.
| Grading Company | Action | New Grade | Date |
|---|---|---|---|
| BTIG | Maintain | Buy | 2026-01-15 |
| Barclays | Maintain | Overweight | 2026-01-12 |
| Jefferies | Maintain | Buy | 2026-01-05 |
| Citigroup | Maintain | Buy | 2025-12-23 |
| Tigress Financial | Maintain | Buy | 2025-12-11 |
| Baird | Maintain | Outperform | 2025-11-11 |
| Wells Fargo | Maintain | Overweight | 2025-11-11 |
| DA Davidson | Maintain | Buy | 2025-11-11 |
| Morgan Stanley | Maintain | Overweight | 2025-11-11 |
| Piper Sandler | Maintain | Overweight | 2025-11-11 |
Overall, monday.com Ltd. has consistently maintained positive grades, predominantly Buy and Overweight ratings, indicating a stable optimistic consensus among analysts.
Domo, Inc. Grades
Below is a summary of recent analyst grades for Domo, Inc. from established grading companies.
| Grading Company | Action | New Grade | Date |
|---|---|---|---|
| DA Davidson | Maintain | Neutral | 2025-12-05 |
| TD Cowen | Maintain | Buy | 2025-12-05 |
| Lake Street | Maintain | Hold | 2025-12-05 |
| DA Davidson | Maintain | Neutral | 2025-12-01 |
| JMP Securities | Maintain | Market Outperform | 2025-09-10 |
| DA Davidson | Maintain | Neutral | 2025-08-28 |
| Cantor Fitzgerald | Maintain | Overweight | 2025-08-28 |
| TD Cowen | Upgrade | Buy | 2025-08-26 |
| JMP Securities | Maintain | Market Outperform | 2025-06-25 |
| Cantor Fitzgerald | Maintain | Overweight | 2025-06-25 |
Domo, Inc. shows a broader range of ratings from Neutral to Market Outperform, with several upgrades to Buy, reflecting a cautiously optimistic but more mixed analyst sentiment.
Which company has the best grades?
monday.com Ltd. has received more consistently positive grades, mostly Buy and Overweight, compared to Domo, Inc., which presents a wider spread including Neutral and Hold ratings. Investors may interpret monday.com’s stronger grade consensus as a signal of greater analyst confidence.
Strengths and Weaknesses
Below is a comparison of key strengths and weaknesses for monday.com Ltd. (MNDY) and Domo, Inc. (DOMO) based on their recent financial and operational data.
| Criterion | monday.com Ltd. (MNDY) | Domo, Inc. (DOMO) |
|---|---|---|
| Diversification | Limited product segmentation; mainly workflow management platform | Revenue primarily from subscriptions (286M in 2025) and some professional services (31M in 2025) |
| Profitability | Low net margin (3.33%), ROIC negative (-1.73%), shedding value | Negative net margin (-25.84%) but very high ROIC (194.73%), creating value |
| Innovation | Moderate, indicated by growing ROIC trend but high valuation multiples (PE 363) | Strong innovation with durable moat and increasing profitability |
| Global presence | Moderate, no specific data but typical SaaS global reach | Likely global, supported by strong subscription growth |
| Market Share | Growing but financial efficiency concerns | Increasing market share supported by strong revenue growth |
Key takeaways: monday.com shows growing profitability but still struggles with value creation and high valuation, suggesting caution. Domo, despite current losses, demonstrates strong value creation, innovation, and expanding subscription revenues, indicating a robust competitive position. Investors should weigh risk tolerance accordingly.
Risk Analysis
Below is a comparative table highlighting key risks for monday.com Ltd. (MNDY) and Domo, Inc. (DOMO) based on the most recent data available in 2026:
| Metric | monday.com Ltd. (MNDY) | Domo, Inc. (DOMO) |
|---|---|---|
| Market Risk | Moderate (Beta 1.255) | High (Beta 1.65) |
| Debt level | Low (Debt/Assets 6.29%) | High (Debt/Assets 63.23%) |
| Regulatory Risk | Moderate (Israel & US) | Moderate (US focus) |
| Operational Risk | Moderate (2500+ employees, global ops) | Higher (Smaller scale, 888 employees) |
| Environmental Risk | Low to Moderate | Low to Moderate |
| Geopolitical Risk | Moderate (Israel base) | Low (US base) |
The highest risks lie in market volatility and debt exposure. Domo’s elevated debt level (63.23% debt-to-assets) and negative interest coverage ratio indicate significant financial risk, while monday.com maintains a conservative debt profile with strong liquidity. Geopolitical risk is more pertinent for monday.com due to its Israeli headquarters. Investors should weigh Domo’s operational and financial leverage risks against monday.com’s high valuation multiples and moderate market risk.
Which Stock to Choose?
monday.com Ltd. (MNDY) shows strong income growth with a 33.21% revenue increase in 2024 and favorable gross margin at 89.33%. Its financial ratios are mixed, with 42.86% favorable and 42.86% unfavorable, reflecting moderate profitability and low debt. The company is slightly value-destroying but improving, holding a very favorable B- rating.
Domo, Inc. (DOMO) experiences a slight revenue decline of -0.61% in 2025 and an unfavorable net margin of -25.84%. Its financial ratios split evenly between favorable and unfavorable, indicating volatility with high ROE but weak liquidity and significant debt. DOMO is a value-creating firm with a very favorable C rating but scores low on financial stability.
Investors seeking growth might view monday.com’s favorable income trends and improving profitability as appealing, while those willing to accept higher risk for potential value creation could find Domo’s strong ROE and ROIC indicative of competitive advantage. Both stocks present neutral global ratio evaluations, suggesting a choice dependent on risk tolerance and investment strategy.
Disclaimer: Investment carries a risk of loss of initial capital. The past performance is not a reliable indicator of future results. Be sure to understand risks before making an investment decision.
Go Further
I encourage you to read the complete analyses of monday.com Ltd. and Domo, Inc. to enhance your investment decisions: