Home > Comparison > Technology > MTCH vs DOMO
The strategic rivalry between Match Group, Inc. and Domo, Inc. shapes the evolution of the technology sector’s software application landscape. Match Group dominates as a global leader in consumer-facing dating platforms, while Domo operates a cloud-based business intelligence platform, serving enterprises with real-time data solutions. This analysis pits consumer engagement against enterprise analytics, aiming to identify which business model delivers superior risk-adjusted returns for a diversified portfolio in today’s dynamic tech environment.

Table of contents
Companies Overview
Match Group and Domo hold pivotal roles in the technology software sector, each driving distinct market dynamics.
Match Group, Inc.: Leader in Digital Dating Platforms
Match Group dominates the global online dating market with its portfolio of brands including Tinder and OkCupid. Its core revenue derives from subscription fees and in-app purchases, capitalizing on network effects. In 2026, the company focuses on expanding user engagement and innovating its matchmaking algorithms to sustain competitive advantage.
Domo, Inc.: Cloud-Based Business Intelligence Innovator
Domo operates a cloud-native business intelligence platform that integrates data across organizations in real time. Revenue flows from platform subscriptions enabling executives and employees to manage operations via mobile. The 2026 strategy centers on enhancing data connectivity and scaling international adoption across industries.
Strategic Collision: Similarities & Divergences
Both companies leverage software to empower user decisions but diverge sharply: Match Group cultivates a closed ecosystem of consumer brands, while Domo offers an open data infrastructure. Their primary battleground is user engagement—Match through social interaction, Domo through data-driven management. This contrast defines their unique investment profiles: consumer-driven versus enterprise-focused growth.
Income Statement Comparison
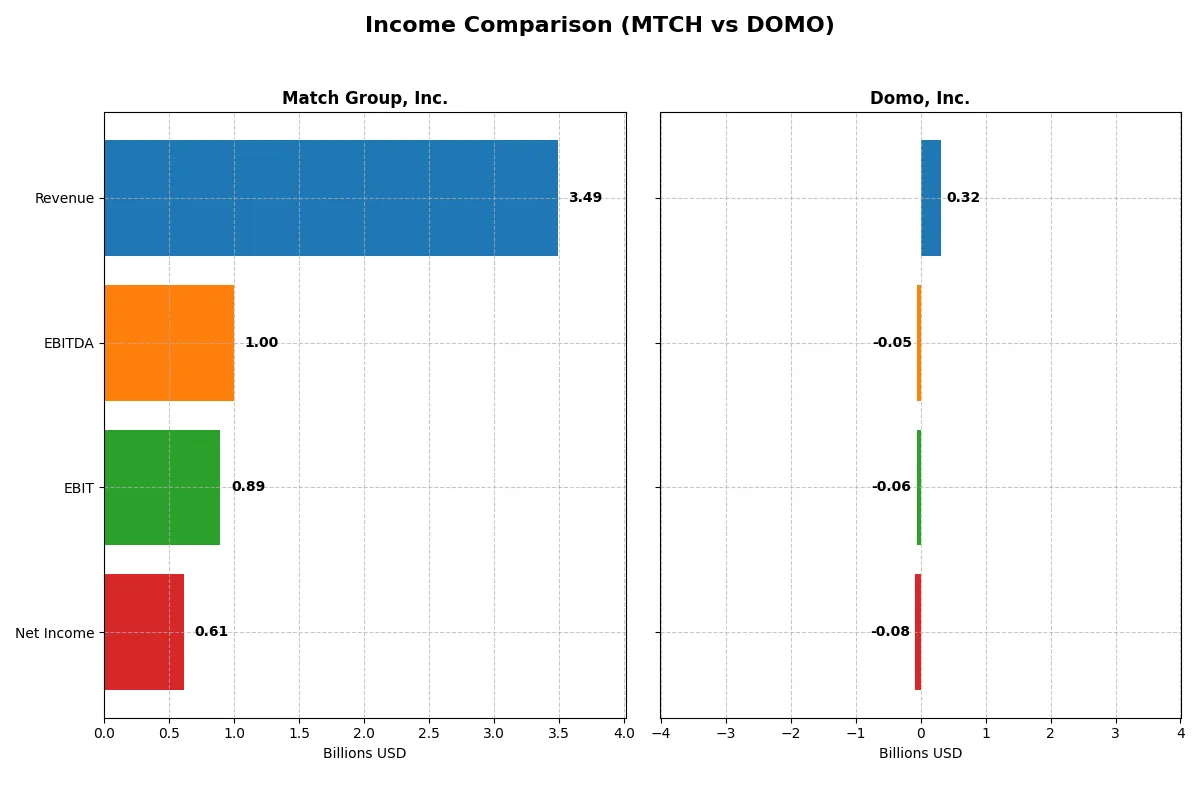
This data dissects the core profitability and scalability of both corporate engines to reveal who dominates the bottom line:
| Metric | Match Group, Inc. (MTCH) | Domo, Inc. (DOMO) |
|---|---|---|
| Revenue | 3.49B | 317M |
| Cost of Revenue | 948M | 81M |
| Operating Expenses | 1.67B | 295M |
| Gross Profit | 2.54B | 236M |
| EBITDA | 999M | -50M |
| EBIT | 894M | -59M |
| Interest Expense | 148M | 20M |
| Net Income | 613M | -82M |
| EPS | 2.53 | -2.13 |
| Fiscal Year | 2025 | 2025 |
Income Statement Analysis: The Bottom-Line Duel
This income statement comparison reveals the true efficiency and profitability of each company’s business model over recent years.
Match Group, Inc. Analysis
Match Group’s revenue steadily climbed from 3B in 2021 to nearly 3.5B in 2025, reflecting a robust 17% growth over five years. Net income surged by 121%, reaching 613M in 2025. The firm sustains strong gross margins above 72%, with net margins expanding to 17.6%, signaling efficient cost management and solid operational leverage in the latest year.
Domo, Inc. Analysis
Domo’s revenue grew 51% over five years but declined slightly by 0.6% to 317M in 2025. The company remains unprofitable, with net losses widening to -82M and net margins deepening to -25.8%. Although gross margins hold firm at 74.5%, persistent negative EBIT margins near -19% indicate ongoing struggles to control operating costs and improve profitability momentum.
Margin Strength vs. Profitability Deficit
Match Group clearly leads with strong revenue scale and consistent profit growth, demonstrating operational efficiency and margin resilience. Domo offers solid gross margins but fails to convert sales into profits, weighed down by heavy operating expenses. For investors prioritizing sustainable earnings, Match Group’s profitable profile stands out as the superior fundamental performer.
Financial Ratios Comparison
These vital ratios act as a diagnostic tool to expose the underlying fiscal health, valuation premiums, and capital efficiency of each company:
| Ratios | Match Group, Inc. (MTCH) | Domo, Inc. (DOMO) |
|---|---|---|
| ROE | -2.42% | 46.23% |
| ROIC | 22.50% | 194.73% |
| P/E | 12.77 | -3.98 |
| P/B | -30.91 | -1.84 |
| Current Ratio | 1.42 | 0.56 |
| Quick Ratio | 1.42 | 0.56 |
| D/E | -15.67 | -0.76 |
| Debt-to-Assets | 89.06% | 63.23% |
| Interest Coverage | 5.91 | -2.99 |
| Asset Turnover | 0.78 | 1.48 |
| Fixed Asset Turnover | 26.59 | 8.17 |
| Payout ratio | 30.36% | 0% |
| Dividend yield | 2.38% | 0% |
| Fiscal Year | 2025 | 2025 |
Efficiency & Valuation Duel: The Vital Signs
Financial ratios serve as a company’s DNA, unveiling hidden risks and spotlighting operational excellence.
Match Group, Inc.
Match Group posts a mixed profitability picture with a negative ROE (-242%) but a strong net margin of 17.6%. Its valuation remains attractive, with a P/E of 12.77 signaling a reasonably priced stock. The firm supports shareholder returns through a 2.38% dividend yield, reflecting steady cash generation despite leverage concerns.
Domo, Inc.
Domo shows robust ROE (46.2%) and an exceptionally high ROIC (195%), but suffers from a negative net margin (-25.8%), reflecting ongoing losses. The P/E is negative, indicating losses, while its liquidity ratios are weak (current ratio 0.56). The company does not pay dividends, focusing on reinvestment for growth and innovation.
Valuation Discipline vs. Growth Struggle
Match Group offers a better balance of valuation and operational efficiency, despite leverage risks. Domo’s high returns on capital contrast with poor profitability and liquidity. Investors seeking stability may prefer Match’s dividend profile, while those pursuing aggressive growth face Domo’s riskier financial footing.
Which one offers the Superior Shareholder Reward?
I see Match Group (MTCH) pays a 2.38% dividend with a 30% payout ratio, well-covered by free cash flow (4.22/share). Its consistent buyback program adds to total returns. Domo (DOMO) pays no dividend and burns free cash flow, focusing on growth investments. While Domo aims for growth, Match’s balanced dividends and buybacks offer a more sustainable, attractive total return profile in 2026.
Comparative Score Analysis: The Strategic Profile
The radar chart reveals the fundamental DNA and trade-offs of Match Group, Inc. and Domo, Inc., highlighting their distinct financial strengths and weaknesses:
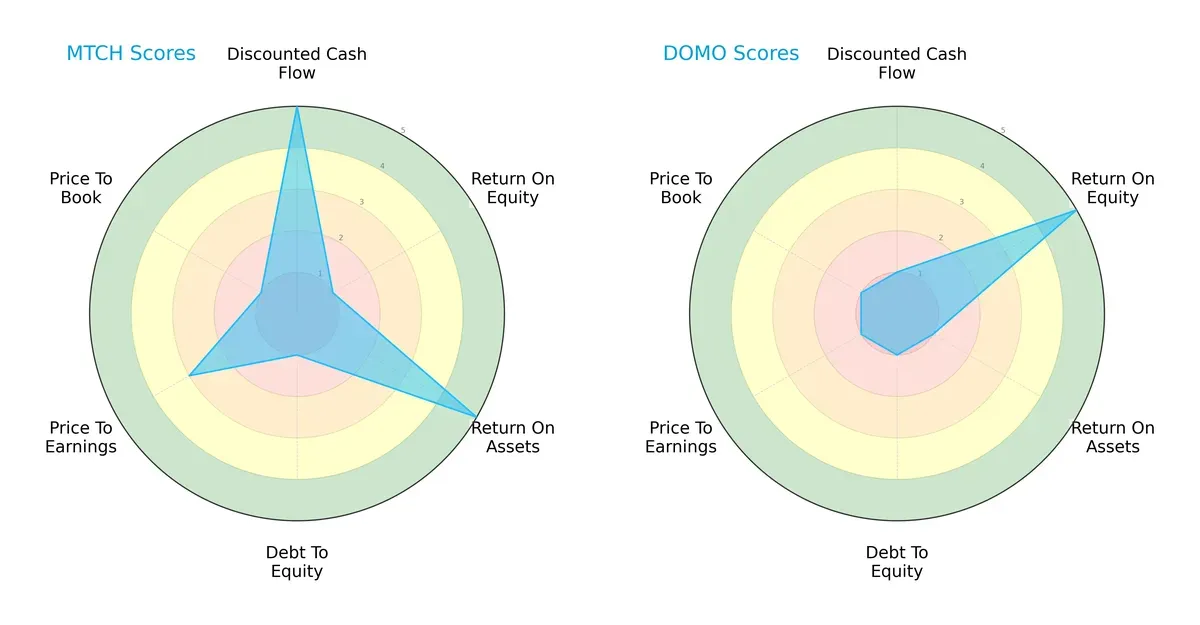
Match Group shows strength in discounted cash flow (DCF) and return on assets (ROA), signaling effective asset utilization and cash generation. However, its low return on equity (ROE) and high debt burden weaken its financial stability. Domo, conversely, excels in ROE but suffers from poor DCF and ROA scores, indicating reliance on equity efficiency rather than operational strength. Overall, Match Group presents a more balanced profile, while Domo depends heavily on its equity returns.
Bankruptcy Risk: Solvency Showdown
The Altman Z-Score difference signals a troubling outlook for both firms:
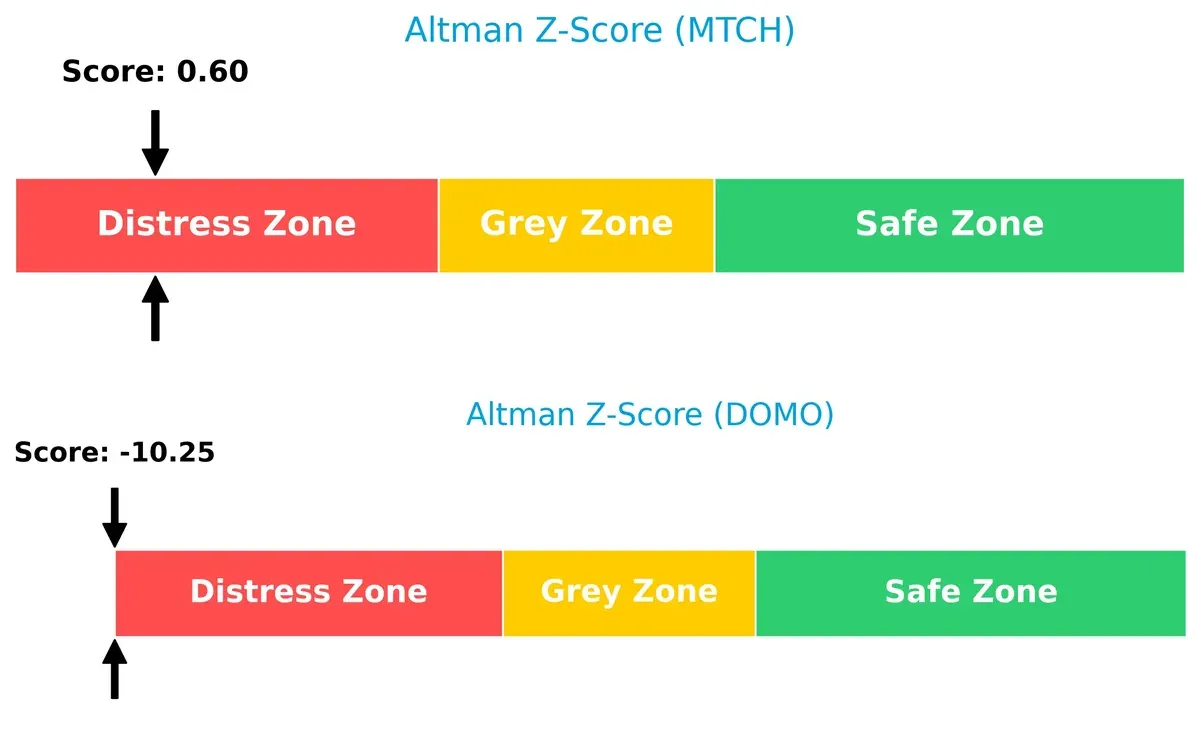
Match Group’s score of 0.6 and Domo’s -10.3 place both in the distress zone, suggesting high bankruptcy risk. Match Group’s closer proximity to the threshold offers marginally better survival odds in this cycle, but both require urgent financial restructuring.
Financial Health: Quality of Operations
Piotroski F-Score analysis marks a stark contrast in operational quality:
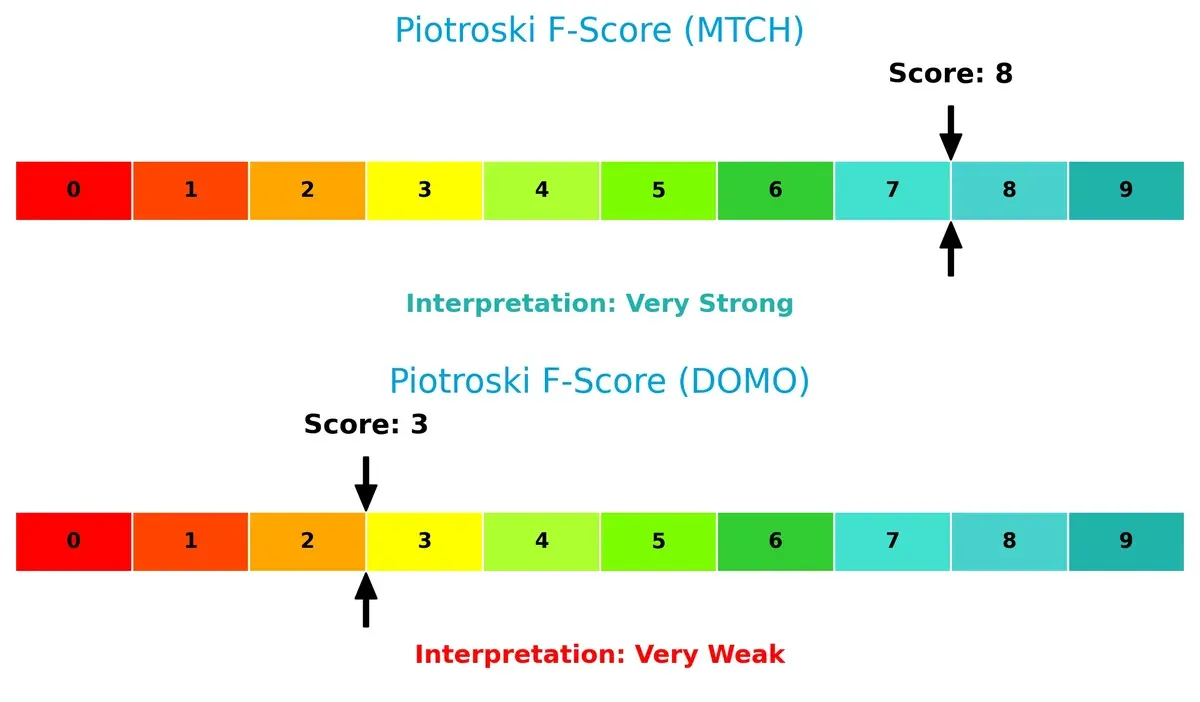
Match Group scores an 8, reflecting very strong financial health and solid internal metrics. Domo’s 3 underscores significant red flags, indicating weak profitability, liquidity, and efficiency. This disparity signals Match Group’s superior operational resilience compared to Domo’s fragile financial condition.
How are the two companies positioned?
This section dissects the operational DNA of MTCH and DOMO by comparing their revenue distribution and internal dynamics, including strengths and weaknesses. The goal is to confront their economic moats to determine which business model offers the most resilient and sustainable competitive advantage today.
Revenue Segmentation: The Strategic Mix
This visual comparison dissects how Match Group, Inc. and Domo, Inc. diversify their income streams and where their primary sector bets lie:
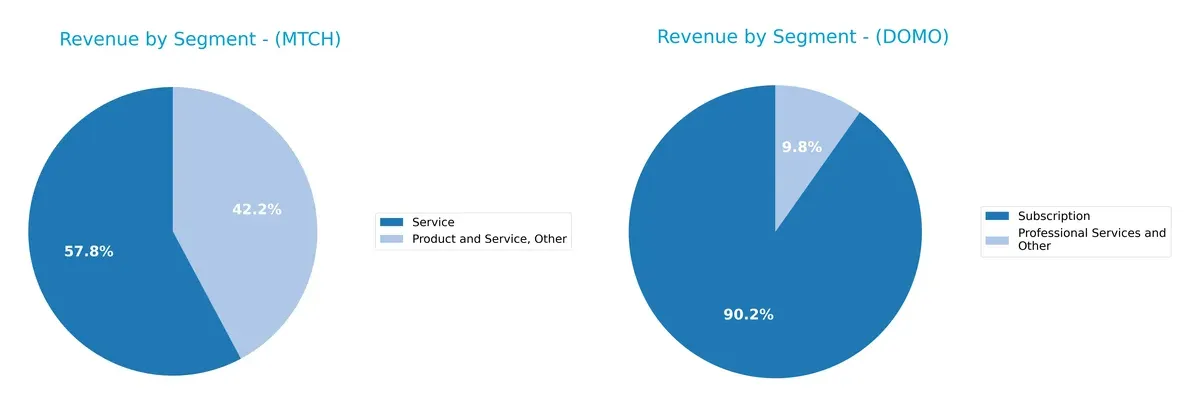
Match Group leans heavily on its “Service” segment with $1.36B in 2020, while “Product and Service, Other” adds $989M, showing moderate diversification. Domo, however, pivots almost entirely on “Subscription,” reaching $286M in 2025, with “Professional Services and Other” contributing just $31M. Match’s broader mix reduces concentration risk and signals ecosystem lock-in. Domo’s narrow focus highlights infrastructure dominance but exposes it to subscription market fluctuations.
Strengths and Weaknesses Comparison
This table compares the Strengths and Weaknesses of Match Group, Inc. and Domo, Inc.:
Match Group Strengths
- Favorable net margin at 17.6%
- Strong ROIC of 22.5% exceeding WACC at 7.8%
- Robust quick ratio at 1.42
- High fixed asset turnover at 26.6
- Significant global presence with 1.89B Non-US revenue
- Diversified product and service revenue streams
Domo Strengths
- High ROIC at 194.7% indicating efficient capital use
- Favorable P/E and P/B ratios
- Asset turnover at 1.48 showing operational efficiency
- Growing subscription revenue at 286M
- Presence in US and Japan markets
- Favorable debt to equity ratio
Match Group Weaknesses
- Negative ROE at -242% signals shareholder value erosion
- High debt to assets ratio at 89.1% poses financial risk
- Neutral current ratio at 1.42 limits liquidity cushion
- Negative P/B ratio unusual and concerning
- Debt to equity ratio negative indicating accounting complexity
Domo Weaknesses
- Negative net margin at -25.8% shows unprofitability
- WACC of 12.8% exceeds typical benchmarks
- Low current and quick ratios at 0.56 raise liquidity concerns
- Negative interest coverage at -3 suggests solvency issues
- Zero dividend yield limits income appeal
- Debt to assets ratio at 63.2% is elevated
Match Group exhibits strong profitability and global diversification but faces financial leverage and shareholder return challenges. Domo shows efficient capital use and operational strength but struggles with liquidity and profitability deficits, impacting its financial stability.
The Moat Duel: Analyzing Competitive Defensibility
A structural moat shields long-term profits from relentless competitive pressure. Its strength defines future resilience and market control:
Match Group, Inc.: Network Effects Moat
Match Group dominates dating apps with strong network effects, reflected in a 25.6% EBIT margin and steady revenue growth. Expansion into international markets in 2026 should deepen this moat.
Domo, Inc.: Intangible Assets and Innovation Moat
Domo leans on proprietary cloud BI technology, driving a 74.5% gross margin but trailing in profitability. Its high ROIC surge signals potential, yet weak EBIT margins highlight operational challenges ahead.
Network Effects vs. Innovation Edge
Match Group’s broad user base creates a wider moat, locking in customers and stabilizing margins. Domo’s innovation offers promise but lacks the deep profit moat to fend off competition. Match Group is better equipped to protect its market share.
Which stock offers better returns?
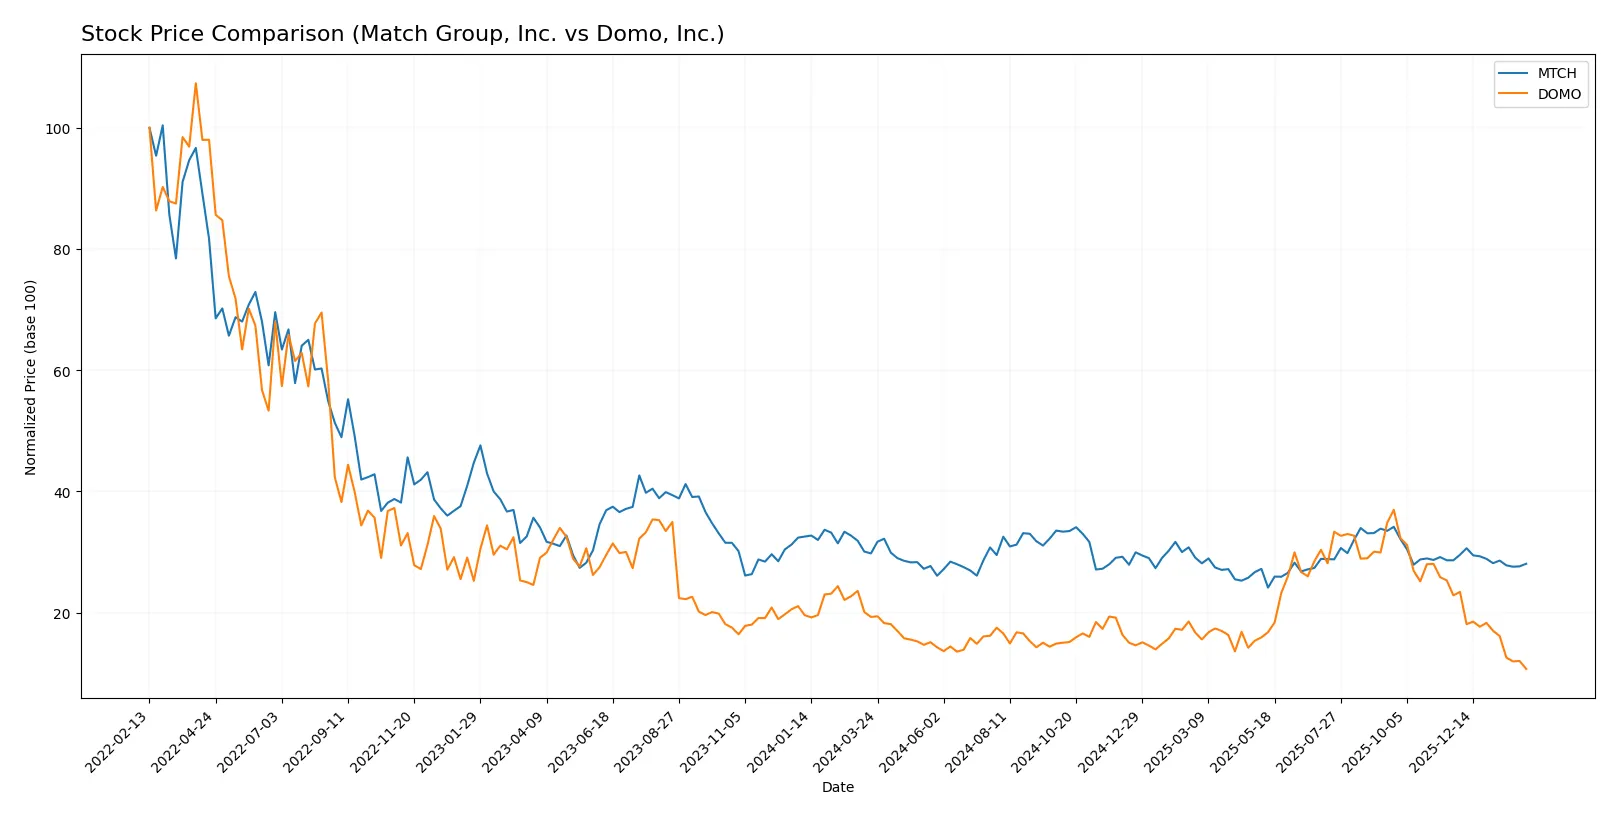
Over the past year, Match Group and Domo experienced notable price declines, with Match showing a moderate downtrend and Domo facing a sharper sell-off and higher volatility.
Trend Comparison
Match Group’s stock declined 5.72% over 12 months, marking a bearish trend with decelerating losses and a high-low range from 38.51 to 27.18. Volatility measured by 2.61% std deviation.
Domo’s stock plunged 44.48% in the same period, also bearish with deceleration. Its price ranged from 18.06 to 5.23, reflecting higher volatility at 3.08% std deviation.
Match Group outperformed Domo, delivering a smaller loss and less volatile price action over the year, indicating relatively better market resilience.
Target Prices
Analysts present a moderate upside for Match Group and Domo, reflecting cautious optimism.
| Company | Target Low | Target High | Consensus |
|---|---|---|---|
| Match Group, Inc. | 33 | 43 | 36 |
| Domo, Inc. | 10 | 13 | 11.5 |
Match Group’s consensus target of $36 sits about 14% above its current $31.63 price, signaling moderate growth expectations. Domo’s $11.5 consensus target more than doubles its current $5.23 price, indicating strong upside potential despite higher volatility.

Don’t Let Luck Decide Your Entry Point
Optimize your entry points with our advanced ProRealTime indicators. You’ll get efficient buy signals with precise price targets for maximum performance. Start outperforming now!
How do institutions grade them?
Match Group, Inc. Grades
The following table summarizes recent grades issued by reputable institutions for Match Group, Inc.:
| Grading Company | Action | New Grade | Date |
|---|---|---|---|
| TD Cowen | Maintain | Buy | 2026-02-05 |
| JP Morgan | Maintain | Neutral | 2026-02-04 |
| Truist Securities | Maintain | Hold | 2026-02-04 |
| Morgan Stanley | Maintain | Equal Weight | 2026-01-13 |
| Truist Securities | Maintain | Hold | 2025-11-05 |
| Evercore ISI Group | Maintain | In Line | 2025-11-05 |
| Wells Fargo | Maintain | Equal Weight | 2025-11-05 |
| Morgan Stanley | Maintain | Equal Weight | 2025-10-20 |
| Susquehanna | Maintain | Positive | 2025-08-07 |
| JP Morgan | Maintain | Neutral | 2025-08-06 |
Domo, Inc. Grades
The following table summarizes recent grades issued by reputable institutions for Domo, Inc.:
| Grading Company | Action | New Grade | Date |
|---|---|---|---|
| DA Davidson | Maintain | Neutral | 2025-12-05 |
| Lake Street | Maintain | Hold | 2025-12-05 |
| TD Cowen | Maintain | Buy | 2025-12-05 |
| DA Davidson | Maintain | Neutral | 2025-12-01 |
| JMP Securities | Maintain | Market Outperform | 2025-09-10 |
| DA Davidson | Maintain | Neutral | 2025-08-28 |
| Cantor Fitzgerald | Maintain | Overweight | 2025-08-28 |
| TD Cowen | Upgrade | Buy | 2025-08-26 |
| JMP Securities | Maintain | Market Outperform | 2025-06-25 |
| Cantor Fitzgerald | Maintain | Overweight | 2025-06-25 |
Which company has the best grades?
Domo, Inc. has received more positive designations such as “Market Outperform” and “Overweight,” compared to Match Group, Inc.’s predominantly neutral and hold ratings. This could suggest stronger institutional confidence in Domo’s near-term prospects, potentially influencing investor sentiment.
Risks specific to each company
The following categories identify the critical pressure points and systemic threats facing both firms in the 2026 market environment:
1. Market & Competition
Match Group, Inc. (MTCH)
- Faces intense competition in the global dating app market with established brands.
Domo, Inc. (DOMO)
- Operates in a crowded cloud BI platform space with strong rivals and high innovation pressure.
2. Capital Structure & Debt
Match Group, Inc. (MTCH)
- High debt-to-assets ratio at 89%, signaling financial leverage risk despite favorable interest coverage.
Domo, Inc. (DOMO)
- Debt-to-assets at 63%, but poor interest coverage (-2.99) indicates weak debt servicing capacity.
3. Stock Volatility
Match Group, Inc. (MTCH)
- Beta 1.315 indicates moderate volatility, aligned with tech sector norms.
Domo, Inc. (DOMO)
- Beta 1.652 points to higher stock volatility, increasing investment risk.
4. Regulatory & Legal
Match Group, Inc. (MTCH)
- Subject to data privacy and content regulations globally, adding compliance costs.
Domo, Inc. (DOMO)
- Faces regulatory scrutiny over data security and cross-border data flows.
5. Supply Chain & Operations
Match Group, Inc. (MTCH)
- Relies on cloud infrastructure with operational resilience but vulnerable to outages.
Domo, Inc. (DOMO)
- Dependent on third-party cloud providers, creating exposure to service disruptions.
6. ESG & Climate Transition
Match Group, Inc. (MTCH)
- Moderate ESG focus; social issues around user safety are critical reputational risks.
Domo, Inc. (DOMO)
- ESG efforts nascent; energy use in cloud operations poses climate transition challenges.
7. Geopolitical Exposure
Match Group, Inc. (MTCH)
- Global footprint exposes it to geopolitical risks and data sovereignty laws.
Domo, Inc. (DOMO)
- International operations subject to geopolitical tensions and regulatory uncertainty.
Which company shows a better risk-adjusted profile?
Match Group’s single biggest risk is its high leverage, yet it maintains solid interest coverage and favorable profitability metrics. Domo struggles with poor liquidity, weak interest coverage, and distress-level bankruptcy risk, despite high ROE. Match Group presents a more balanced risk-adjusted profile, bolstered by its diversified revenue base and stronger financial ratios. The recent Altman Z-Score distress signals for both firms highlight vulnerability, but Domo’s negative quick ratio and interest coverage intensify concerns.
Final Verdict: Which stock to choose?
Match Group’s superpower lies in its consistent value creation and strong economic moat, driven by efficient capital allocation and solid cash flow generation. Its point of vigilance is the elevated debt level, which warrants close monitoring. It suits portfolios seeking steady growth with moderate risk tolerance.
Domo stands out with an impressive ROIC that far exceeds its cost of capital, reflecting a unique strategic moat in operational efficiency. However, its weak liquidity and negative margins introduce higher risk compared to Match Group. It fits investors pursuing aggressive growth with a tolerance for volatility and turnaround potential.
If you prioritize stable value creation and a proven track record, Match Group outshines with its sustainable profitability and cash generation. However, if you seek high-risk, high-reward opportunities driven by operational leverage, Domo offers superior growth potential despite its financial fragility. Each choice aligns with distinct investor profiles and risk appetites.
Disclaimer: Investment carries a risk of loss of initial capital. The past performance is not a reliable indicator of future results. Be sure to understand risks before making an investment decision.
Go Further
I encourage you to read the complete analyses of Match Group, Inc. and Domo, Inc. to enhance your investment decisions: