Intuit Inc. and Domo, Inc. are two prominent players in the software application industry, each carving out unique niches in financial management and business intelligence. Intuit focuses on comprehensive financial solutions for consumers and small businesses, while Domo offers a cloud-based platform for real-time data insights across organizations. Comparing these companies reveals contrasting innovation strategies and market positions, guiding investors toward the most promising opportunity in this dynamic sector.
Table of contents
Companies Overview
I will begin the comparison between Intuit Inc. and Domo, Inc. by providing an overview of these two companies and their main differences.
Intuit Overview
Intuit Inc. focuses on financial management and compliance products for consumers, small businesses, self-employed individuals, and accounting professionals. It operates four main segments offering cloud-based accounting software, tax preparation services, personal finance platforms, and payroll solutions. Intuit holds a strong market position with a diverse product portfolio serving clients in the US, Canada, and internationally.
Domo Overview
Domo, Inc. provides a cloud-based business intelligence platform aimed at connecting all levels of an organization with real-time data and insights. Its platform supports decision-making from executives to frontline employees, enabling management via smartphones. Founded in 2010, Domo serves clients in the US, Japan, and beyond, focusing on digital data connectivity and business management.
Key similarities and differences
Both Intuit and Domo operate in the software application industry with cloud-based solutions and serve international markets. However, Intuit’s business model is centered on financial management and compliance tools across multiple segments, while Domo specializes in business intelligence and data integration platforms. Intuit has a significantly larger workforce and market capitalization compared to Domo, reflecting broader scale and diversified offerings.
Income Statement Comparison
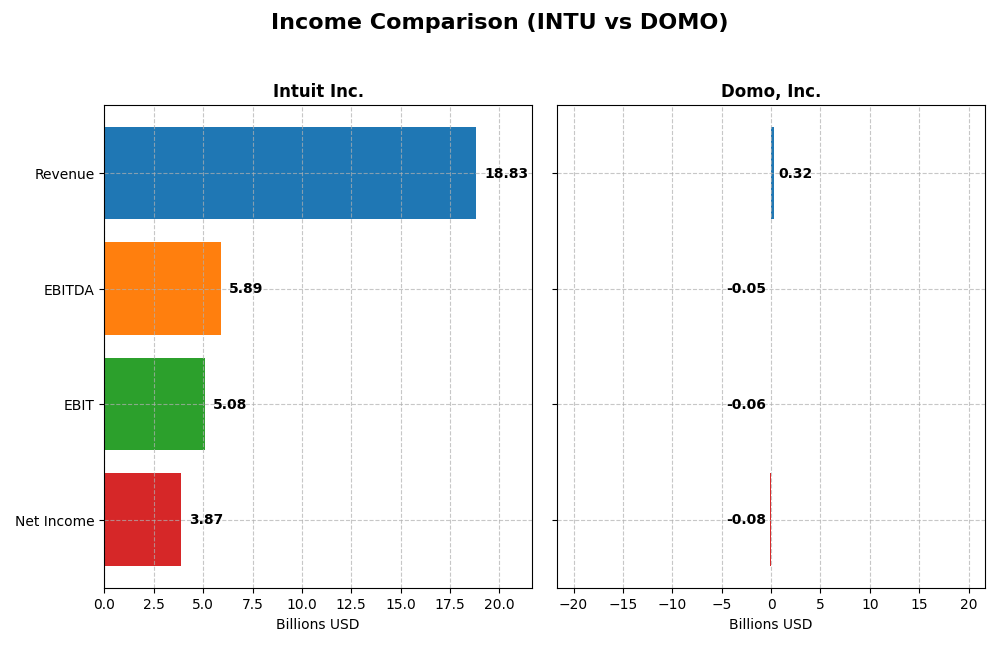
The table below presents a side-by-side comparison of key income statement metrics for Intuit Inc. and Domo, Inc. for the most recent fiscal year available.
| Metric | Intuit Inc. (INTU) | Domo, Inc. (DOMO) |
|---|---|---|
| Market Cap | 152B | 256M |
| Revenue | 18.83B | 317M |
| EBITDA | 5.89B | -50M |
| EBIT | 5.08B | -59M |
| Net Income | 3.87B | -82M |
| EPS | 13.82 | -2.13 |
| Fiscal Year | 2025 | 2025 |
Income Statement Interpretations
Intuit Inc.
Intuit’s revenue and net income showed a strong upward trend from 2021 to 2025, with revenue nearly doubling to $18.8B and net income rising to $3.87B. Margins remain robust, with an 80.8% gross margin and a net margin above 20%. In 2025, revenue growth accelerated to 15.6%, supported by a 33.9% increase in EBIT, indicating improved operational efficiency and profitability.
Domo, Inc.
Domo’s revenue grew by about 50.8% over the five years, reaching $317M in 2025, but net income remained negative at -$82M. Its gross margin of 74.5% is decent, yet the EBIT margin is deeply negative at -18.7%, reflecting sustained operating losses. In 2025, revenue declined slightly by 0.6%, with worsened EBIT and net margin, signaling ongoing profitability challenges.
Which one has the stronger fundamentals?
Intuit demonstrates stronger fundamentals with consistent revenue and net income growth, high profitability margins, and efficient cost management. Conversely, Domo struggles with profitability, negative net margins, and shrinking revenues in the latest year. Intuit’s favorable income statement metrics contrast with Domo’s unfavorable profitability and growth trends, highlighting Intuit’s superior financial health.
Financial Ratios Comparison
The table below presents a side-by-side comparison of key financial ratios for Intuit Inc. (INTU) and Domo, Inc. (DOMO) based on the most recent fiscal year data available.
| Ratios | Intuit Inc. (2025) | Domo, Inc. (2025) |
|---|---|---|
| ROE | 19.6% | 46.2% |
| ROIC | 14.8% | 194.7% |
| P/E | 56.8 | -3.98 |
| P/B | 11.2 | -1.84 |
| Current Ratio | 1.36 | 0.56 |
| Quick Ratio | 1.36 | 0.56 |
| D/E | 0.34 | -0.76 |
| Debt-to-Assets | 18.0% | 63.2% |
| Interest Coverage | 19.9 | -3.0 |
| Asset Turnover | 0.51 | 1.48 |
| Fixed Asset Turnover | 12.5 | 8.17 |
| Payout ratio | 30.7% | 0% |
| Dividend yield | 0.54% | 0% |
Interpretation of the Ratios
Intuit Inc.
Intuit displays generally strong financial ratios with favorable net margin at 20.55%, ROE at 19.63%, and ROIC at 14.78%, indicating effective profitability and capital use. However, its high P/E of 56.82 and P/B of 11.15 are less attractive. Dividend yield is low at 0.54%, reflecting a conservative payout supported by solid cash flow, posing limited distribution risks.
Domo, Inc.
Domo shows mixed ratios with significant weaknesses such as a negative net margin of -25.84%, poor liquidity (current ratio 0.56), and negative interest coverage. Nonetheless, its ROE of 46.23% and ROIC of 194.73% suggest strong returns on invested capital. The company does not pay dividends, likely focusing on reinvestment and growth amid operational challenges.
Which one has the best ratios?
Intuit’s ratios present a more balanced and favorable financial profile, with strong profitability and manageable leverage, despite some valuation concerns. Domo’s figures reflect higher risk with weak margins and liquidity but impressive returns on equity and capital. Overall, Intuit exhibits a stronger ratio set based on stability and earnings quality.
Strategic Positioning
This section compares the strategic positioning of Intuit and Domo, including market position, key segments, and exposure to technological disruption:
Intuit Inc.
- Leading market cap of $152B with diversified software suite; faces competition in financial management software.
- Diverse segments: Small Business & Self-Employed, Consumer, Credit Karma, Professional Tax drive revenues.
- Operates in established financial software space with incremental cloud adoption; moderate threat from new tech.
Domo, Inc.
- Small market cap of $256M, competing in cloud-based business intelligence with higher volatility.
- Revenue mainly from subscription services and professional services, focused on business intelligence.
- Cloud-native platform with real-time data access; higher susceptibility to rapid tech advancements and disruption.
Intuit Inc. vs Domo, Inc. Positioning
Intuit pursues a diversified approach across multiple financial software segments, offering stability and scale advantages. Domo concentrates on cloud BI subscriptions, enabling agility but with limited scale and higher market risk based on provided data.
Which has the best competitive advantage?
Domo shows a very favorable and growing ROIC trend, indicating a durable competitive advantage. Intuit also creates value but faces declining profitability, reflecting a slightly favorable moat status.
Stock Comparison
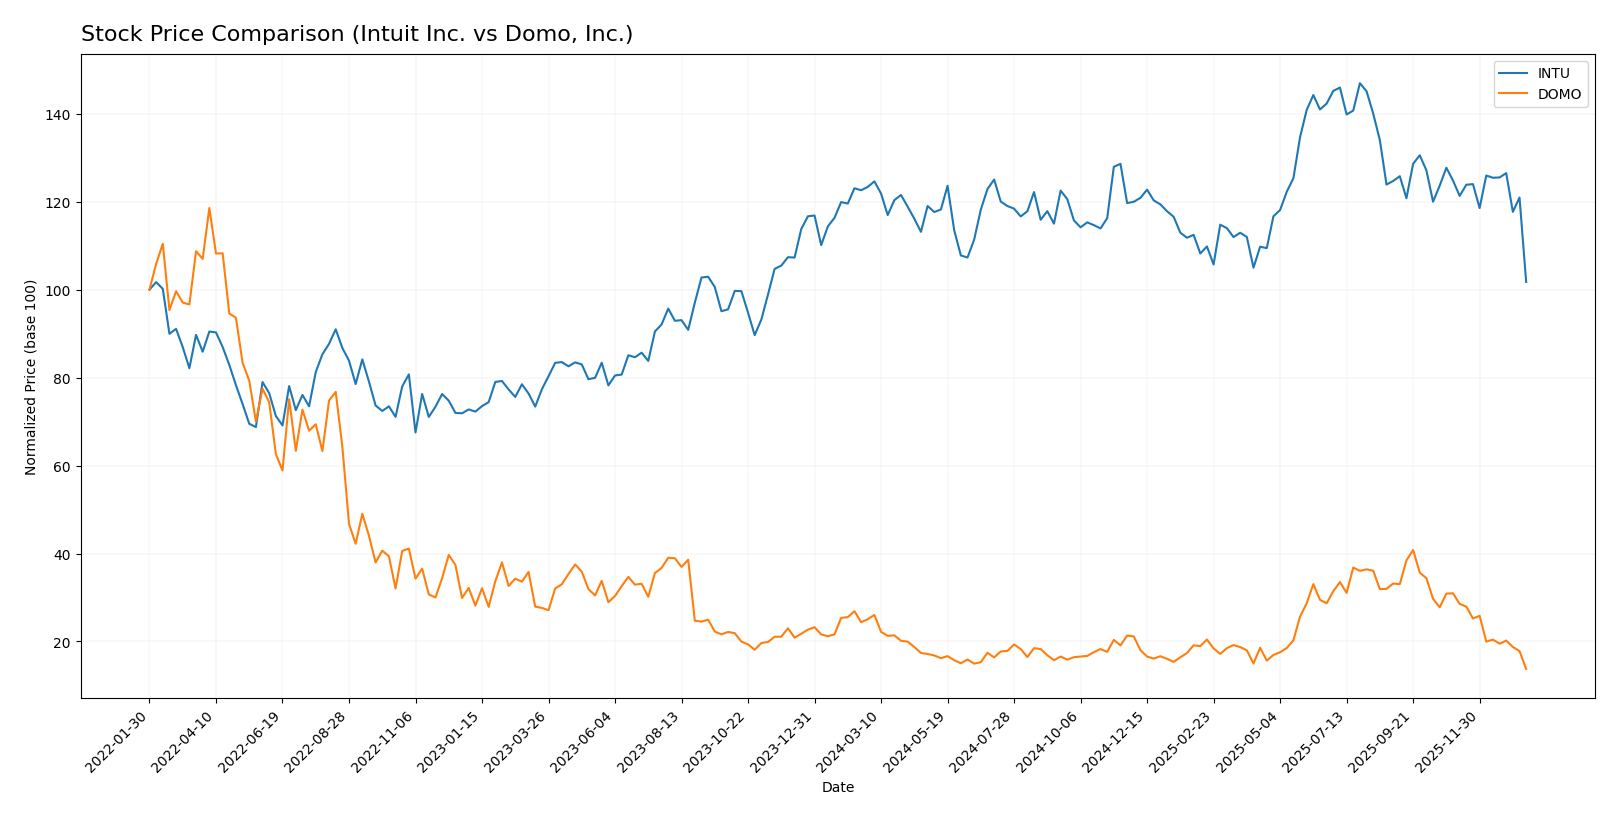
The stock price movements of Intuit Inc. and Domo, Inc. over the past year reveal significant bearish trends, with notable price declines and decelerating momentum in both cases.
Trend Analysis
Intuit Inc. experienced a -17.52% price change over the past 12 months, indicating a bearish trend with decelerating decline. The stock fluctuated between a high of 785.95 and a low of 544.22, with high volatility (std deviation 51.53).
Domo, Inc. showed a sharper bearish trend, with a -45.04% price change over the same period and deceleration in its decline. The stock traded between 18.06 and 6.09, exhibiting low volatility (std deviation 3.01).
Comparing both stocks, Intuit delivered the higher market performance with a smaller price decrease than Domo, reflecting less severe depreciation over the past year.
Target Prices
Analysts present a clear consensus on target prices for Intuit Inc. and Domo, Inc., indicating expected price ranges and averages.
| Company | Target High | Target Low | Consensus |
|---|---|---|---|
| Intuit Inc. | 880 | 700 | 798.4 |
| Domo, Inc. | 13 | 10 | 11.5 |
The consensus target prices for Intuit and Domo suggest significant upside potential compared to their current prices of 545.79 and 6.12 respectively, reflecting positive analyst expectations.
Analyst Opinions Comparison
This section compares analysts’ ratings and grades for Intuit Inc. and Domo, Inc.:
Rating Comparison
Intuit Inc. Rating
- Rating: B, assessed as Very Favorable
- Discounted Cash Flow Score: 4, Favorable valuation
- ROE Score: 4, Favorable efficiency in generating profits
- ROA Score: 5, Very Favorable asset utilization
- Debt To Equity Score: 2, Moderate financial risk
- Overall Score: 3, Moderate financial standing
Domo, Inc. Rating
- Rating: C, assessed as Very Favorable
- Discounted Cash Flow Score: 1, Very Unfavorable valuation
- ROE Score: 5, Very Favorable efficiency in generating profits
- ROA Score: 1, Very Unfavorable asset utilization
- Debt To Equity Score: 1, Very Unfavorable financial risk
- Overall Score: 2, Moderate financial standing
Which one is the best rated?
Based on the provided data, Intuit holds a higher overall rating (B) compared to Domo’s (C). Intuit scores better in discounted cash flow, ROA, and debt-to-equity, while Domo leads only on ROE. Overall, Intuit is better rated.
Scores Comparison
Here is a comparison of the Altman Z-Score and Piotroski Score for Intuit Inc. and Domo, Inc.:
Intuit Scores
- Altman Z-Score: 9.35, indicating a safe zone status.
- Piotroski Score: 9, categorized as very strong.
Domo Scores
- Altman Z-Score: -10.10, indicating distress zone.
- Piotroski Score: 3, categorized as very weak.
Which company has the best scores?
Based strictly on the provided data, Intuit has much higher scores with a safe zone Altman Z-Score and a very strong Piotroski Score, while Domo’s scores indicate financial distress and weak financial strength.
Grades Comparison
Here is the comparison of recent grades for Intuit Inc. and Domo, Inc.:
Intuit Inc. Grades
The following table summarizes recent grades from well-known grading companies for Intuit Inc.:
| Grading Company | Action | New Grade | Date |
|---|---|---|---|
| Wells Fargo | Downgrade | Equal Weight | 2026-01-08 |
| Wells Fargo | Maintain | Overweight | 2025-11-21 |
| RBC Capital | Maintain | Outperform | 2025-11-21 |
| BMO Capital | Maintain | Outperform | 2025-11-21 |
| Evercore ISI Group | Maintain | Outperform | 2025-11-18 |
| RBC Capital | Maintain | Outperform | 2025-09-02 |
| RBC Capital | Maintain | Outperform | 2025-08-22 |
| UBS | Maintain | Neutral | 2025-08-22 |
| Morgan Stanley | Maintain | Overweight | 2025-08-22 |
| Barclays | Maintain | Overweight | 2025-08-22 |
Intuit’s grades predominantly reflect a strong buy or outperform stance, with a recent slight downgrade to equal weight indicating some caution.
Domo, Inc. Grades
Below are recent grades for Domo, Inc. from recognized grading firms:
| Grading Company | Action | New Grade | Date |
|---|---|---|---|
| DA Davidson | Maintain | Neutral | 2025-12-05 |
| TD Cowen | Maintain | Buy | 2025-12-05 |
| Lake Street | Maintain | Hold | 2025-12-05 |
| DA Davidson | Maintain | Neutral | 2025-12-01 |
| JMP Securities | Maintain | Market Outperform | 2025-09-10 |
| DA Davidson | Maintain | Neutral | 2025-08-28 |
| Cantor Fitzgerald | Maintain | Overweight | 2025-08-28 |
| TD Cowen | Upgrade | Buy | 2025-08-26 |
| JMP Securities | Maintain | Market Outperform | 2025-06-25 |
| Cantor Fitzgerald | Maintain | Overweight | 2025-06-25 |
Domo’s ratings show a mix of buy, neutral, and outperform grades, indicating moderate confidence with some variability in analyst sentiment.
Which company has the best grades?
Intuit Inc. holds generally higher and more consistent grades, mostly outperform and overweight, compared to Domo, Inc.’s more mixed ratings. This suggests that investors might view Intuit as a stronger performer, potentially implying lower risk or greater confidence in its future growth relative to Domo.
Strengths and Weaknesses
The table below compares key strengths and weaknesses of Intuit Inc. and Domo, Inc. based on their recent financial performance and strategic positioning.
| Criterion | Intuit Inc. (INTU) | Domo, Inc. (DOMO) |
|---|---|---|
| Diversification | Highly diversified with multiple segments: Consumer, Global Business Solutions, Credit Karma, Professional Tax. | Limited diversification; revenue mainly from Subscription and Professional Services. |
| Profitability | Strong profitability with 20.55% net margin and positive ROIC (14.78%). | Negative net margin (-25.84%) despite very high ROIC (194.73%), indicating mixed profitability signals. |
| Innovation | Stable, but ROIC trend declining, suggesting some pressure on innovation-driven growth. | Rapidly growing ROIC trend, indicating strong innovation and value creation potential. |
| Global presence | Extensive global business solutions segment endorses wide international reach. | More limited global presence; primarily subscription-based services in niche markets. |
| Market Share | Large market share in financial and tax software with steady revenue growth. | Smaller market share but growing rapidly with increasing subscription revenue. |
In summary, Intuit offers a safer, well-diversified investment with consistent profitability, though growth is moderating. Domo shows exciting growth and innovation but faces profitability and liquidity challenges, implying higher risk for investors. I advise balancing risk tolerance accordingly.
Risk Analysis
Below is a comparative table summarizing key risks for Intuit Inc. and Domo, Inc. based on their most recent financial and market data from 2025:
| Metric | Intuit Inc. (INTU) | Domo, Inc. (DOMO) |
|---|---|---|
| Market Risk | Beta 1.25, moderate volatility | Beta 1.65, higher volatility |
| Debt Level | Low debt-to-equity 0.34, favorable | High debt-to-assets 63.23%, unfavorable |
| Regulatory Risk | Moderate; financial software sector compliance | Moderate; cloud software regulations, evolving standards |
| Operational Risk | Large scale with 18.8K employees, stable operations | Smaller scale, 888 employees, higher operational leverage |
| Environmental Risk | Low direct impact; tech sector | Low direct impact; tech sector |
| Geopolitical Risk | US-based with international presence, moderate exposure | US-based with some international exposure, moderate exposure |
Intuit’s most impactful risks lie in market fluctuations and valuation concerns, despite strong financial health and low leverage. Domo faces higher financial distress risks with high leverage, negative margins, and weaker liquidity, making it more vulnerable to operational and market shocks.
Which Stock to Choose?
Intuit Inc. (INTU) shows a favorable income evolution with strong revenue and net income growth over 2021-2025, supported by solid profitability metrics and a debt level well-managed at 0.34 debt-to-equity. Its financial ratios are mostly favorable, reflecting efficient capital use, and it holds a very favorable rating of B.
Domo, Inc. (DOMO) presents a challenging income evolution marked by negative net margins and declining revenues recently, with an unfavorable debt-to-assets ratio of 63.23% and liquidity concerns. Although some profitability metrics are favorable, its overall financial ratios are neutral, and it carries a very favorable rating of C despite financial distress indicators.
For investors prioritizing stable growth and consistent profitability, Intuit could appear more favorable due to its strong income statement and solid financial ratios, while those focused on potential turnaround opportunities might find Domo’s improving ROIC and very favorable moat status noteworthy despite current risks.
Disclaimer: Investment carries a risk of loss of initial capital. The past performance is not a reliable indicator of future results. Be sure to understand risks before making an investment decision.
Go Further
I encourage you to read the complete analyses of Intuit Inc. and Domo, Inc. to enhance your investment decisions: