In today’s fast-paced tech landscape, Figma, Inc. and Domo, Inc. stand out as innovative players in the software application industry. Figma specializes in collaborative design tools, while Domo focuses on cloud-based business intelligence platforms. Both companies serve overlapping markets seeking digital transformation and real-time insights. This article will help you navigate their strengths and risks to identify which stock might best fit your investment portfolio.
Table of contents
Companies Overview
I will begin the comparison between Figma and Domo by providing an overview of these two companies and their main differences.
Figma Overview
Figma, Inc. develops a browser-based design tool aimed at user interface creation, facilitating collaboration among design and development teams. Its product suite includes Figma Design for prototyping and feedback, Dev Mode for code translation, and FigJam for team alignment. Founded in 2012 and headquartered in San Francisco, Figma operates in the software application industry with a market cap of 14.4B USD.
Domo Overview
Domo, Inc. offers a cloud-based business intelligence platform that connects all organizational levels to real-time data and insights, enabling business management via smartphones. Founded in 2010 and based in American Fork, Utah, Domo operates internationally within the software application sector. The company’s market capitalization stands at 257M USD.
Key similarities and differences
Both Figma and Domo operate within the software application industry and emphasize cloud-based platforms that enhance collaboration and data accessibility. However, Figma focuses on design and prototyping tools for product development teams, while Domo specializes in business intelligence and data management across organizational hierarchies. Figma is significantly larger, with a market cap more than 50 times that of Domo.
Income Statement Comparison
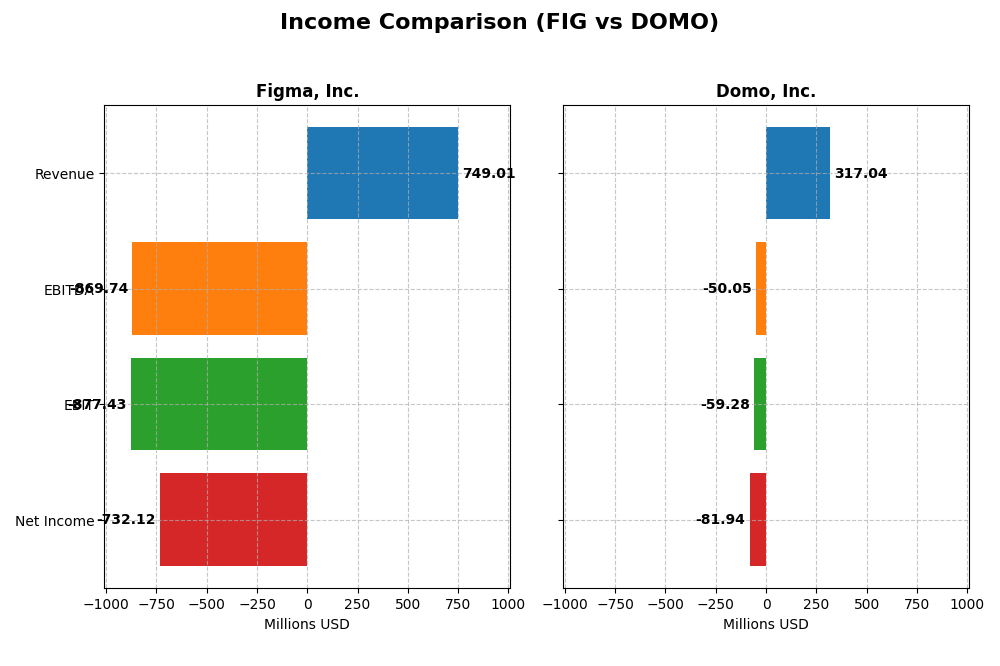
The table below presents a side-by-side comparison of key income statement metrics for Figma, Inc. and Domo, Inc. for their most recent fiscal years, providing a snapshot of their financial performance.
| Metric | Figma, Inc. (FIG) | Domo, Inc. (DOMO) |
|---|---|---|
| Market Cap | 14.4B | 257M |
| Revenue | 749M | 317M |
| EBITDA | -870M | -50M |
| EBIT | -877M | -59M |
| Net Income | -732M | -82M |
| EPS | -3.11 | -2.13 |
| Fiscal Year | 2024 | 2025 |
Income Statement Interpretations
Figma, Inc.
Figma’s revenue grew significantly by 48.36% from 2023 to 2024, reaching $749M, while net income reversed from a $286M profit to a $732M loss, reflecting deteriorated profitability. Gross margins remained strong at 88.32%, yet both EBIT and net margins turned sharply negative, indicating rising operating expenses outpacing revenue gains. The latest year shows rapid top-line growth but margin pressures.
Domo, Inc.
Domo reported relatively stable revenue around $317M in 2024 and 2025, with a slight decline of 0.61% year-over-year. Net losses persisted but improved slightly, with net income at a loss of $82M in 2025. Gross margin stayed favorable at 74.45%, though EBIT and net margins remained negative, signaling ongoing profitability challenges despite controlled expenses. Recent results show stagnation in revenue and modest margin deterioration.
Which one has the stronger fundamentals?
Both companies face profitability challenges with negative EBIT and net margins. Figma delivers more robust revenue growth but at the cost of sharply worsening net income and margins. Domo’s revenue is steady but lacks growth, with smaller losses and a more moderate margin decline. Neither shows a clearly favorable overall income statement, but Figma’s top-line expansion contrasts with Domo’s stability amid continued losses.
Financial Ratios Comparison
The table below presents a side-by-side comparison of key financial ratios for Figma, Inc. (FIG) and Domo, Inc. (DOMO) based on their most recent fiscal year data.
| Ratios | Figma, Inc. (FIG) 2024 | Domo, Inc. (DOMO) 2025 |
|---|---|---|
| ROE | -55.3% | 46.2% |
| ROIC | -59.7% | 194.7% |
| P/E | -70.7 | -4.0 |
| P/B | 39.1 | -1.8 |
| Current Ratio | 3.66 | 0.56 |
| Quick Ratio | 3.66 | 0.56 |
| D/E | 0.022 | -0.765 |
| Debt-to-Assets | 1.6% | 63.2% |
| Interest Coverage | 0 | -3.0 |
| Asset Turnover | 0.42 | 1.48 |
| Fixed Asset Turnover | 17.1 | 8.17 |
| Payout ratio | 0 | 0 |
| Dividend yield | 0 | 0 |
Interpretation of the Ratios
Figma, Inc.
Figma shows a mixed ratio profile with notable weaknesses: a deeply negative net margin (-97.74%) and return on equity (-55.29%), reflecting profitability challenges. Despite a strong quick ratio (3.66) and low debt-to-equity (0.02), the high price-to-book ratio (39.1) and zero dividend yield highlight valuation concerns and no shareholder returns via dividends, consistent with a growth or reinvestment phase.
Domo, Inc.
Domo presents a balanced ratio set with favorable returns on equity (46.23%) and invested capital (194.73%), indicating efficient capital use despite a negative net margin (-25.84%). Its liquidity ratios are weak (current ratio 0.56), and a high debt-to-assets ratio (63.23%) raises leverage concerns. The company pays no dividends, likely prioritizing growth or R&D investments.
Which one has the best ratios?
Comparing both, Domo’s ratios are more balanced with stronger profitability and capital efficiency despite liquidity and leverage risks. Figma’s ratios reveal significant profitability and valuation weaknesses, with a growth focus but more unfavorable indicators. Overall, Domo holds a neutral stance, while Figma’s profile is considered unfavorable.
Strategic Positioning
This section compares the strategic positioning of Figma, Inc. and Domo, Inc., including market position, key segments, and exposure to technological disruption:
Figma, Inc.
- Large market cap of 14.4B USD; faces competitive pressure in application software.
- Focuses on collaborative design tools for UI/UX and product development teams.
- Provides AI-powered design tools and browser-based applications, adapting to tech trends.
Domo, Inc.
- Smaller market cap of 257M USD; operates in competitive cloud-based BI platform market.
- Key segments are subscription services and professional services driving recurring revenue.
- Cloud-based platform enables real-time data insights, integrating mobile and enterprise systems.
Figma, Inc. vs Domo, Inc. Positioning
Figma’s approach centers on diversified design software solutions with AI integration, while Domo concentrates on cloud-based business intelligence with subscription focus. Figma benefits from broader product scope but faces intense competition; Domo’s focused model supports recurring revenues but limits diversification.
Which has the best competitive advantage?
Domo demonstrates a very favorable moat with growing ROIC and value creation, indicating a durable competitive advantage. Figma shows a very unfavorable moat with declining ROIC, suggesting value erosion and weaker competitive positioning.
Stock Comparison
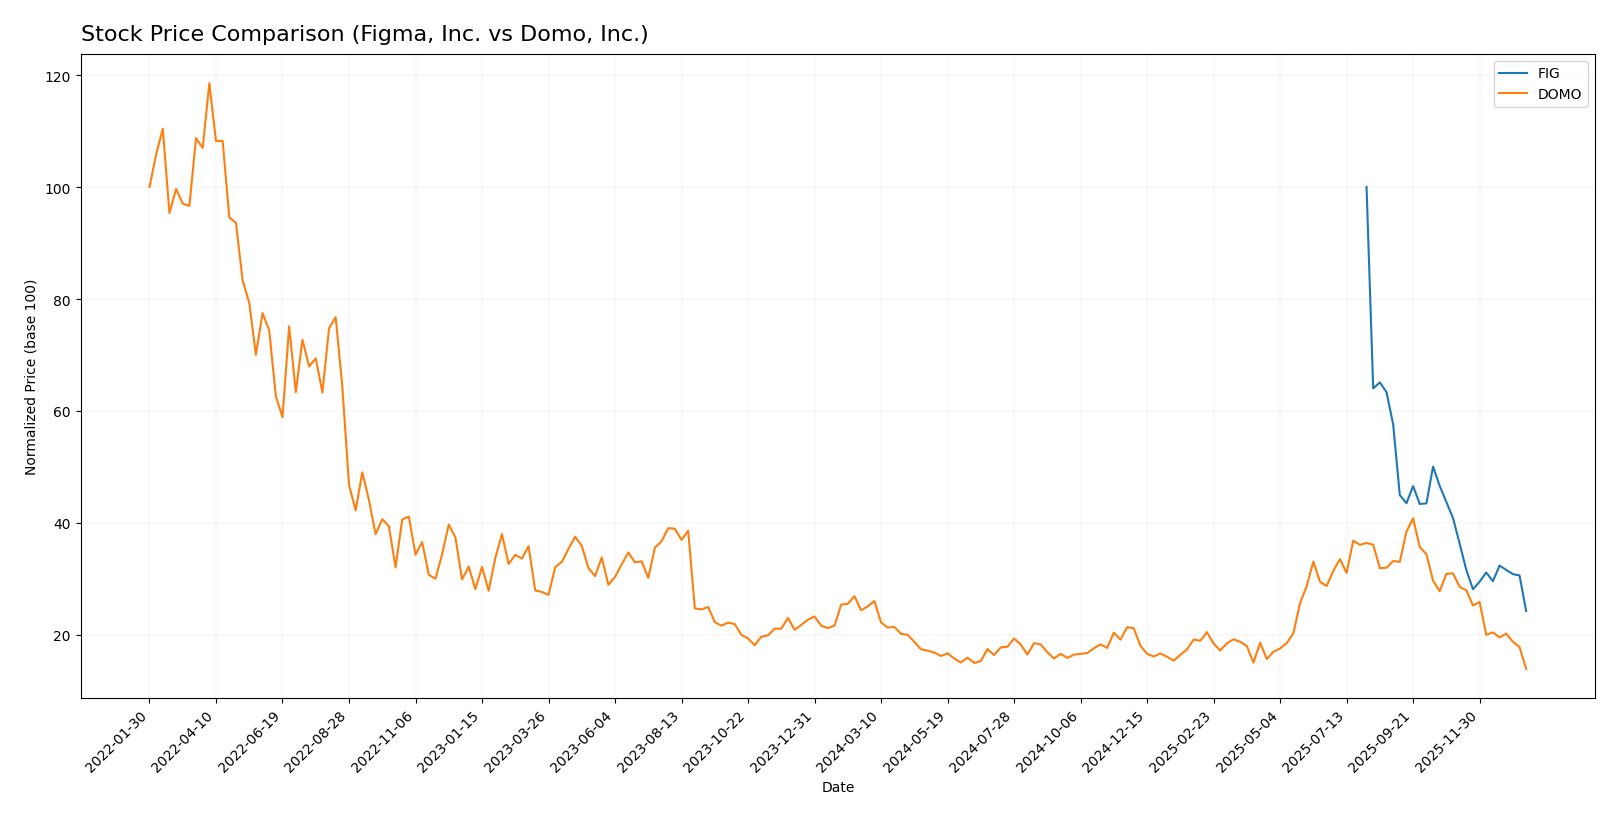
The stock price chart highlights significant bearish trends for both Figma, Inc. (FIG) and Domo, Inc. (DOMO) over the past 12 months, with notable price declines and differing acceleration patterns.
Trend Analysis
Figma, Inc. (FIG) experienced a steep bearish trend over the past year with a price decline of -75.76%, showing acceleration in the downward movement and high volatility with a standard deviation of 19.95. The stock hit a high of 122.0 and a low of 29.57.
Domo, Inc. (DOMO) also faced a bearish trend with a -44.54% price decrease, but the decline is decelerating and accompanied by lower volatility at a 3.01 standard deviation. Its price ranged between 18.06 and 6.15 over the year.
Comparing both, FIG’s stock suffered the largest market depreciation, indicating the weakest performance relative to DOMO, which, despite its loss, shows signs of slowing decline.
Target Prices
Analysts present a cautiously optimistic consensus on target prices for Figma, Inc. and Domo, Inc.
| Company | Target High | Target Low | Consensus |
|---|---|---|---|
| Figma, Inc. | 52 | 38 | 43.6 |
| Domo, Inc. | 13 | 10 | 11.5 |
The consensus target prices for Figma and Domo suggest potential upside from current prices of $29.57 and $6.15 respectively, reflecting moderate growth expectations by analysts.
Analyst Opinions Comparison
This section compares analysts’ ratings and grades for Figma, Inc. and Domo, Inc.:
Rating Comparison
Figma, Inc. Rating
- Rating: C+, evaluated as very favorable overall.
- Discounted Cash Flow Score: 4, indicating favorable.
- ROE Score: 1, assessed as very unfavorable.
- ROA Score: 1, very unfavorable performance.
- Debt To Equity Score: 4, favorable financial stability.
- Overall Score: 2, moderate standing.
Domo, Inc. Rating
- Rating: C, also considered very favorable overall.
- Discounted Cash Flow Score: 1, marked very unfavorable.
- ROE Score: 5, highly favorable rating.
- ROA Score: 1, similarly very unfavorable.
- Debt To Equity Score: 1, very unfavorable risk level.
- Overall Score: 2, also moderate standing.
Which one is the best rated?
Figma and Domo share the same overall score of 2, indicating moderate performance. Figma scores better in discounted cash flow and debt-to-equity, while Domo excels in return on equity. Both show weaknesses in return on assets.
Scores Comparison
Here is a comparison of the financial scores for Figma, Inc. and Domo, Inc.:
FIG Scores
- Altman Z-Score: 14.34, indicating a safe zone with low bankruptcy risk.
- Piotroski Score: 4, representing an average financial strength.
DOMO Scores
- Altman Z-Score: -10.10, indicating distress zone and high bankruptcy risk.
- Piotroski Score: 3, indicating very weak financial strength.
Which company has the best scores?
Based on the provided data, Figma, Inc. has significantly better scores with a safe zone Altman Z-Score and an average Piotroski Score. Domo, Inc. shows distress in the Altman Z-Score and very weak Piotroski Score.
Grades Comparison
Here is a comparison of recent grades assigned by reputable financial institutions for Figma, Inc. and Domo, Inc.:
Figma, Inc. Grades
The following table summarizes recent grades from major grading companies for Figma, Inc.:
| Grading Company | Action | New Grade | Date |
|---|---|---|---|
| Morgan Stanley | Maintain | Equal Weight | 2026-01-15 |
| Wells Fargo | Upgrade | Overweight | 2026-01-08 |
| RBC Capital | Maintain | Sector Perform | 2026-01-05 |
| Goldman Sachs | Maintain | Neutral | 2025-11-07 |
| JP Morgan | Maintain | Neutral | 2025-11-06 |
| Piper Sandler | Maintain | Overweight | 2025-11-06 |
| Wells Fargo | Maintain | Equal Weight | 2025-11-05 |
| Wells Fargo | Maintain | Equal Weight | 2025-09-04 |
| Morgan Stanley | Maintain | Equal Weight | 2025-09-04 |
| RBC Capital | Maintain | Sector Perform | 2025-09-04 |
Figma’s grades mainly reflect a stable outlook with multiple “Equal Weight” and “Neutral” ratings, along with some “Overweight” signals.
Domo, Inc. Grades
The following table presents recent grades from respected grading firms for Domo, Inc.:
| Grading Company | Action | New Grade | Date |
|---|---|---|---|
| DA Davidson | Maintain | Neutral | 2025-12-05 |
| TD Cowen | Maintain | Buy | 2025-12-05 |
| Lake Street | Maintain | Hold | 2025-12-05 |
| DA Davidson | Maintain | Neutral | 2025-12-01 |
| JMP Securities | Maintain | Market Outperform | 2025-09-10 |
| DA Davidson | Maintain | Neutral | 2025-08-28 |
| Cantor Fitzgerald | Maintain | Overweight | 2025-08-28 |
| TD Cowen | Upgrade | Buy | 2025-08-26 |
| JMP Securities | Maintain | Market Outperform | 2025-06-25 |
| Cantor Fitzgerald | Maintain | Overweight | 2025-06-25 |
Domo’s ratings show a generally positive trend with a preponderance of “Buy,” “Overweight,” and “Market Outperform” grades.
Which company has the best grades?
Domo, Inc. has received a stronger consensus with more “Buy” and “Market Outperform” ratings, while Figma, Inc. mostly holds “Equal Weight” and “Neutral” grades. This pattern may influence investors to perceive Domo as having a more favorable outlook.
Strengths and Weaknesses
Below is a comparison of key strengths and weaknesses for Figma, Inc. (FIG) and Domo, Inc. (DOMO) based on the most recent financial and operational data.
| Criterion | Figma, Inc. (FIG) | Domo, Inc. (DOMO) |
|---|---|---|
| Diversification | Limited product segmentation; primarily design tools | Mostly subscription-based with growing professional services |
| Profitability | Negative net margin (-97.7%), ROIC and ROE unfavorable; value destroying | Improving profitability; ROIC 194.7%, ROE 46.2%; value creating |
| Innovation | Struggling to maintain profitability suggests innovation challenges | Demonstrates durable competitive advantage and innovation |
| Global presence | Not explicitly detailed; financial struggles indicate limited scale | Expanding subscription revenue globally, strong market presence |
| Market Share | Challenged by financial losses and declining ROIC | Growing revenues and asset turnover signal increasing market share |
Key takeaway: Domo, Inc. shows a clear competitive advantage with strong profitability and growth trends, while Figma, Inc. faces significant profitability and value creation challenges that require caution for investors.
Risk Analysis
Below is a comparative risk assessment table for Figma, Inc. (FIG) and Domo, Inc. (DOMO) based on the most recent financial data and market conditions in 2026:
| Metric | Figma, Inc. (FIG) | Domo, Inc. (DOMO) |
|---|---|---|
| Market Risk | High volatility (beta: -3.8, wide price range) | Moderate volatility (beta: 1.65) |
| Debt level | Very low debt (D/E: 0.02, debt/assets: 1.6%) | High debt burden (debt/assets: 63.2%) |
| Regulatory Risk | Moderate (US tech sector, evolving data/privacy laws) | Moderate (US and international presence) |
| Operational Risk | Moderate (scale: 1,646 employees, new AI tools) | Moderate-high (smaller scale, 888 employees) |
| Environmental Risk | Low (software industry, minimal physical footprint) | Low (software/cloud platform) |
| Geopolitical Risk | Moderate (US-based, global user base) | Moderate (US and Japan focus) |
Figma faces significant market risk given its highly volatile beta and recent severe negative profitability metrics, which could impact investor confidence. Domo is burdened by a high debt level and distress financial scores, increasing financial risk despite some operational strengths. Both companies share moderate regulatory and geopolitical risks typical of the tech sector. Investors should weigh Figma’s volatility and Domo’s leverage as the most impactful risks in 2026.
Which Stock to Choose?
Figma, Inc. (FIG) shows a mixed financial profile with a strong revenue growth of 48.36% in 2024 but unfavorable profitability metrics, including a -97.74% net margin and a negative return on equity of -55.29%. Its debt levels remain low and manageable, supported by a favorable debt-to-equity ratio of 0.02, yet the overall financial ratios are mostly unfavorable. The company holds a very favorable rating of C+ but demonstrates a very unfavorable economic moat with declining ROIC below its WACC, signaling value destruction.
Domo, Inc. (DOMO) experiences a slight revenue decline of -0.61% in 2025 and faces ongoing profitability challenges, with a -25.84% net margin but favorable return on equity at 46.23% and a strong ROIC significantly above WACC. Its financial ratios present a neutral picture, balancing favorable and unfavorable aspects, though liquidity is weak with a current ratio of 0.56. Domo’s rating is very favorable at C, and its economic moat is assessed as very favorable, reflecting growing profitability and value creation.
Investors prioritizing value creation and a durable competitive advantage may find Domo’s profile more favorable, given its very favorable economic moat and balanced ratios despite short-term income setbacks. Conversely, those focused on revenue growth and capital stability might interpret Figma’s strong sales momentum and lower debt as positive, albeit with caution due to its unfavorable profitability and declining MOAT. The choice could thus vary significantly depending on an investor’s risk tolerance and strategic focus.
Disclaimer: Investment carries a risk of loss of initial capital. The past performance is not a reliable indicator of future results. Be sure to understand risks before making an investment decision.
Go Further
I encourage you to read the complete analyses of Figma, Inc. and Domo, Inc. to enhance your investment decisions: