Home > Comparison > Consumer Cyclical > YUM vs DPZ
The strategic rivalry between Yum! Brands, Inc. and Domino’s Pizza, Inc. shape the fast-food restaurant sector’s evolution. Yum! operates a diversified portfolio of global quick-service brands, while Domino’s specializes in a technology-driven pizza delivery model. This head-to-head highlights a clash between broad market presence and focused innovation. This analysis will determine which company’s operational strategy delivers a superior risk-adjusted return for diversified investors seeking exposure to consumer cyclical trends.
Table of contents
Companies Overview
Yum! Brands and Domino’s Pizza stand as key players shaping the global quick-service restaurant landscape.
Yum! Brands, Inc.: Global Quick-Service Restaurant Leader
Yum! Brands dominates the quick-service restaurant sector with four major brands: KFC, Taco Bell, Pizza Hut, and The Habit Burger Grill. Its core revenue engine lies in franchising and operating these global outlets. In 2021, the company’s strategic focus centered on expanding its footprint across 157 countries while reinforcing brand differentiation and digital ordering capabilities.
Domino’s Pizza, Inc.: Focused Pizza Delivery Innovator
Domino’s Pizza leads primarily in pizza delivery and carryout services, operating about 18,800 stores across 90 markets. Its revenue model balances company-owned stores and franchises with an emphasis on technology-driven ordering platforms. By 2022, Domino’s sharpened its competitive edge through supply chain efficiencies and digital innovation to boost customer convenience and delivery speed.
Strategic Collision: Similarities & Divergences
Both companies prioritize franchising and digital innovation but differ in scope and product diversity. Yum! Brands targets a diversified portfolio across multiple cuisines with a broad global reach. Domino’s relies on a focused pizza delivery model and technological leadership. Their primary battleground is consumer convenience in fast food. Investors find distinct profiles: broad-based global exposure versus niche-focused operational excellence.
Income Statement Comparison
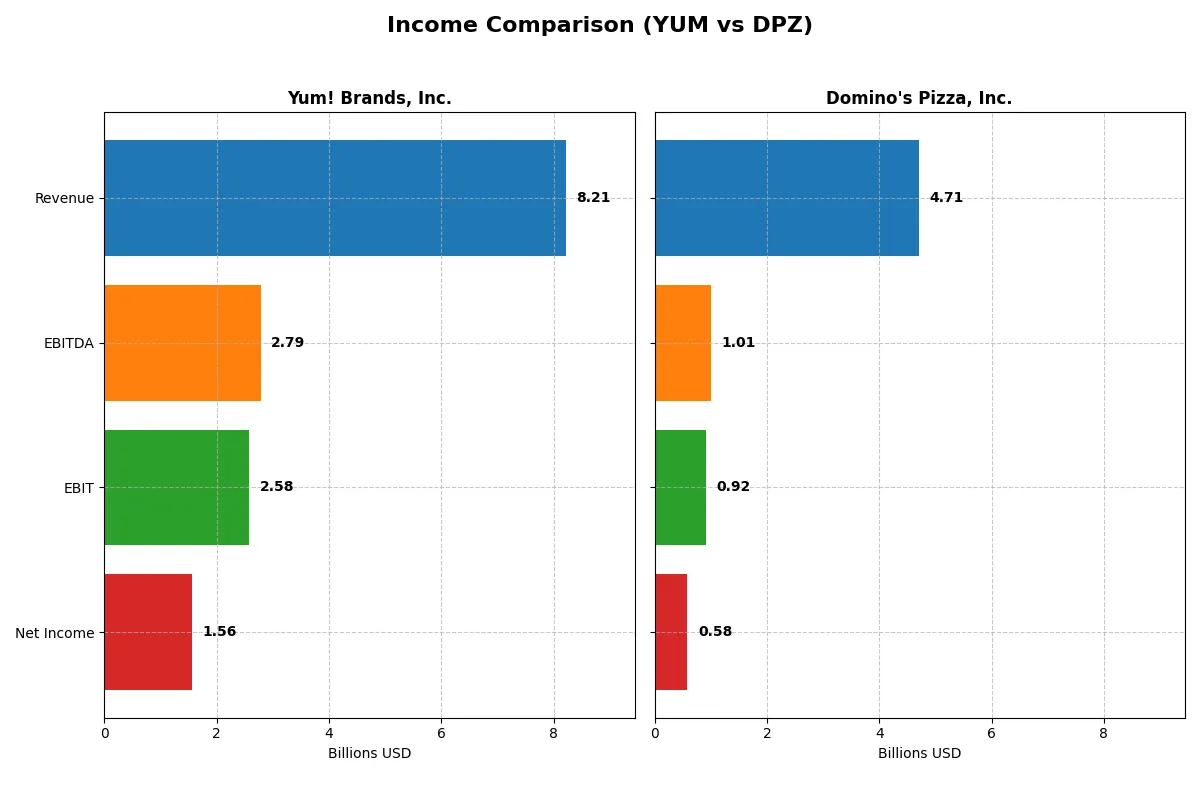
This data dissects the core profitability and scalability of both corporate engines to reveal who dominates the bottom line:
| Metric | Yum! Brands, Inc. (YUM) | Domino’s Pizza, Inc. (DPZ) |
|---|---|---|
| Revenue | 8.21B | 4.71B |
| Cost of Revenue | 4.42B | 2.86B |
| Operating Expenses | 1.26B | 970M |
| Gross Profit | 3.79B | 1.85B |
| EBITDA | 2.79B | 1.01B |
| EBIT | 2.58B | 918M |
| Interest Expense | 500M | 196M |
| Net Income | 1.56B | 584M |
| EPS | 5.59 | 16.82 |
| Fiscal Year | 2025 | 2024 |
Income Statement Analysis: The Bottom-Line Duel
This income statement comparison reveals how each company translates revenue into profit, exposing their operational efficiency and margin strength.
Yum! Brands, Inc. Analysis
Yum! Brands grew revenue steadily from 6.58B in 2021 to 8.21B in 2025, with net income fluctuating around 1.55B recently. Gross margins hover favorably near 46%, showing robust cost control. Despite a slight net margin contraction, Yum! maintains a strong EBIT margin above 31%, indicating operational efficiency and resilient momentum in 2025.
Domino’s Pizza, Inc. Analysis
Domino’s revenue rose from 4.12B in 2020 to 4.71B in 2024, with net income climbing consistently to 584M. Gross margin at 39.3% and EBIT margin near 19.5% reflect solid but lower profitability than Yum! Domino’s enjoys steady net margin improvement and accelerating EPS growth, showcasing effective scaling and margin expansion through 2024.
Margin Power vs. Revenue Scale
Yum! Brands leads in revenue size and margin dominance, boasting higher gross and EBIT margins. Domino’s counters with sharper net income growth and EPS expansion despite smaller scale. For investors, Yum! offers stable margin strength, while Domino’s appeals with higher momentum and profitability improvement potential.
Financial Ratios Comparison
These vital ratios act as a diagnostic tool to expose the underlying fiscal health, valuation premiums, and capital efficiency of these companies:
| Ratios | Yum! Brands, Inc. (YUM) | Domino’s Pizza, Inc. (DPZ) |
|---|---|---|
| ROE | -21.3% | -14.7% |
| ROIC | 28.3% | 54.1% |
| P/E | 27.0 | 25.0 |
| P/B | -5.74 | -3.69 |
| Current Ratio | 1.35 | 0.56 |
| Quick Ratio | 1.35 | 0.52 |
| D/E | -1.63 | -1.31 |
| Debt-to-Assets | 145% | 299% |
| Interest Coverage | 5.06 | 4.49 |
| Asset Turnover | 1.00 | 2.71 |
| Fixed Asset Turnover | 5.12 | 9.20 |
| Payout Ratio | 50.6% | 35.9% |
| Dividend Yield | 1.88% | 1.44% |
| Fiscal Year | 2025 | 2024 |
Efficiency & Valuation Duel: The Vital Signs
Financial ratios act as a company’s DNA, exposing hidden risks and revealing operational strengths critical for investment decisions.
Yum! Brands, Inc.
Yum! Brands posts a robust net margin of 19%, signaling operational efficiency, yet its negative ROE at -21% signals shareholder equity challenges. The stock trades at a stretched P/E of 27, suggesting a premium valuation. Yum! returns value through a modest 1.9% dividend yield, reflecting a balanced approach between shareholder returns and reinvestment.
Domino’s Pizza, Inc.
Domino’s achieves a solid 12% net margin and a higher ROIC of 54%, highlighting efficient capital use despite a negative ROE near -15%. Its P/E ratio of 25 also shows an expensive valuation. Domino’s lacks a strong current ratio, indicating liquidity risk, and offers a 1.4% dividend yield, emphasizing steady shareholder payouts amid growth investments.
Premium Valuation vs. Operational Efficiency
Yum! Brands balances operational margins with moderate dividends but faces equity returns headwinds. Domino’s excels in capital efficiency but struggles with liquidity. Yum!’s profile suits investors seeking stability with income; Domino’s appeals to those prioritizing capital efficiency despite higher risk.
Which one offers the Superior Shareholder Reward?
I observe Yum! Brands (YUM) pays a higher dividend yield (~1.88% in 2025) with a payout ratio near 50%, reflecting strong free cash flow coverage and a balanced distribution approach. Domino’s Pizza (DPZ) offers a slightly lower yield (~1.44%) and a modest payout ratio (~36%), but its larger share repurchase program delivers substantial total returns. YUM’s buyback intensity is moderate but consistent, supporting sustainability. DPZ’s aggressive buybacks amplify returns but pressure liquidity, signaled by a weaker current ratio (~0.56 vs. YUM’s 1.35). I conclude Yum! Brands offers a more sustainable, superior total shareholder reward in 2026 due to its robust dividend backed by stable free cash flow and prudent capital allocation.
Comparative Score Analysis: The Strategic Profile
The radar chart reveals the fundamental DNA and trade-offs of Yum! Brands and Domino’s Pizza, highlighting their distinct financial strengths and weaknesses:
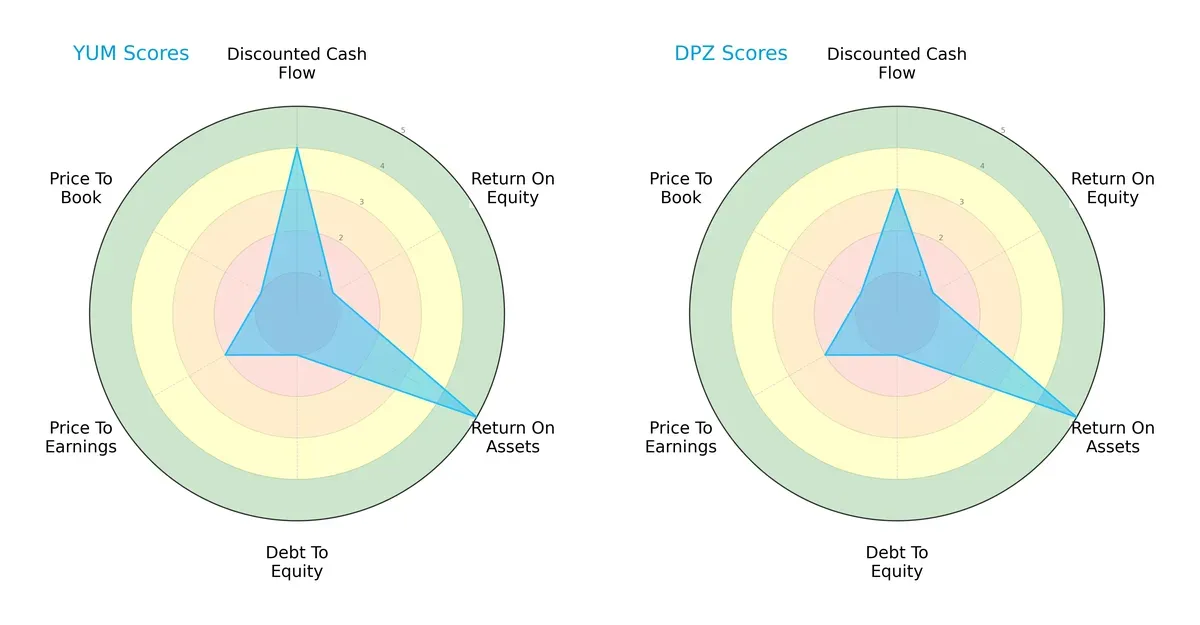
Yum! Brands scores higher on discounted cash flow (4 vs. 3) but struggles on return on equity and debt-to-equity (both 1). Domino’s matches Yum! on ROE (1) and ROA (5) but has a slightly lower DCF score. Both show weak valuation metrics (PE and PB scores of 2 and 1). Domino’s offers a more balanced risk profile, while Yum! leans heavily on cash flow strength.
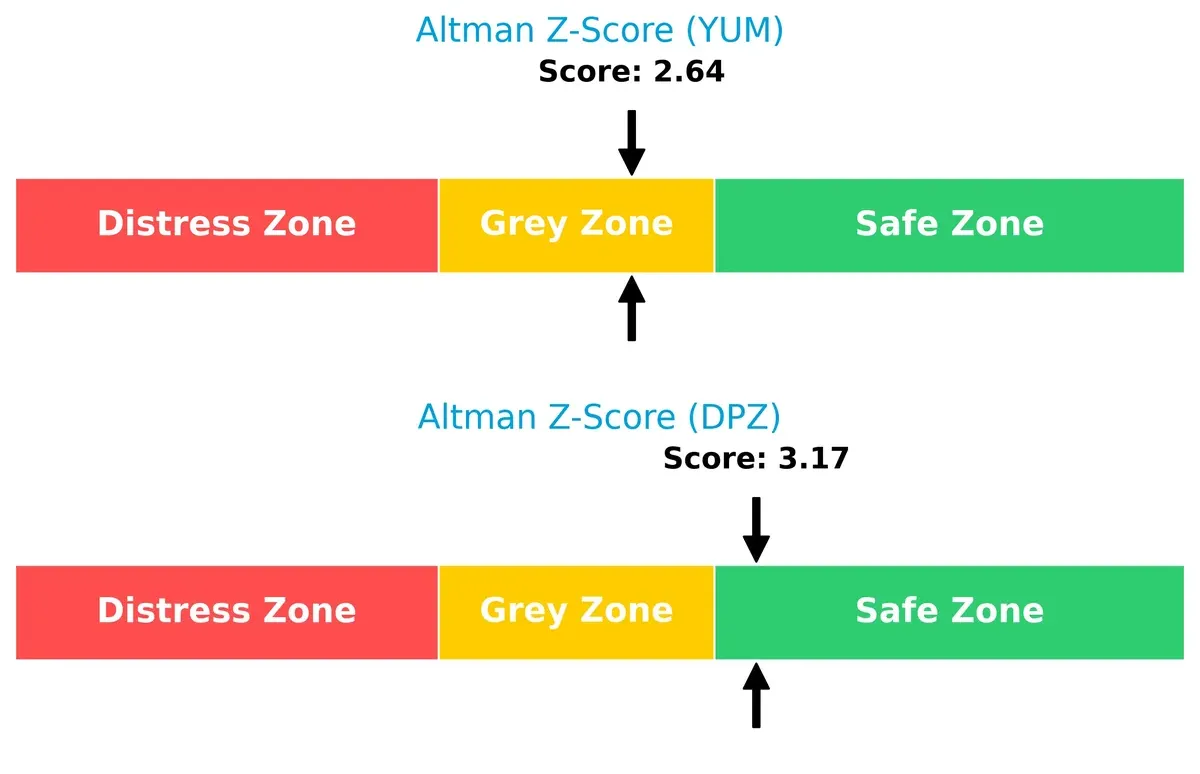
Bankruptcy Risk: Solvency Showdown
Domino’s Altman Z-Score of 3.17 places it safely above the distress threshold, suggesting robust solvency. Yum!’s 2.64 score lands in the grey zone, indicating moderate bankruptcy risk within this cycle:
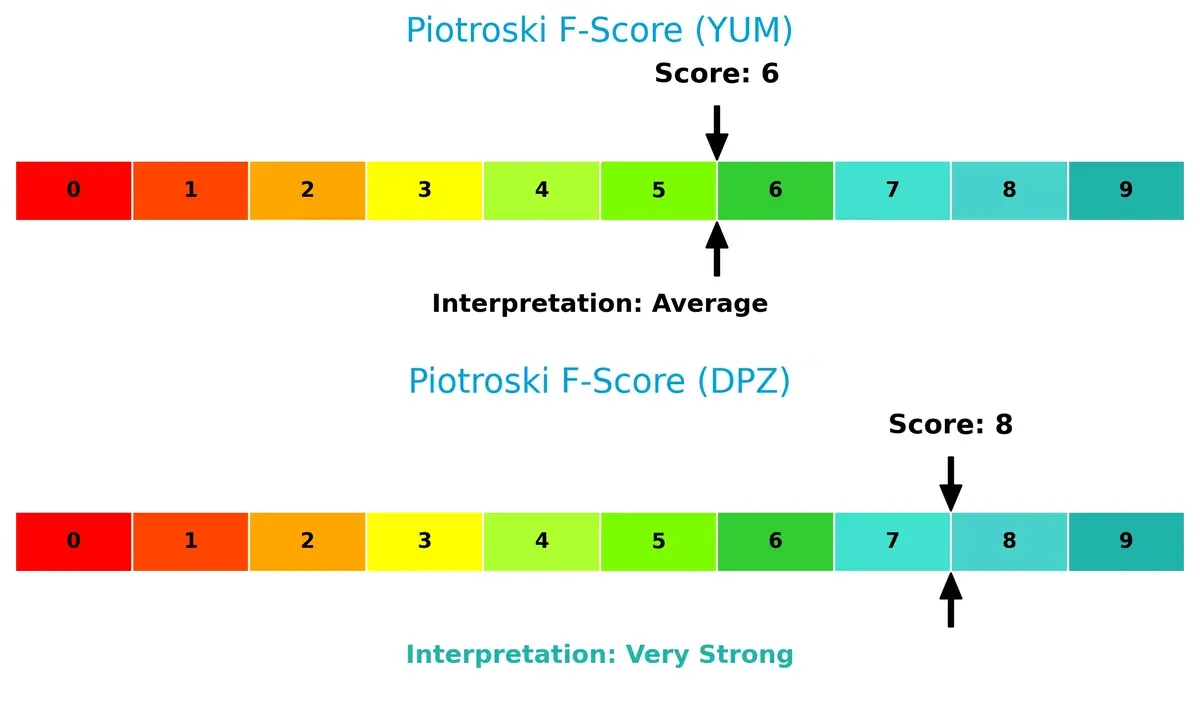
Financial Health: Quality of Operations
Domino’s Piotroski F-Score of 8 signals very strong financial health, reflecting efficient operations and solid fundamentals. Yum!’s score of 6 is average, raising caution about some internal weaknesses compared to Domino’s:
How are the two companies positioned?
This section dissects the operational DNA of Yum and Domino’s by comparing their revenue distribution by segment alongside their internal strengths and weaknesses. The final objective is to confront their economic moats and identify which business model delivers the most resilient competitive advantage today.
Revenue Segmentation: The Strategic Mix
This visual comparison dissects how Yum! Brands and Domino’s Pizza diversify their income streams and where their primary sector bets lie:
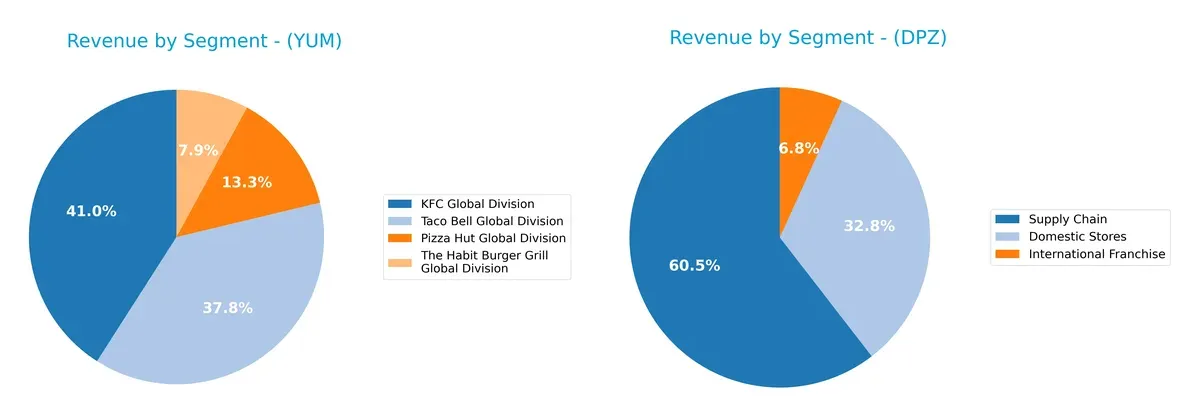
Yum! Brands displays a well-balanced portfolio with KFC at $3.1B, Taco Bell close behind at $2.86B, and Pizza Hut at $1.01B. Domino’s leans heavily on Supply Chain revenues at $2.85B, overshadowing Domestic Stores at $1.54B and International Franchise at $320M. Yum! pivots on brand ecosystem diversity, reducing concentration risk. Domino’s anchors on infrastructure dominance, which may heighten vulnerability to supply disruptions.
Strengths and Weaknesses Comparison
This table compares the Strengths and Weaknesses of Yum! Brands, Inc. and Domino’s Pizza, Inc.:
YUM Strengths
- Diversified revenue from KFC, Taco Bell, Pizza Hut, and Habit Burger Grill
- Favorable net margin of 18.98%
- High ROIC of 28.26% well above WACC
- Strong asset and fixed asset turnover
- Favorable quick ratio and interest coverage
DPZ Strengths
- Strong ROIC at 54.1% surpassing WACC
- High asset and fixed asset turnover ratios
- Favorable net margin of 12.41%
- Favorable debt-to-equity ratio
- Diversified revenue from domestic stores, supply chain, and international franchise
YUM Weaknesses
- Negative return on equity at -21.28%
- High debt-to-assets ratio at 145.3%
- Unfavorable price-to-earnings ratio
- Negative price-to-book value
- Neutral current ratio signaling moderate liquidity
DPZ Weaknesses
- Negative return on equity at -14.74%
- Poor liquidity with low current and quick ratios
- Very high debt-to-assets ratio at 299.21%
- Unfavorable price-to-earnings ratio
- Interest coverage ratio only neutral
Yum! Brands shows strength in diversified global revenue streams and solid operating efficiency, but struggles with equity returns and elevated leverage. Domino’s Pizza exhibits superior returns on invested capital and turnover metrics but faces liquidity challenges and heavier indebtedness. Both companies must navigate these financial dynamics carefully to sustain competitive positioning.
The Moat Duel: Analyzing Competitive Defensibility
A structural moat is the only reliable shield protecting long-term profits from relentless competition erosion:
Yum! Brands, Inc.: Diversified Brand Moat
Yum! leverages strong intangible assets across KFC, Taco Bell, and Pizza Hut, reflected in a high ROIC vs. WACC at 22%. Margin stability supports its value creation, though ROIC decline signals caution. Expansion in emerging markets could deepen its moat in 2026.
Domino’s Pizza, Inc.: Delivery & Operational Efficiency Moat
Domino’s moat hinges on superior operational scale and technology-driven delivery, pushing ROIC over WACC by 46%. Its focused pizza niche contrasts Yum!’s brand breadth. Profitability remains robust despite a slight ROIC dip, with innovation in digital ordering enhancing growth prospects.
Brand Diversification vs. Delivery Efficiency: The Moat Face-off
Domino’s wider moat stems from exceptional capital efficiency and tech-enabled scale; Yum! holds a broader but less sharply defended brand portfolio. Domino’s better withstands disruption and is stronger positioned to defend market share through 2026.
Which stock offers better returns?
The past year reveals contrasting price dynamics: Yum! Brands rallies with steady acceleration and moderate volatility, while Domino’s Pizza declines amid decelerating losses and elevated price swings.
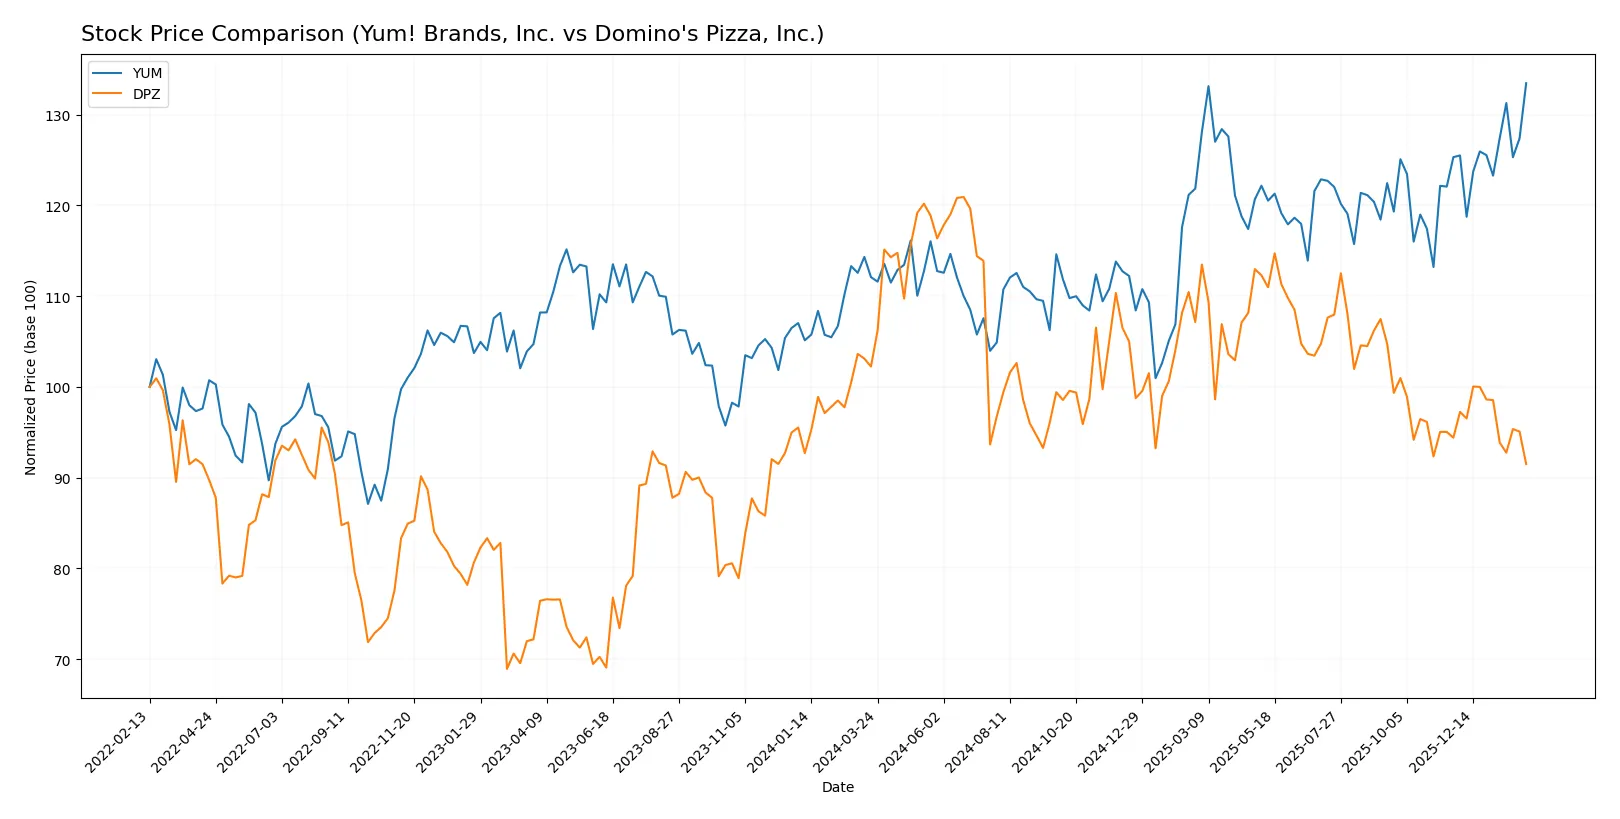
Trend Comparison
Yum! Brands, Inc. posts a 19.07% price gain over 12 months, marking a bullish trend with accelerating momentum and a standard deviation of 8.64. The stock’s range spans from 123.25 to 162.93.
Domino’s Pizza, Inc. suffers a 10.5% loss over the same period, confirming a bearish trend with deceleration and a high standard deviation of 33.53. Prices fluctuated between 394.88 and 521.83.
Yum! Brands outperforms Domino’s Pizza by delivering positive returns and accelerating gains versus Domino’s prolonged decline and higher volatility over the past year.
Target Prices
Analysts present a strong bullish consensus for Yum! Brands and Domino’s Pizza, reflecting confidence in their growth trajectories.
| Company | Target Low | Target High | Consensus |
|---|---|---|---|
| Yum! Brands, Inc. | 158 | 185 | 170.85 |
| Domino’s Pizza, Inc. | 370 | 535 | 463.33 |
The target consensus for Yum! Brands sits above its current price of $162.93, signaling upside potential. Domino’s Pizza’s consensus target exceeds its $394.88 trading price significantly, indicating strong expected appreciation.

Don’t Let Luck Decide Your Entry Point
Optimize your entry points with our advanced ProRealTime indicators. You’ll get efficient buy signals with precise price targets for maximum performance. Start outperforming now!
How do institutions grade them?
Yum! Brands, Inc. Grades
This table summarizes recent institutional grades for Yum! Brands, Inc.
| Grading Company | Action | New Grade | Date |
|---|---|---|---|
| TD Cowen | Maintain | Buy | 2026-02-05 |
| Wells Fargo | Maintain | Equal Weight | 2026-02-05 |
| Citigroup | Maintain | Neutral | 2026-02-05 |
| Citigroup | Maintain | Neutral | 2026-01-22 |
| Morgan Stanley | Maintain | Equal Weight | 2026-01-20 |
| Gordon Haskett | Upgrade | Buy | 2026-01-08 |
| Barclays | Maintain | Overweight | 2026-01-07 |
| Oppenheimer | Downgrade | Perform | 2026-01-07 |
| TD Cowen | Upgrade | Buy | 2025-11-17 |
| Evercore ISI Group | Upgrade | Outperform | 2025-11-05 |
Domino’s Pizza, Inc. Grades
This table presents recent institutional grades for Domino’s Pizza, Inc.
| Grading Company | Action | New Grade | Date |
|---|---|---|---|
| Guggenheim | Maintain | Neutral | 2026-01-28 |
| Wells Fargo | Maintain | Equal Weight | 2026-01-22 |
| Morgan Stanley | Downgrade | Equal Weight | 2026-01-20 |
| Evercore ISI Group | Maintain | Outperform | 2026-01-08 |
| Stifel | Maintain | Buy | 2026-01-07 |
| Barclays | Maintain | Underweight | 2026-01-07 |
| TD Cowen | Downgrade | Hold | 2026-01-05 |
| BTIG | Maintain | Buy | 2025-11-14 |
| RBC Capital | Maintain | Sector Perform | 2025-10-15 |
| B of A Securities | Maintain | Buy | 2025-10-15 |
Which company has the best grades?
Yum! Brands holds stronger recent upgrades and more Buy and Outperform ratings. Domino’s faces downgrades and some Underweight grades. Investors may see Yum! Brands as favored by analysts currently.
Risks specific to each company
The following categories identify critical pressure points and systemic threats facing Yum! Brands, Inc. and Domino’s Pizza, Inc. in the 2026 market environment:
1. Market & Competition
Yum! Brands, Inc.
- Operates diverse global brands, facing intense fast-food competition worldwide.
Domino’s Pizza, Inc.
- Focused pizza delivery segment, highly competitive with innovation in digital ordering.
2. Capital Structure & Debt
Yum! Brands, Inc.
- High debt-to-assets ratio (145%), signaling leverage risk despite favorable interest coverage.
Domino’s Pizza, Inc.
- Extremely high debt-to-assets ratio (299%), indicating significant financial risk; current ratios are weak.
3. Stock Volatility
Yum! Brands, Inc.
- Beta 0.66 shows less sensitivity to market swings, offering relative stability.
Domino’s Pizza, Inc.
- Beta 1.17 suggests higher stock volatility and sensitivity to market fluctuations.
4. Regulatory & Legal
Yum! Brands, Inc.
- Exposed to global food safety and franchising regulations across 157 countries.
Domino’s Pizza, Inc.
- Faces stringent regulations in U.S. and international markets, especially delivery and labor laws.
5. Supply Chain & Operations
Yum! Brands, Inc.
- Complex supply chain managing multiple brands and diverse food categories globally.
Domino’s Pizza, Inc.
- Operations streamlined around pizza delivery with strong supply chain integration but less diversification.
6. ESG & Climate Transition
Yum! Brands, Inc.
- Large footprint demands aggressive ESG initiatives to meet climate goals and consumer expectations.
Domino’s Pizza, Inc.
- ESG efforts critical but less complex due to narrower product and geographic scope.
7. Geopolitical Exposure
Yum! Brands, Inc.
- Broad global presence exposes it to geopolitical risks in multiple volatile regions.
Domino’s Pizza, Inc.
- Exposure limited to 90 markets, reducing but not eliminating geopolitical risk.
Which company shows a better risk-adjusted profile?
Yum! Brands faces its biggest risk in its high leverage despite stable cash flow coverage. Domino’s largest risk is its precarious liquidity and overwhelming debt relative to assets. I see Yum! Brands as having a better risk-adjusted profile, supported by its lower beta and more balanced current ratio. Domino’s weaker liquidity and extremely high debt-to-assets ratio raise red flags, despite its operational focus and stronger Altman Z-Score.
Final Verdict: Which stock to choose?
Yum! Brands, Inc. wields unmatched operational efficiency, driving consistent value creation despite a declining profitability trend. Its robust capital allocation and strong cash flow underpin resilience. A point of vigilance remains its elevated leverage, which could pressure financial flexibility. Yum fits well within an Aggressive Growth portfolio seeking durable cash machines.
Domino’s Pizza, Inc. commands a strategic moat through superior asset turnover and a high return on invested capital, reflecting its operational excellence. It offers better liquidity risk management than Yum but exhibits a weaker current ratio. Domino’s suits a GARP portfolio, balancing attractive growth prospects with moderate safety.
If you prioritize operational efficiency and steady cash generation, Yum! Brands is the compelling choice due to its strong capital returns and income statement strength. However, if you seek a company with a pronounced strategic moat and better liquidity profiles, Domino’s offers better stability despite recent price weakness. Both present slightly favorable moats but require careful risk monitoring.
Disclaimer: Investment carries a risk of loss of initial capital. The past performance is not a reliable indicator of future results. Be sure to understand risks before making an investment decision.
Go Further
I encourage you to read the complete analyses of Yum! Brands, Inc. and Domino’s Pizza, Inc. to enhance your investment decisions: