Home > Comparison > Consumer Cyclical > SBUX vs DPZ
The strategic rivalry between Starbucks Corporation and Domino’s Pizza, Inc. shapes the competitive landscape of the global restaurant sector. Starbucks leads as a capital-intensive specialty coffee retailer with a vast global footprint. Domino’s stands out as a high-efficiency pizza delivery and franchising powerhouse. This analysis will assess which business model offers superior risk-adjusted returns, guiding investors toward the optimal choice for portfolio diversification in consumer cyclicals.

Table of contents
Companies Overview
Starbucks and Domino’s Pizza dominate the global foodservice industry with distinct consumer offerings and expansive footprints.
Starbucks Corporation: Specialty Coffee Pioneer
Starbucks leads as a roaster, marketer, and retailer of specialty coffee worldwide. Its core revenue derives from company-operated and licensed stores selling coffee beverages, packaged goods, and food items. In 2026, Starbucks focuses heavily on innovation within its three segments—North America, International, and Channel Development—strengthening brand loyalty and expanding its digital ecosystem.
Domino’s Pizza, Inc.: Global Pizza Delivery Leader
Domino’s excels as a pizza company with a vast network of company-owned and franchised stores. It generates revenue primarily through pizza sales and complementary menu items like sandwiches and desserts. In 2026, Domino’s centers its strategy on expanding international franchises and optimizing supply chain efficiencies to maintain rapid delivery and competitive pricing.
Strategic Collision: Similarities & Divergences
Both companies pursue growth via global store count increases but diverge sharply in customer engagement—Starbucks invests in a premium experience and product innovation, while Domino’s prioritizes a delivery-focused, value-driven model. Their battle for market share unfolds in the consumer discretionary space, balancing convenience against brand experience. Each presents a unique investment profile shaped by operational scale and strategic emphasis.
Income Statement Comparison
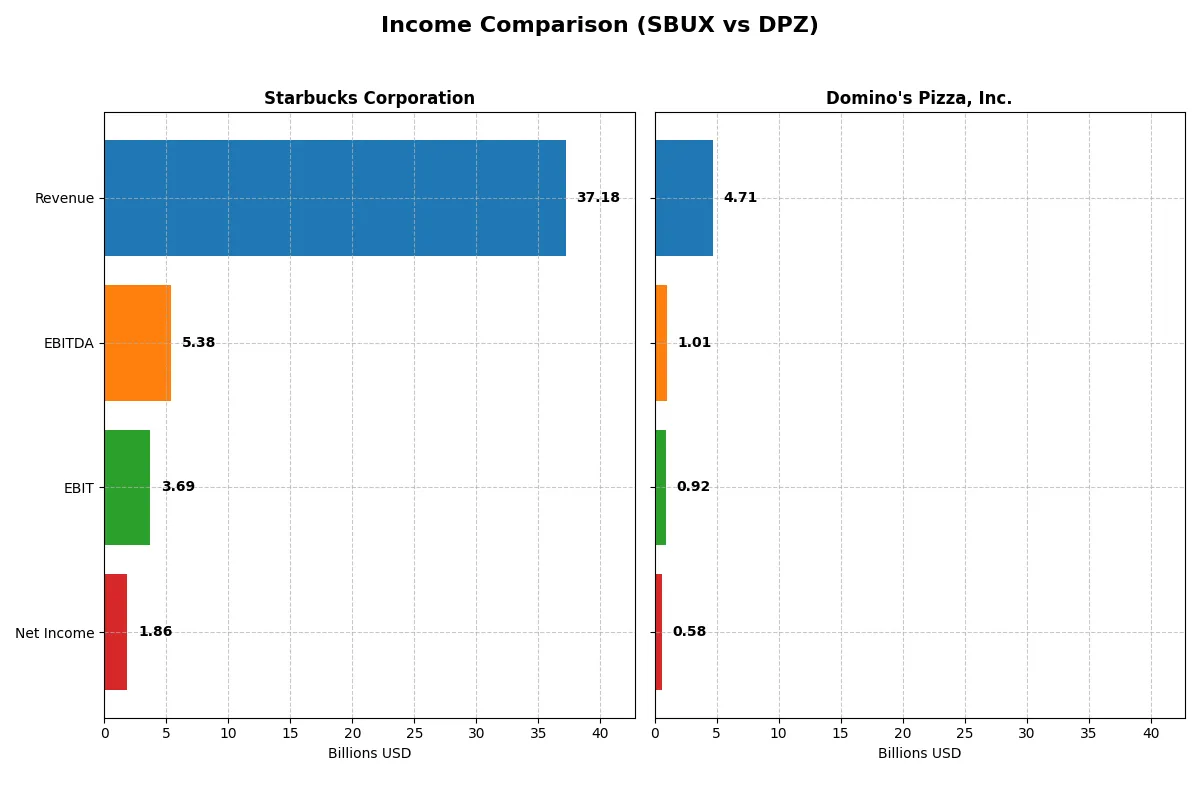
The following data dissects the core profitability and scalability of both corporate engines to reveal who dominates the bottom line:
| Metric | Starbucks Corporation (SBUX) | Domino’s Pizza, Inc. (DPZ) |
|---|---|---|
| Revenue | 37.2B | 4.71B |
| Cost of Revenue | 28.2B | 2.86B |
| Operating Expenses | 5.40B | 969M |
| Gross Profit | 8.98B | 1.85B |
| EBITDA | 5.38B | 1.01B |
| EBIT | 3.69B | 918M |
| Interest Expense | 543M | 196M |
| Net Income | 1.86B | 584M |
| EPS | 1.63 | 16.82 |
| Fiscal Year | 2025 | 2024 |
Income Statement Analysis: The Bottom-Line Duel
This income statement comparison reveals which company operates with greater efficiency and profitability in their core business.
Starbucks Corporation Analysis
Starbucks grew revenue from $29.1B in 2021 to $37.2B in 2025, a solid 28% increase. However, net income declined sharply over the same period, dropping from $4.2B to $1.9B in 2025. Gross margin remains favorable at 24.15%, but a 51.98% fall in net margin signals rising costs and weakening profitability. The latest year shows deteriorating margins and shrinking bottom-line momentum.
Domino’s Pizza, Inc. Analysis
Domino’s revenue expanded steadily from $4.1B in 2020 to $4.7B in 2024, a 14% rise. Net income increased 19% over five years, reaching $584M in 2024. Gross margin is robust at 39.28%, with net margin improving to 12.41%. Recent growth in EBIT (+8.15%) and EPS (+14.32%) highlights operational strength and effective cost control, underscoring positive momentum in profitability.
Margin Power vs. Revenue Scale
Domino’s delivers stronger margin expansion and consistent net income growth, unlike Starbucks, which faces margin compression despite higher revenue gains. Domino’s superior profitability metrics and expanding EPS make it the fundamental winner in efficiency and earnings quality. Investors favor companies with durable margin power over mere top-line scale.
Financial Ratios Comparison
These vital ratios act as a diagnostic tool to expose the underlying fiscal health, valuation premiums, and capital efficiency of these companies:
| Ratios | Starbucks Corporation (SBUX) | Domino’s Pizza, Inc. (DPZ) |
|---|---|---|
| ROE | -22.9% (2025) | -14.7% (2024) |
| ROIC | 8.5% (2025) | 54.1% (2024) |
| P/E | 52.6x (2025) | 25.0x (2024) |
| P/B | -12.1x (2025) | -3.7x (2024) |
| Current Ratio | 0.72 (2025) | 0.56 (2024) |
| Quick Ratio | 0.51 (2025) | 0.52 (2024) |
| D/E | -3.29 (2025) | -1.31 (2024) |
| Debt-to-Assets | 83.1% (2025) | 299.2% (2024) |
| Interest Coverage | 6.60x (2025) | 4.49x (2024) |
| Asset Turnover | 1.16 (2025) | 2.71 (2024) |
| Fixed Asset Turnover | 2.09 (2025) | 9.20 (2024) |
| Payout ratio | 149% (2025) | 36% (2024) |
| Dividend yield | 2.84% (2025) | 1.44% (2024) |
| Fiscal Year | 2025 | 2024 |
Efficiency & Valuation Duel: The Vital Signs
Ratios act as a company’s DNA, revealing hidden risks and operational excellence that guide investor decisions with clarity and precision.
Starbucks Corporation
Starbucks shows weak profitability with a negative ROE of -22.93% and a low net margin of 4.99%, signaling profit challenges. Its valuation appears stretched at a P/E of 52.58, reflecting high market expectations. The firm returns value through a 2.84% dividend yield, balancing modest shareholder rewards with reinvestment strategies.
Domino’s Pizza, Inc.
Domino’s posts a stronger net margin of 12.41% and a robust ROIC of 54.1%, indicating efficient capital use despite a negative ROE at -14.74%. The stock trades at a more moderate P/E of 25.01, suggesting fairer valuation. Dividend yield stands at 1.44%, complemented by a focus on growth and operational efficiency.
Premium Valuation vs. Operational Safety
Domino’s offers a better balance of profitability and valuation, with higher efficiency and a reasonable price. Starbucks’s stretched valuation and weak returns increase risk. Growth-focused investors may prefer Domino’s stable operational profile, while risk-tolerant investors might consider Starbucks’s dividend appeal.
Which one offers the Superior Shareholder Reward?
I compare Starbucks and Domino’s distribution strategies through dividend yields, payout ratios, and buyback intensity. Starbucks yields 2.8% with a payout ratio above 100%, signaling risk. Domino’s yields 1.4% with a conservative 36% payout, preserving cash for growth. Starbucks’ buybacks are modest compared to Domino’s aggressive repurchases, which boost total returns. Historically, Domino’s reinvests free cash flow more sustainably, balancing dividends and buybacks, while Starbucks risks over-distribution. I conclude Domino’s offers a superior total return profile in 2026 due to sustainable capital allocation and disciplined shareholder rewards.
Comparative Score Analysis: The Strategic Profile
The radar chart reveals the fundamental DNA and trade-offs of Starbucks Corporation and Domino’s Pizza, Inc., showcasing their core financial strengths and vulnerabilities:
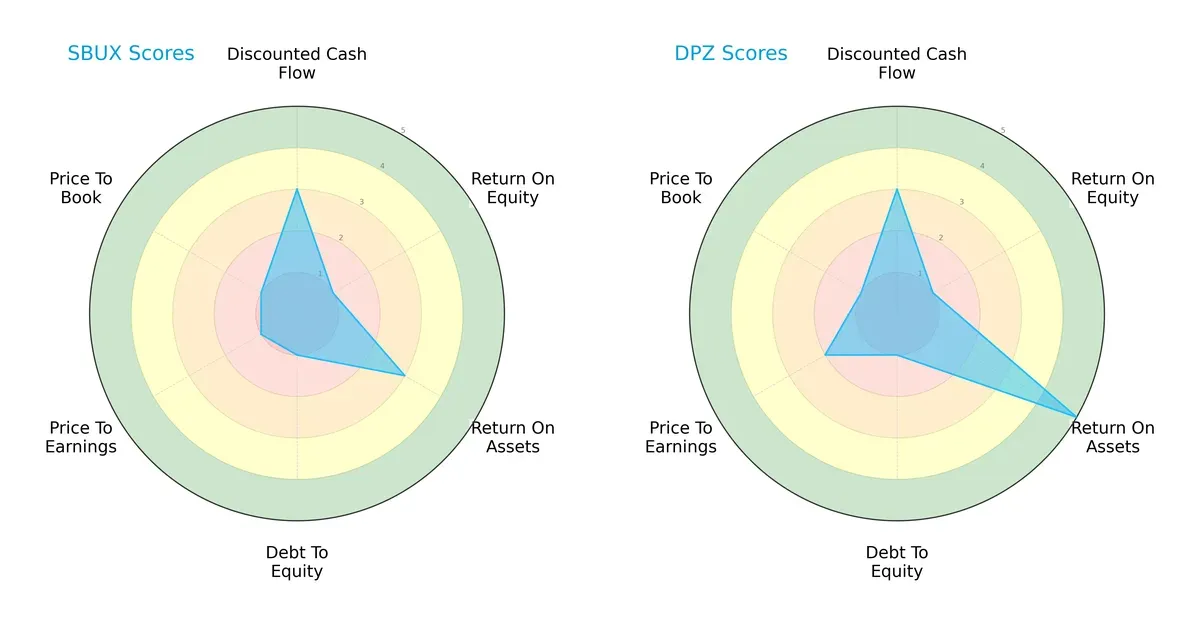
Domino’s Pizza exhibits a stronger asset utilization (ROA score 5 vs. 3) and better valuation (P/E score 2 vs. 1) than Starbucks. Both share moderate discounted cash flow scores (3) but suffer from weak return on equity (ROE score 1) and high leverage risks (debt/equity score 1). Starbucks shows a more balanced but overall weaker profile, relying less on asset efficiency and more vulnerable in valuation metrics, while Domino’s leverages operational efficiency as its key edge.
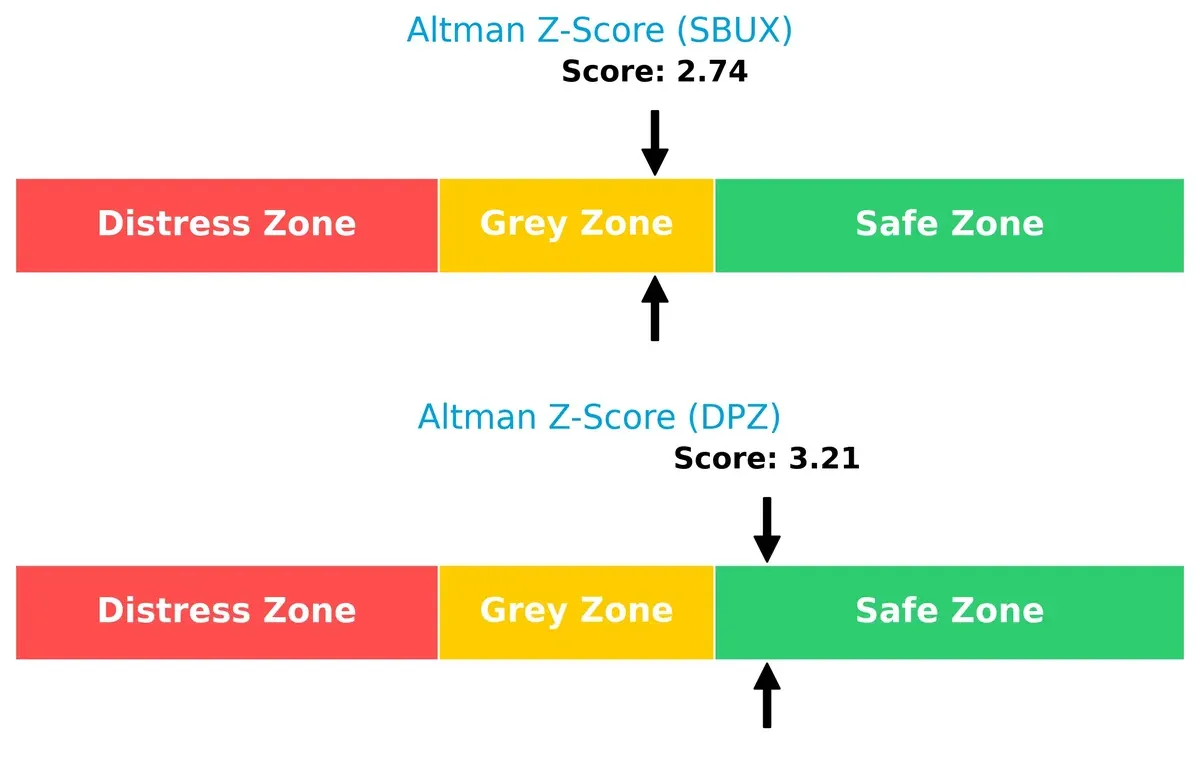
Bankruptcy Risk: Solvency Showdown
Domino’s Altman Z-Score of 3.21 places it safely above the distress threshold, signaling strong solvency. Starbucks lingers in a grey zone at 2.74, implying moderate bankruptcy risk in the current cycle:
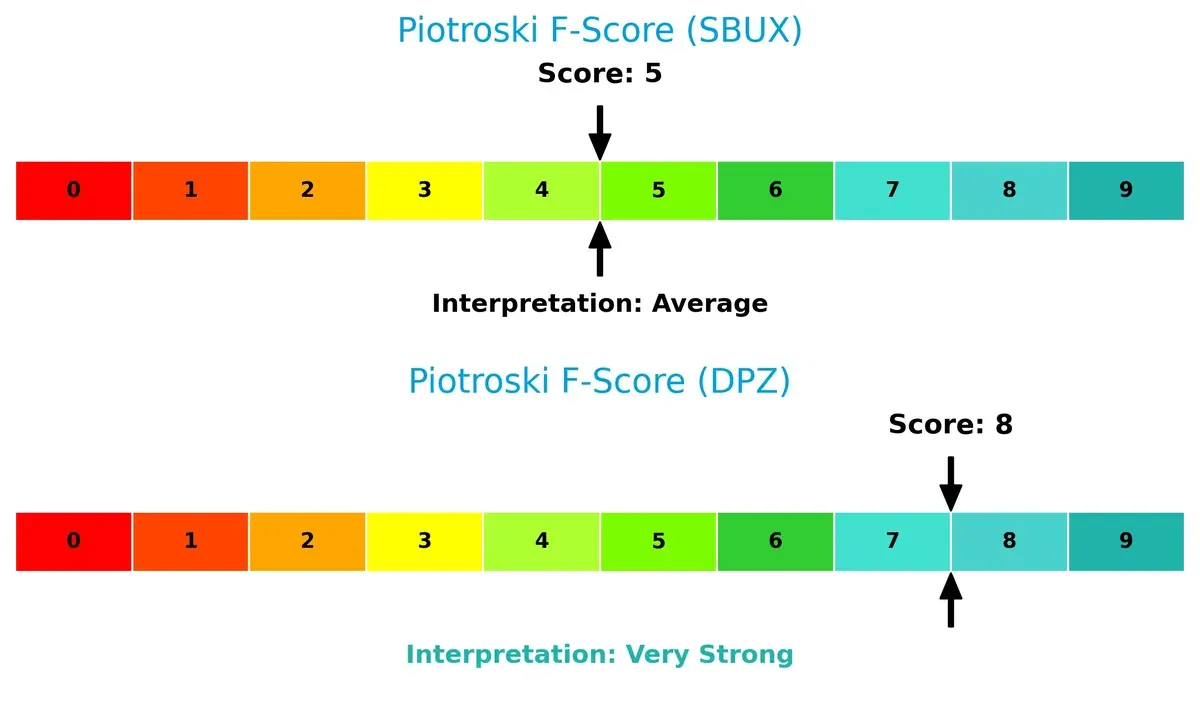
Financial Health: Quality of Operations
Domino’s Piotroski F-Score of 8 reflects robust financial health, signaling strong profitability and operational efficiency. Starbucks scores an average 5, raising red flags about its internal financial stability compared to its peer:
How are the two companies positioned?
This section dissects the operational DNA of Starbucks and Domino’s by comparing their revenue distribution and internal strengths and weaknesses. The goal is to confront their economic moats and identify which model offers the most resilient competitive advantage today.
Revenue Segmentation: The Strategic Mix
This visual comparison dissects how Starbucks Corporation and Domino’s Pizza, Inc. diversify income streams and where their primary sector bets lie:
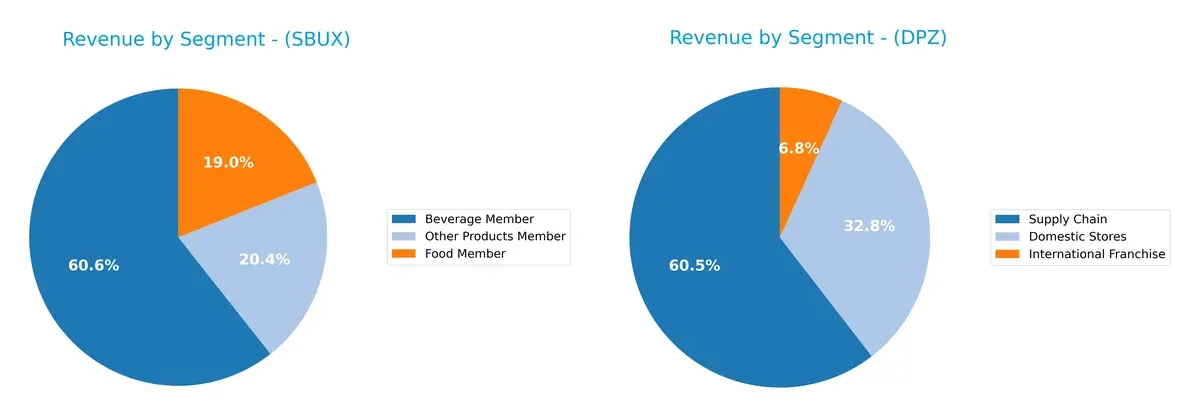
Starbucks anchors revenue in Beverage Member at $22.5B, with Food Member ($7.0B) and Other Products ($7.6B) diversifying the mix. Domino’s pivots on Supply Chain at $2.8B, but also relies heavily on Domestic Stores ($1.5B) and International Franchise ($319M). Starbucks shows broader diversification across categories, reducing concentration risk. Domino’s dependence on its supply chain signals infrastructure dominance but heightens exposure to operational disruptions.
Strengths and Weaknesses Comparison
This table compares the strengths and weaknesses of Starbucks and Domino’s based on diversification, profitability, financial statements, innovation, global presence, and market share:
Starbucks Strengths
- Diversified revenue across beverages, food, and other products
- Strong US market presence with $27B revenue
- WACC favorable at 7.21% supports cost-effective capital use
- High asset turnover at 1.16 indicates efficient asset use
- Favorable dividend yield at 2.84%
Domino’s Strengths
- High net margin at 12.41% shows strong profitability
- Excellent ROIC of 54.1% outperforms WACC significantly
- Favorable WACC at 7.62% and strong asset turnover at 2.71
- Diverse revenue streams from domestic stores, supply chain, and international franchise
- Superior fixed asset turnover at 9.2 reflects operational efficiency
Starbucks Weaknesses
- Negative ROE at -22.93% signals shareholder value erosion
- High debt to assets at 83.11% raises financial risk concerns
- Low current and quick ratios below 1 suggest liquidity pressure
- Unfavorable net margin at 4.99% limits profitability
- Elevated P/E of 52.58 may indicate overvaluation
Domino’s Weaknesses
- Negative ROE at -14.74% indicates challenges in generating equity returns
- Extremely high debt to assets at 299.21% heightens solvency risk
- Low current and quick ratios below 1 reflect liquidity stress
- Unfavorable P/E at 25.01 could suggest valuation concerns
- Interest coverage ratio only neutral at 4.69 limits debt servicing flexibility
Both companies show solid operational strengths, particularly in asset efficiency and diversification. However, liquidity and leverage metrics highlight significant financial risks requiring careful strategic management.
The Moat Duel: Analyzing Competitive Defensibility
A structural moat is the only reliable shield defending long-term profits from relentless competitive erosion in dynamic markets:
Starbucks Corporation: Brand & Experience Moat
Starbucks leverages strong brand loyalty and premium customer experience, reflected in steady margins despite revenue growth challenges. Expansion in China remains crucial but risks margin pressure in 2026.
Domino’s Pizza, Inc.: Operational Efficiency Moat
Domino’s moat lies in cost advantage through superior supply chain and technology-driven delivery. Its higher ROIC and margin expansion outperform Starbucks, with digital innovation deepening its edge in 2026.
Brand Loyalty vs. Operational Mastery
Domino’s possesses a wider and deeper moat, demonstrated by a superior ROIC over WACC and consistent profit growth. Starbucks faces margin headwinds and declining ROIC, making Domino’s better positioned to defend market share.
Which stock offers better returns?
Stock prices of Starbucks Corporation and Domino’s Pizza, Inc. have exhibited contrasting trajectories over the past year, highlighting distinct market dynamics and investor sentiment.
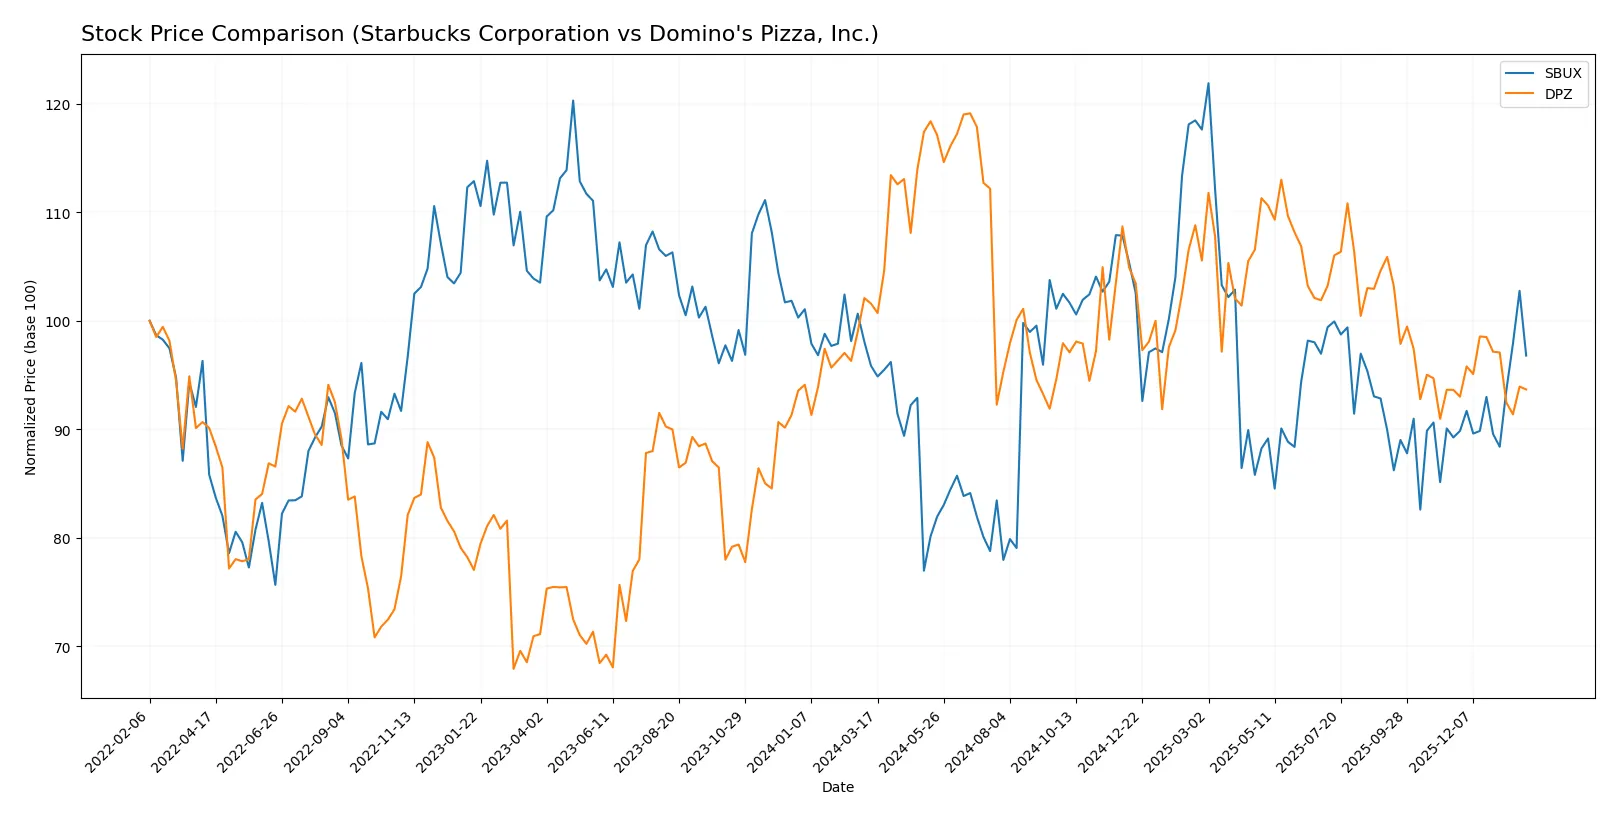
Trend Comparison
Starbucks stock shows a slight bullish trend with a 0.98% price increase over 12 months, accompanied by accelerating momentum and a moderate 8.86 volatility, peaking at 115.81 and bottoming at 73.11.
Domino’s Pizza stock declined 7.79% over the same period, reflecting a bearish trend with decelerating momentum and higher volatility at 33.07, ranging between 521.83 and 398.46.
Comparing both, Starbucks delivered superior market performance with positive price growth and acceleration, while Domino’s faced a significant price decline and deceleration.
Target Prices
Analysts project a mixed but generally optimistic outlook for Starbucks Corporation and Domino’s Pizza, Inc.
| Company | Target Low | Target High | Consensus |
|---|---|---|---|
| Starbucks Corporation | 90 | 165 | 107.47 |
| Domino’s Pizza, Inc. | 370 | 535 | 463.33 |
Starbucks’s consensus target sits modestly above its current price of $91.95, signaling moderate upside. Domino’s shows a stronger upside potential, with a target consensus well above its $410.33 market price.

Don’t Let Luck Decide Your Entry Point
Optimize your entry points with our advanced ProRealTime indicators. You’ll get efficient buy signals with precise price targets for maximum performance. Start outperforming now!
How do institutions grade them?
Starbucks Corporation Grades
The following table summarizes recent institutional grades for Starbucks Corporation.
| Grading Company | Action | New Grade | Date |
|---|---|---|---|
| BTIG | Maintain | Buy | 2026-01-30 |
| Piper Sandler | Maintain | Overweight | 2026-01-30 |
| Barclays | Maintain | Overweight | 2026-01-30 |
| TD Cowen | Maintain | Hold | 2026-01-30 |
| Wells Fargo | Maintain | Overweight | 2026-01-29 |
| BTIG | Maintain | Buy | 2026-01-29 |
| RBC Capital | Maintain | Outperform | 2026-01-29 |
| Wells Fargo | Maintain | Overweight | 2026-01-27 |
| Mizuho | Maintain | Neutral | 2026-01-26 |
| William Blair | Upgrade | Outperform | 2026-01-23 |
Domino’s Pizza, Inc. Grades
The following table summarizes recent institutional grades for Domino’s Pizza, Inc.
| Grading Company | Action | New Grade | Date |
|---|---|---|---|
| Guggenheim | Maintain | Neutral | 2026-01-28 |
| Wells Fargo | Maintain | Equal Weight | 2026-01-22 |
| Morgan Stanley | Downgrade | Equal Weight | 2026-01-20 |
| Evercore ISI Group | Maintain | Outperform | 2026-01-08 |
| Stifel | Maintain | Buy | 2026-01-07 |
| Barclays | Maintain | Underweight | 2026-01-07 |
| TD Cowen | Downgrade | Hold | 2026-01-05 |
| BTIG | Maintain | Buy | 2025-11-14 |
| RBC Capital | Maintain | Sector Perform | 2025-10-15 |
| B of A Securities | Maintain | Buy | 2025-10-15 |
Which company has the best grades?
Starbucks consistently receives higher and more positive grades, including multiple “Buy,” “Outperform,” and “Overweight” ratings. Domino’s shows mixed signals with downgrades and some neutral or underweight ratings. Starbucks’ stronger grades may suggest greater institutional confidence, potentially affecting investor sentiment and valuation positively.
Risks specific to each company
The following categories identify the critical pressure points and systemic threats facing both firms in the 2026 market environment:
1. Market & Competition
Starbucks Corporation
- Faces intense competition from global and local coffee chains; premium coffee market saturation limits growth.
Domino’s Pizza, Inc.
- Competes in a highly fragmented pizza delivery market; innovation and digital ordering drive competitive advantage.
2. Capital Structure & Debt
Starbucks Corporation
- High debt-to-assets ratio at 83.11% signals elevated leverage risk despite favorable interest coverage.
Domino’s Pizza, Inc.
- Extremely high debt-to-assets at 299.21% poses significant financial risk; weaker interest coverage than Starbucks.
3. Stock Volatility
Starbucks Corporation
- Beta near 0.96 indicates slightly lower volatility than the market, providing relative stability.
Domino’s Pizza, Inc.
- Beta above 1.15 signals higher stock price swings, reflecting greater market sensitivity and risk.
4. Regulatory & Legal
Starbucks Corporation
- Exposed to food safety, labor, and international trade regulations; litigation risk in multiple jurisdictions.
Domino’s Pizza, Inc.
- Subject to similar regulatory pressures; franchising model adds complexity to compliance and legal risks.
5. Supply Chain & Operations
Starbucks Corporation
- Global supply chain complexity risks disruptions; relies on premium coffee bean sourcing vulnerable to climate.
Domino’s Pizza, Inc.
- Supply chain concentrated on ingredients and packaging; efficient logistics critical to maintain delivery speed.
6. ESG & Climate Transition
Starbucks Corporation
- Faces pressure to reduce carbon footprint and improve sustainable sourcing; consumer expectations rising.
Domino’s Pizza, Inc.
- ESG focus growing; carbon emissions and waste management scrutinized amid expanding global footprint.
7. Geopolitical Exposure
Starbucks Corporation
- Operations in 80+ countries expose it to geopolitical tensions, currency fluctuations, and trade barriers.
Domino’s Pizza, Inc.
- International presence in 90 markets subjects it to geopolitical risks and regulatory shifts.
Which company shows a better risk-adjusted profile?
Starbucks’ most impactful risk is its elevated leverage, which threatens financial flexibility despite stable operations. Domino’s faces even greater financial risk from extreme debt levels but benefits from superior operational efficiency and stronger Altman Z and Piotroski scores. Domino’s shows a better risk-adjusted profile, supported by its safe-zone Altman Z-score of 3.21 and very strong Piotroski score of 8, compared to Starbucks’ grey-zone Z-score of 2.74 and average Piotroski score of 5. However, Domino’s higher beta signals increased stock volatility risk that investors must weigh carefully.
Final Verdict: Which stock to choose?
Starbucks Corporation’s superpower lies in its global brand and operational scale, enabling steady cash flow generation despite recent profitability headwinds. However, its deteriorating return on capital and liquidity ratios serve as points of vigilance. It fits best in portfolios targeting long-term recovery with moderate risk tolerance.
Domino’s Pizza, Inc. boasts a strategic moat through its asset-light model and efficient capital use, delivering superior returns on invested capital. Its more favorable income growth and financial strength present a relatively safer profile compared to Starbucks. This stock suits investors seeking growth with a reasonable margin of safety.
If you prioritize capital efficiency and strong cash flow growth, Domino’s outshines due to its durable value creation and financial stability. However, if your focus is on brand resilience and potential turnaround, Starbucks offers an analytical scenario for those willing to navigate near-term operational challenges. Both demand careful risk management given their distinct vulnerabilities.
Disclaimer: Investment carries a risk of loss of initial capital. The past performance is not a reliable indicator of future results. Be sure to understand risks before making an investment decision.
Go Further
I encourage you to read the complete analyses of Starbucks Corporation and Domino’s Pizza, Inc. to enhance your investment decisions: