McDonald’s Corporation and Domino’s Pizza, Inc. are two giants in the restaurant industry, each with a strong global presence and innovative approaches to fast food and delivery. While McDonald’s excels in a broad menu and massive scale, Domino’s focuses on pizza-centric offerings and technology-driven delivery. This comparison will help investors identify which company holds the most compelling potential for their portfolio in 2026. Let’s explore their strengths and opportunities together.

Table of contents
Companies Overview
I will begin the comparison between McDonald’s Corporation and Domino’s Pizza, Inc. by providing an overview of these two companies and their main differences.
McDonald’s Overview
McDonald’s Corporation operates and franchises McDonald’s restaurants globally, offering a broad menu including hamburgers, chicken items, breakfast options, and beverages. Founded in 1940 and headquartered in Chicago, it holds a dominant position in the fast-food industry with over 40,000 restaurants worldwide, emphasizing consistent quality and strong brand recognition in the consumer cyclical sector.
Domino’s Overview
Domino’s Pizza, Inc. is a pizza company operating approximately 18,800 stores across 90 markets, focusing on pizza and complementary items such as sandwiches, pasta, and chicken wings. Founded in 1960 and based in Ann Arbor, Domino’s operates through U.S. stores, international franchises, and supply chain segments, maintaining a significant presence in the quick-service restaurant industry with a strong delivery and digital ordering focus.
Key similarities and differences
Both companies operate in the consumer cyclical sector within the restaurant industry, primarily serving fast food with extensive international footprints. McDonald’s has a broader menu and larger scale with over twice the number of restaurants compared to Domino’s, which concentrates on pizza and related products. While McDonald’s emphasizes franchising and company-owned restaurants, Domino’s operates through distinct business segments including supply chain management, highlighting different operational focuses.
Income Statement Comparison
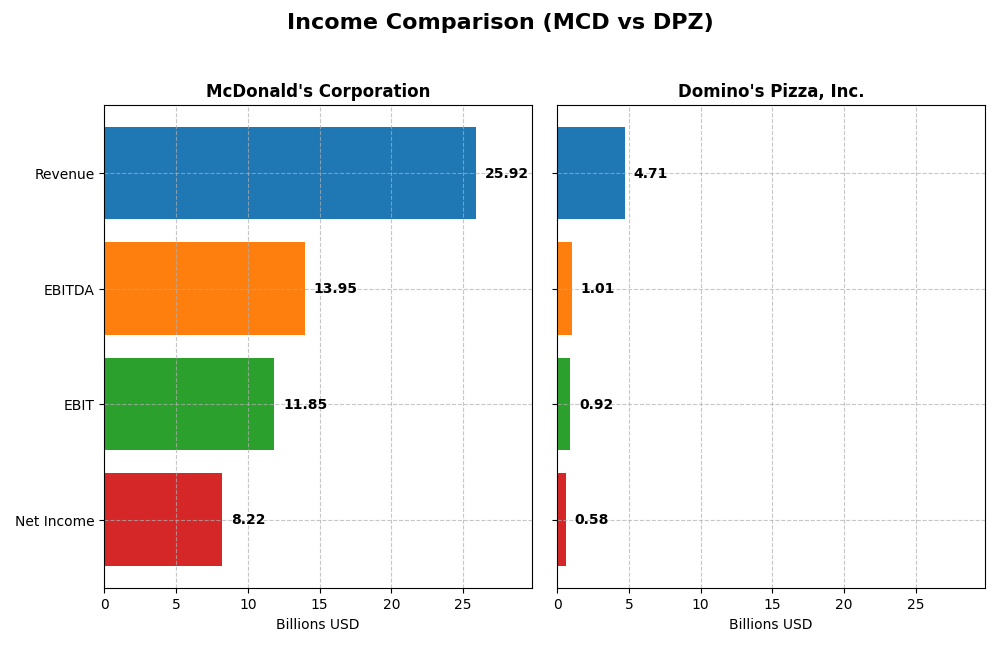
The table below compares the latest fiscal year income statement metrics for McDonald’s Corporation and Domino’s Pizza, Inc., highlighting key financial performance indicators.
| Metric | McDonald’s Corporation | Domino’s Pizza, Inc. |
|---|---|---|
| Market Cap | 220B | 13.7B |
| Revenue | 25.9B | 4.71B |
| EBITDA | 13.9B | 1.01B |
| EBIT | 11.9B | 918M |
| Net Income | 8.22B | 584M |
| EPS | 11.45 | 16.82 |
| Fiscal Year | 2024 | 2024 |
Income Statement Interpretations
McDonald’s Corporation
Between 2020 and 2024, McDonald’s revenue increased by nearly 35%, with net income rising 74%, reflecting strong growth. Margins showed favorable stability, with a gross margin of 56.75% and net margin at 31.72%. However, in 2024, revenue growth slowed to 1.67%, and net margin declined by 4.5%, signaling a slight margin contraction despite overall positive trends.
Domino’s Pizza, Inc.
Domino’s revenue grew 14.3% from 2020 to 2024, while net income increased by 18.9%, both at a steadier pace than McDonald’s. Margins remain favorable but lower, with a 39.28% gross margin and 12.41% net margin. In 2024, revenue grew 5.07%, net margin improved by 7.1%, and EPS rose 14.32%, indicating accelerating profitability and margin expansion.
Which one has the stronger fundamentals?
McDonald’s demonstrates higher absolute margins and stronger long-term revenue and income growth, but faced recent margin and earnings pressure. Domino’s shows consistent margin improvement and earnings growth more recently, with a more favorable short-term momentum. Both companies have favorable income statements, but McDonald’s scale contrasts with Domino’s recent dynamic earnings expansion.
Financial Ratios Comparison
The table below presents a factual comparison of key financial ratios for McDonald’s Corporation and Domino’s Pizza, Inc. based on their most recent fiscal year data from 2024.
| Ratios | McDonald’s Corporation (MCD) | Domino’s Pizza, Inc. (DPZ) |
|---|---|---|
| ROE | -2.17% | -14.74% |
| ROIC | 17.9% | 54.1% |
| P/E | 25.32 | 25.01 |
| P/B | -54.85 | -3.69 |
| Current Ratio | 1.19 | 0.56 |
| Quick Ratio | 1.18 | 0.52 |
| D/E (Debt-to-Equity) | -13.68 | -1.31 |
| Debt-to-Assets | 94.1% | 299.2% |
| Interest Coverage | 7.78 | 4.49 |
| Asset Turnover | 0.47 | 2.71 |
| Fixed Asset Turnover | 0.67 | 9.20 |
| Payout Ratio | 59.2% | 35.9% |
| Dividend Yield | 2.34% | 1.44% |
Interpretation of the Ratios
McDonald’s Corporation
McDonald’s shows predominantly favorable ratios with a strong net margin of 31.72% and a robust return on invested capital (ROIC) at 17.92%. However, the company faces concerns with a negative return on equity (-216.62%) and high debt-to-assets ratio (94.14%). Its current ratio is neutral at 1.19, indicating adequate short-term liquidity. McDonald’s offers a dividend yield of 2.34%, supported by sustainable payout ratios and free cash flow coverage, though high debt levels warrant caution.
Domino’s Pizza, Inc.
Domino’s presents a mixed ratio profile with a favorable net margin of 12.41% and a very high ROIC of 54.1%, signaling operational efficiency. Nevertheless, it has a negative return on equity (-14.74%) and weak liquidity ratios, including a current ratio of 0.56 and quick ratio of 0.52, which are unfavorable. The company maintains a modest dividend yield of 1.44%, but liquidity concerns and high debt-to-assets ratio (299.21%) could pose risks to dividend sustainability.
Which one has the best ratios?
McDonald’s has a higher proportion of favorable ratios (57.14%) compared to Domino’s (50.0%), particularly in liquidity and dividend yield. While both companies struggle with negative return on equity and elevated debt, McDonald’s stronger net margin and more balanced liquidity position provide a comparatively more favorable ratio profile than Domino’s, which faces greater liquidity and leverage challenges.
Strategic Positioning
This section compares the strategic positioning of McDonald’s Corporation and Domino’s Pizza, Inc. focusing on Market position, Key segments, and Exposure to disruption:
McDonald’s Corporation
- Global leader in fast-food with significant scale and moderate competitive pressure
- Diverse revenue streams: U.S., High-Growth, and International Licensed Markets
- Limited explicit exposure to technological disruption detailed in data
Domino’s Pizza, Inc.
- Strong presence in pizza delivery with notable competition and higher market volatility
- Concentrated on Domestic Stores, Supply Chain, and International Franchise segments
- No specific technological disruption exposure mentioned in available data
McDonald’s Corporation vs Domino’s Pizza, Inc. Positioning
McDonald’s pursues a diversified geographic and product strategy with a vast restaurant network, while Domino’s focuses on pizza delivery and supply chain efficiency, reflecting more concentrated business segments and operational scope.
Which has the best competitive advantage?
McDonald’s shows a very favorable moat with growing ROIC exceeding WACC, indicating a durable competitive advantage. Domino’s also creates value but faces declining ROIC, resulting in a slightly favorable moat status.
Stock Comparison
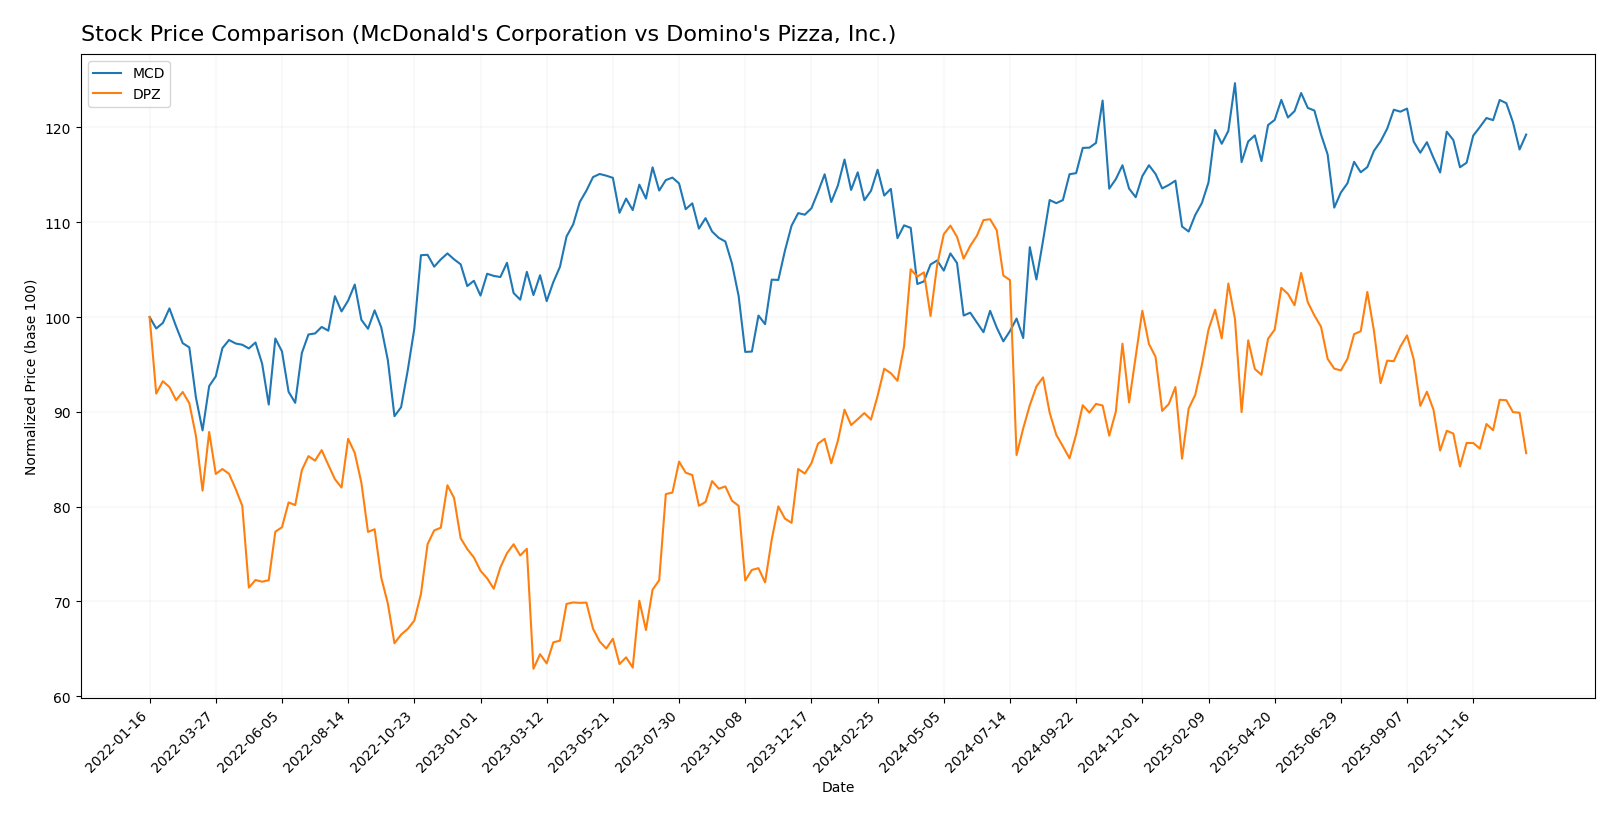
The stock price movements over the past year reveal contrasting dynamics between McDonald’s Corporation and Domino’s Pizza, Inc., highlighting McDonald’s bullish momentum and Domino’s bearish pressure amid varying volatility and trading volumes.
Trend Analysis
McDonald’s stock showed a bullish trend with a 5.24% price increase over the last 12 months, accompanied by accelerating momentum and a high volatility level of 17.87. The price ranged from a low of 251.09 to a high of 321.29.
Domino’s Pizza experienced a bearish trend, with its stock price declining by 3.97% over the past year. This decline accelerated despite notable volatility at 32.35, with prices fluctuating between 398.46 and 521.83.
Comparing the two, McDonald’s delivered the highest market performance with positive returns and accelerating growth, while Domino’s faced a declining stock price and stronger selling pressure during the same period.
Target Prices
Analyst consensus target prices indicate positive upside potential for both McDonald’s Corporation and Domino’s Pizza, Inc.
| Company | Target High | Target Low | Consensus |
|---|---|---|---|
| McDonald’s Corporation | 372 | 295 | 334.17 |
| Domino’s Pizza, Inc. | 540 | 370 | 472.5 |
The consensus targets for McDonald’s and Domino’s Pizza exceed their current prices of 307.32 and 405.09 respectively, suggesting analysts generally expect moderate to strong appreciation.
Analyst Opinions Comparison
This section compares analysts’ ratings and financial grades for McDonald’s Corporation and Domino’s Pizza, Inc.:
Rating Comparison
MCD Rating
- Rating: B-, evaluated as Very Favorable overall.
- Discounted Cash Flow Score: 4, indicating a Favorable outlook on cash flows.
- Return on Equity Score: 1, considered Very Unfavorable for profitability.
- Return on Assets Score: 5, rated Very Favorable for asset utilization.
- Debt To Equity Score: 1, marked Very Unfavorable for financial risk.
- Overall Score: 2, assessed as Moderate overall financial standing.
DPZ Rating
- Rating: C+, also evaluated as Very Favorable overall.
- Discounted Cash Flow Score: 3, reflecting a Moderate outlook on cash flows.
- Return on Equity Score: 1, equally Very Unfavorable for profitability.
- Return on Assets Score: 5, also rated Very Favorable for asset utilization.
- Debt To Equity Score: 1, similarly Very Unfavorable for financial risk.
- Overall Score: 2, also assessed as Moderate overall financial standing.
Which one is the best rated?
Based strictly on the provided data, McDonald’s holds a higher rating of B- compared to Domino’s C+, supported by a stronger Discounted Cash Flow Score. Both companies share identical scores in ROE, ROA, Debt to Equity, and Overall Score.
Scores Comparison
Here is a comparison of the Altman Z-Score and Piotroski Score for both companies:
MCD Scores
- Altman Z-Score: 4.87, indicating a safe zone, low bankruptcy risk.
- Piotroski Score: 7, classified as strong financial health.
DPZ Scores
- Altman Z-Score: 3.21, also in the safe zone, moderate-low bankruptcy risk.
- Piotroski Score: 8, indicating very strong financial health.
Which company has the best scores?
Based on the provided data, DPZ has a higher Piotroski Score (8 vs. 7) suggesting stronger financial health, while both companies have Altman Z-Scores in the safe zone, with MCD scoring higher (4.87 vs. 3.21).
Grades Comparison
The following grades from verified financial institutions provide a basis for comparing McDonald’s Corporation and Domino’s Pizza, Inc.:
McDonald’s Corporation Grades
This table summarizes recent analyst grades and actions for McDonald’s Corporation.
| Grading Company | Action | New Grade | Date |
|---|---|---|---|
| Keybanc | Maintain | Overweight | 2026-01-09 |
| TD Cowen | Maintain | Hold | 2026-01-08 |
| Truist Securities | Maintain | Buy | 2026-01-08 |
| Barclays | Maintain | Overweight | 2026-01-07 |
| Oppenheimer | Upgrade | Outperform | 2026-01-06 |
| Guggenheim | Maintain | Neutral | 2025-11-19 |
| Wells Fargo | Maintain | Overweight | 2025-11-06 |
| Baird | Maintain | Neutral | 2025-11-06 |
| Barclays | Maintain | Overweight | 2025-11-06 |
| BTIG | Maintain | Neutral | 2025-10-24 |
Overall, McDonald’s grades show a generally positive trend with multiple “Overweight,” “Buy,” and “Outperform” ratings, indicating confidence in the stock’s potential.
Domino’s Pizza, Inc. Grades
This table summarizes recent analyst grades and actions for Domino’s Pizza, Inc.
| Grading Company | Action | New Grade | Date |
|---|---|---|---|
| Evercore ISI Group | Maintain | Outperform | 2026-01-08 |
| Stifel | Maintain | Buy | 2026-01-07 |
| Barclays | Maintain | Underweight | 2026-01-07 |
| TD Cowen | Downgrade | Hold | 2026-01-05 |
| BTIG | Maintain | Buy | 2025-11-14 |
| RBC Capital | Maintain | Sector Perform | 2025-10-15 |
| TD Cowen | Maintain | Buy | 2025-10-15 |
| B of A Securities | Maintain | Buy | 2025-10-15 |
| BTIG | Maintain | Buy | 2025-10-15 |
| TD Cowen | Maintain | Buy | 2025-10-14 |
Domino’s Pizza ratings reveal a mix of “Buy” and “Outperform” grades but also include a notable “Underweight” and a recent downgrade to “Hold,” suggesting some analyst caution.
Which company has the best grades?
McDonald’s Corporation exhibits a more consistent positive outlook with multiple “Overweight” and “Buy” ratings, while Domino’s Pizza shows mixed signals including downgrades and an “Underweight.” For investors, McDonald’s steadier grades may reflect perceived lower risk and more stable growth prospects compared to Domino’s.
Strengths and Weaknesses
The table below compares the strengths and weaknesses of McDonald’s Corporation (MCD) and Domino’s Pizza, Inc. (DPZ) based on recent financial and operational data.
| Criterion | McDonald’s Corporation (MCD) | Domino’s Pizza, Inc. (DPZ) |
|---|---|---|
| Diversification | Strong geographic revenue spread: US $10.6B, High-Growth Markets $12.6B, International $2.7B | More concentrated; Supply Chain $2.85B, Domestic Stores $1.54B, International Franchise $319M |
| Profitability | High net margin (31.7%), ROIC 17.9% (favorable) | Moderate net margin (12.4%), very high ROIC (54.1%) but declining trend |
| Innovation | Consistent investment in digital ordering and menu innovation | Strong digital ordering platform, but profitability trend is declining |
| Global presence | Extensive with strong presence across multiple regions | Less diversified internationally, focused on key markets |
| Market Share | Leading global fast-food brand with strong economic moat | Leading pizza delivery brand but smaller global footprint |
Key takeaways: McDonald’s demonstrates a very favorable economic moat with growing profitability and strong diversification, making it a stable choice. Domino’s shows exceptional capital efficiency but faces challenges with declining ROIC and less geographic diversification, suggesting higher risk despite growth potential.
Risk Analysis
Below is a summary table of key risks for McDonald’s Corporation and Domino’s Pizza, Inc. based on the most recent financial and operational data from 2024-2026.
| Metric | McDonald’s Corporation (MCD) | Domino’s Pizza, Inc. (DPZ) |
|---|---|---|
| Market Risk | Moderate (Beta 0.53) – lower volatility but sensitive to consumer trends | Higher (Beta 1.16) – more volatile, impacted by competitive pizza market |
| Debt Level | High leverage (Debt/Assets 94%) raises financial risk | Very high leverage (Debt/Assets 299%) – significant financial risk |
| Regulatory Risk | Moderate – global food regulations and franchising laws | Moderate – similar regulatory environment, franchise compliance critical |
| Operational Risk | Moderate – large global footprint with supply chain dependencies | Moderate – supply chain and franchise model risks |
| Environmental Risk | Increasing pressure on sustainability and waste management | Growing focus on sustainable packaging and emissions |
| Geopolitical Risk | Exposure to global markets; currency and trade tensions possible | Exposure to international markets but less extensive than MCD |
The most impactful risks are the high debt levels for both companies, especially Domino’s, which could strain financial flexibility amid market fluctuations. McDonald’s lower beta suggests less market volatility risk, but global operations expose it to geopolitical uncertainties. Recent focus on sustainability also poses operational challenges. Investors should weigh these risks carefully against growth prospects.
Which Stock to Choose?
McDonald’s Corporation shows a favorable income evolution with strong gross and EBIT margins, though recent growth rates are mixed. Its financial ratios are mostly positive, highlighting solid profitability and manageable debt levels, supported by a very favorable overall rating.
Domino’s Pizza, Inc. presents a favorable income statement with consistent margin improvements and revenue growth. Its financial ratios reflect strong asset utilization and value creation, despite higher leverage and lower liquidity, accompanied by a slightly favorable overall rating.
For investors prioritizing durable competitive advantage and stable profitability, McDonald’s might appear more favorable due to its very favorable moat and rating, while growth-oriented investors could see Domino’s improving income trends and asset efficiency as attractive despite its slightly favorable rating.
Disclaimer: Investment carries a risk of loss of initial capital. The past performance is not a reliable indicator of future results. Be sure to understand risks before making an investment decision.
Go Further
I encourage you to read the complete analyses of McDonald’s Corporation and Domino’s Pizza, Inc. to enhance your investment decisions: