Home > Comparison > Utilities > D vs XEL
The strategic rivalry between Dominion Energy, Inc. and Xcel Energy Inc. shapes the competitive landscape of the regulated electric utilities sector. Dominion operates as a diversified energy producer with extensive gas and electric assets across multiple states. Xcel focuses on a broad mix of regulated electric and natural gas utilities, emphasizing renewable energy integration. This analysis aims to identify which company’s operational model delivers superior risk-adjusted returns for investors seeking stable utility exposure.
Table of contents
Companies Overview
Dominion Energy and Xcel Energy anchor significant footprints in the US regulated electric market.
Dominion Energy, Inc.: Integrated Energy Provider
Dominion Energy commands a diversified energy portfolio centered on regulated electricity and natural gas. Its core revenue arises from delivering electricity to 2.7M customers in Virginia and the Carolinas, plus gas distribution serving 3.1M customers across several states. In 2021, it focused on expanding renewable natural gas and contracted renewable energy assets, leveraging a robust transmission and distribution network.
Xcel Energy Inc.: Multi-Source Utility Leader
Xcel Energy operates as a broad-spectrum utility, generating power from coal, nuclear, natural gas, and renewables. It serves 3.7M electricity and 2.1M natural gas customers across eight states. Its strategic focus includes developing renewable generation facilities and enhancing natural gas infrastructure, reflecting a commitment to energy diversification and modernization in a competitive regulated market.
Strategic Collision: Similarities & Divergences
Both utilities emphasize regulated markets and renewable energy but differ in scope and approach. Dominion leans on a vertically integrated model with a strong gas distribution arm, while Xcel emphasizes a multi-fuel generation mix and regional diversification. Their primary battle is for customer base expansion and renewable capacity growth. Investors encounter distinct profiles: Dominion offers asset scale and legacy integration; Xcel presents a diversified fuel portfolio with a leaner workforce.
Income Statement Comparison
This data dissects the core profitability and scalability of both corporate engines to reveal who dominates the bottom line:
| Metric | Dominion Energy, Inc. (D) | Xcel Energy Inc. (XEL) |
|---|---|---|
| Revenue | 14.46B | 13.44B |
| Cost of Revenue | 7.54B | 7.29B |
| Operating Expenses | 3.68B | 3.76B |
| Gross Profit | 6.92B | 6.15B |
| EBITDA | 6.71B | 5.59B |
| EBIT | 4.07B | 2.72B |
| Interest Expense | 1.89B | 1.18B |
| Net Income | 2.12B | 1.94B |
| EPS | 2.44 | 3.44 |
| Fiscal Year | 2024 | 2024 |
Income Statement Analysis: The Bottom-Line Duel
This income statement comparison exposes the true operational efficiency and growth dynamics of Dominion Energy and Xcel Energy’s corporate engines.
Dominion Energy, Inc. Analysis
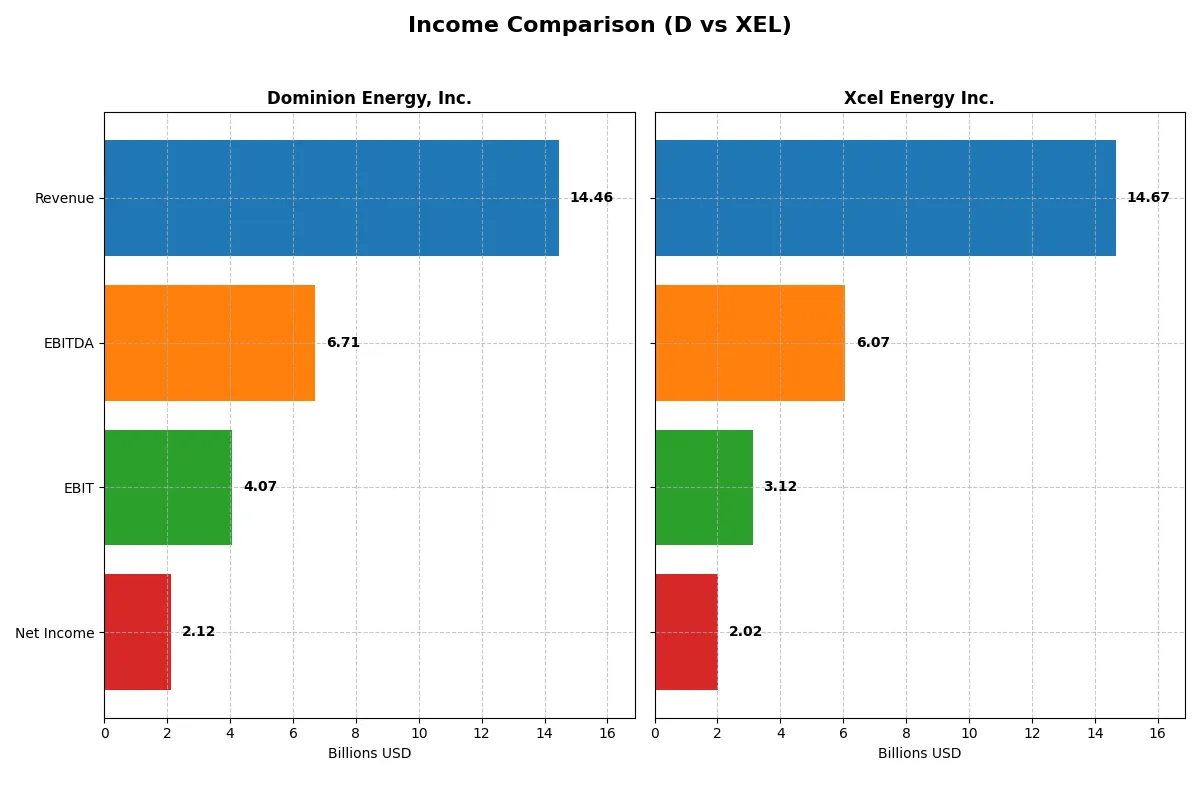
Dominion’s revenue hovered near 14.5B in 2024, showing minimal growth but a strong net income surge to 2.12B. Its gross margin remains robust at 47.9%, while net margin at 14.7% signals effective cost control. EBIT rose 10.2%, reflecting improving operational momentum despite a high interest burden of 13%.
Xcel Energy Inc. Analysis
Xcel’s 2025 revenue climbed to 14.7B, marking a healthy 9.1% increase year-over-year. Gross margin at 24.3% is significantly lower than Dominion’s, but EBIT margin holds steady at 21.2%. Net income rose to 2.02B, although net margin dipped slightly to 13.8%, indicating margin pressure amid higher revenues.
Margin Strength vs. Revenue Momentum
Dominion leads with superior gross and net margins, driven by efficient cost management despite slower revenue growth. Xcel impresses with faster revenue expansion but struggles with thinner margins and slight net margin erosion. Investors seeking margin resilience may prefer Dominion’s profile; those favoring growth momentum might lean toward Xcel’s expanding topline.
Financial Ratios Comparison
These vital ratios act as a diagnostic tool to expose the underlying fiscal health, valuation premiums, and capital efficiency of the companies compared below:
| Ratios | Dominion Energy, Inc. (D) | Xcel Energy Inc. (XEL) |
|---|---|---|
| ROE | 7.79% | 9.92% |
| ROIC | 2.86% | 3.64% |
| P/E | 21.28 | 21.48 |
| P/B | 1.66 | 1.95 |
| Current Ratio | 0.71 | 0.67 |
| Quick Ratio | 0.52 | 0.57 |
| D/E | 1.53 | 1.55 |
| Debt-to-Assets | 40.77% | 43.13% |
| Interest Coverage | 1.72 | 2.02 |
| Asset Turnover | 0.14 | 0.19 |
| Fixed Asset Turnover | 0.21 | 0.23 |
| Payout ratio | 105.4% | 82.2% |
| Dividend yield | 4.95% | 3.83% |
| Fiscal Year | 2024 | 2025 |
Efficiency & Valuation Duel: The Vital Signs
Financial ratios serve as a company’s DNA, uncovering hidden risks and operational strengths that shape investor confidence.
Dominion Energy, Inc.
Dominion Energy shows moderate profitability with a 7.79% ROE and a solid 14.69% net margin, signaling operational efficiency. Its P/E of 21.28 and P/B of 1.66 mark the stock as fairly valued but stretched. The 4.95% dividend yield rewards shareholders amid limited reinvestment into growth or R&D.
Xcel Energy Inc.
Xcel Energy posts a favorable net margin of 13.76%, but its zero reported ROE and ROIC raise questions on capital efficiency. The P/E ratio of 21.48 aligns with peers, presenting a neutral valuation. Xcel’s 3.83% dividend yield offers steady returns despite scarce data on growth reinvestment.
Dividend Strength vs. Capital Efficiency Debate
Dominion Energy balances shareholder yield with moderate operational returns, while Xcel exhibits stronger margins but lacks clear capital efficiency. Investors prioritizing income might prefer Dominion’s reliable dividends. Those focused on margin stability may lean toward Xcel’s cleaner profitability profile.
Which one offers the Superior Shareholder Reward?
I observe Dominion Energy (D) pays a higher dividend yield near 5%, but its payout ratio exceeds 100%, signaling risk. Xcel Energy (XEL) yields around 3.8% with a sustainable payout near 60%. Both have negative free cash flow, but XEL’s lower payout and steady buybacks suggest more prudent capital allocation. I favor Xcel for a balanced total return and longevity in 2026.
Comparative Score Analysis: The Strategic Profile
The radar chart reveals the fundamental DNA and trade-offs of Dominion Energy, Inc. and Xcel Energy Inc., highlighting their distinct financial strengths:
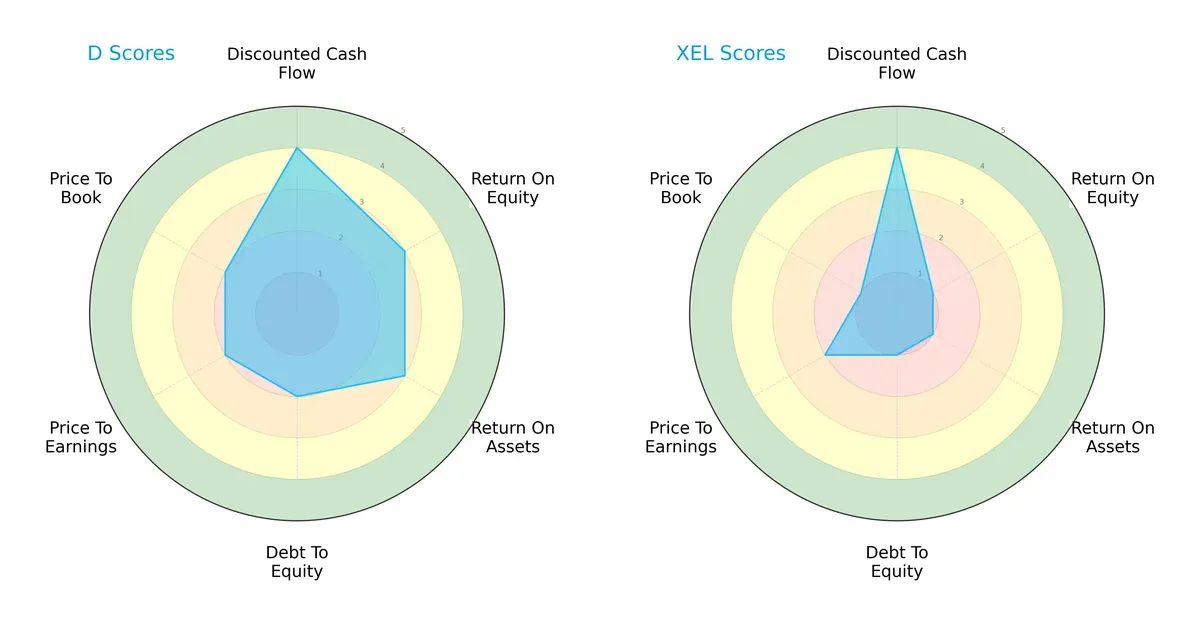
Dominion Energy shows a more balanced profile with moderate ROE and ROA, coupled with a strong DCF score. However, its debt-to-equity and valuation metrics lag, signaling caution. Xcel Energy relies heavily on its favorable DCF but suffers from weak profitability and financial leverage scores, indicating higher risk and operational inefficiency relative to Dominion. Overall, Dominion offers a steadier strategic foundation.
—
Financial Health: Quality of Operations
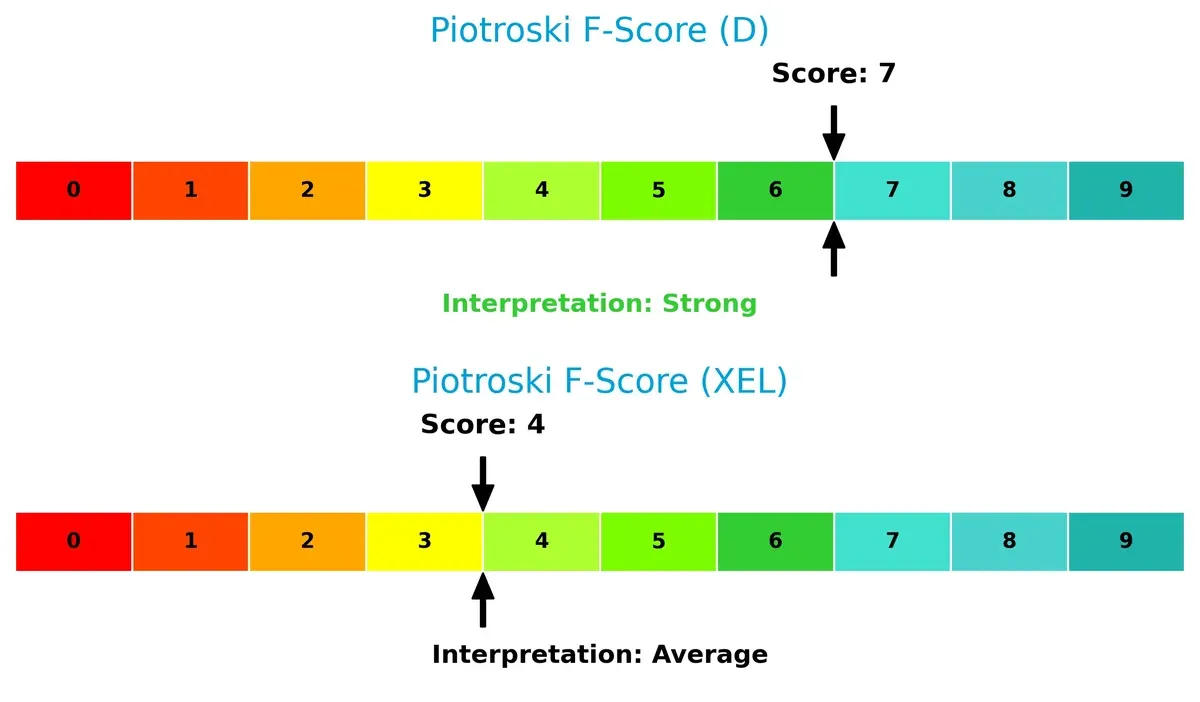
Dominion Energy’s Piotroski F-Score of 7 indicates robust financial health with strong internal metrics. Xcel Energy’s score of 4 signals average health and potential red flags in operational efficiency and financial stability:
How are the two companies positioned?
This section dissects Dominion Energy and Xcel Energy’s operational DNA by comparing their revenue distribution and internal strengths and weaknesses. The ultimate goal is to confront their economic moats to reveal which business model delivers the most resilient competitive advantage today.
Revenue Segmentation: The Strategic Mix
This visual comparison dissects how Dominion Energy, Inc. and Xcel Energy Inc. diversify their income streams and reveals where their primary sector bets lie:
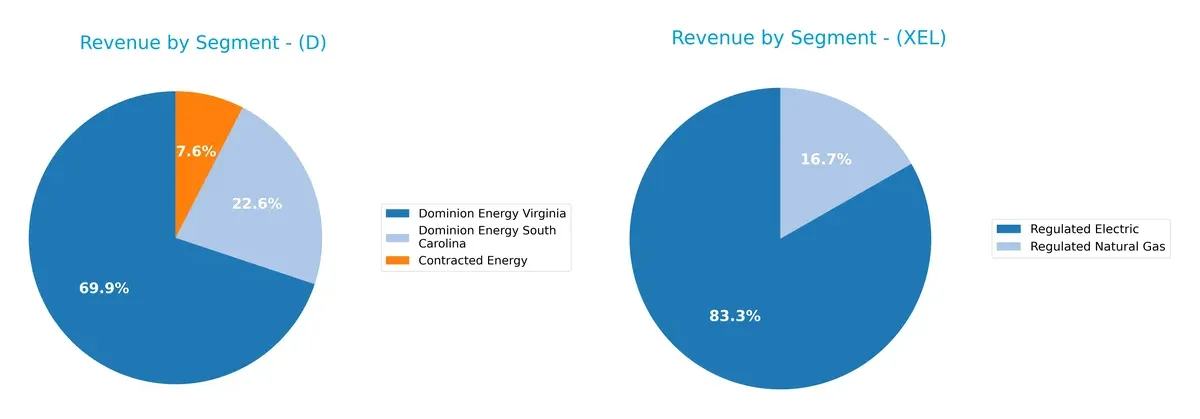
Dominion Energy pivots heavily on Dominion Energy Virginia at $10.2B in 2024, anchoring its revenue with regional dominance. Xcel Energy leans on Regulated Electric at $22.3B, dwarfing its $4.5B Regulated Natural Gas segment. Dominion shows a more balanced mix with significant contributions from South Carolina and Contracted Energy, reducing concentration risk. Xcel’s reliance on a dominant electric segment suggests strong infrastructure control but exposes it to regulatory shifts in power generation.
Strengths and Weaknesses Comparison
This table compares the Strengths and Weaknesses of Dominion Energy (D) and Xcel Energy (XEL):
D Strengths
- Higher net margin at 14.69%
- Favorable WACC at 5.43%
- Strong dividend yield at 4.95%
- Diverse revenue streams across regions and segments
XEL Strengths
- Favorable net margin at 13.76%
- Favorable debt and debt-to-assets ratios
- Neutral interest coverage at 2.32
- Consistent revenue in regulated electric and gas segments
D Weaknesses
- Unfavorable ROE at 7.79% and ROIC at 2.86% below WACC
- Low liquidity ratios (current 0.71, quick 0.52)
- High debt-to-equity ratio at 1.53
- Low asset and fixed asset turnover
XEL Weaknesses
- Zero reported ROE and ROIC indicate poor profitability
- Unfavorable liquidity ratios
- Lack of WACC data reduces transparency
- Zero asset turnover metrics signal operational inefficiency
Dominion Energy shows solid profitability and dividend strength but faces liquidity and efficiency challenges. Xcel Energy demonstrates better leverage control but suffers from lackluster profitability and incomplete financial transparency. Both companies must balance these factors in their strategic positioning.
The Moat Duel: Analyzing Competitive Defensibility
A structural moat is the only thing protecting long-term profits from relentless competition erosion. Here’s how Dominion Energy and Xcel Energy shape their moats:
Dominion Energy, Inc.: Infrastructure & Regulated Monopoly Moat
Dominion’s moat stems from regulated utility status and vast transmission assets. This creates stable margins and high ROIC trends despite current value destruction. Expansion in renewable contracted assets could strengthen its position in 2026.
Xcel Energy Inc.: Diversified Energy Portfolio Moat
Xcel’s competitive edge lies in a diversified generation portfolio across renewables and traditional energy. It maintains stable net margins but faces declining ROIC trends, signaling pressure on capital efficiency. Growth in solar and wind offers upside potential.
Verdict: Regulated Monopoly Stability vs. Portfolio Diversification Dynamics
Dominion holds the deeper moat with infrastructure-backed regulatory protection and improving profitability trends. Xcel’s portfolio diversification provides flexibility but exhibits weakening capital returns. Dominion is better equipped to defend market share amid evolving energy demands.
Which stock offers better returns?
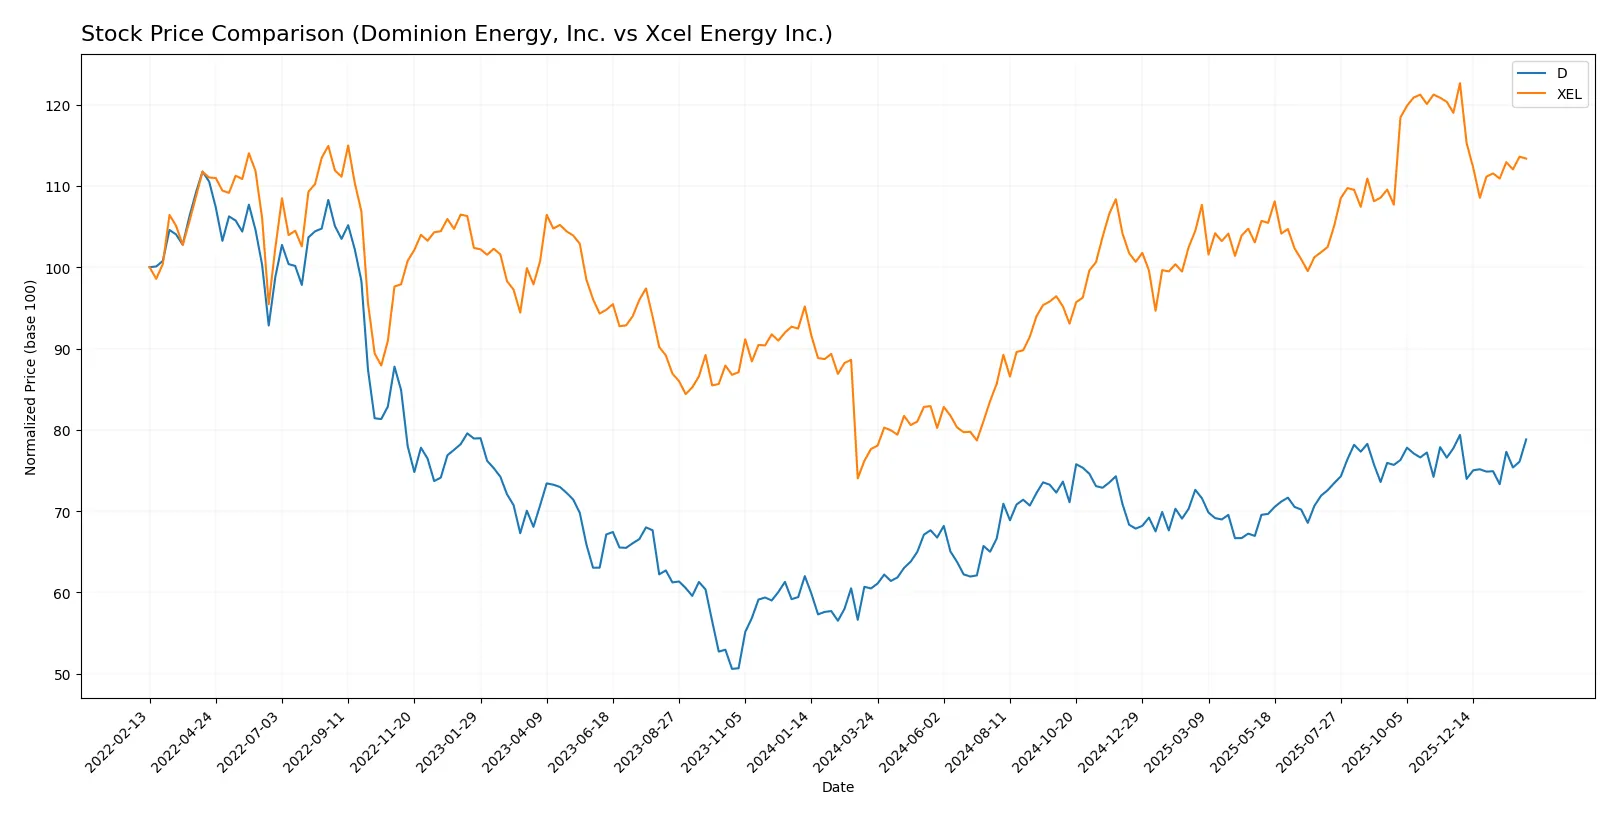
Over the past year, Dominion Energy and Xcel Energy displayed strong upward price movements with notable highs and decelerating momentum in both cases.
Trend Comparison
Dominion Energy’s stock rose 30.29% over the past 12 months, marking a bullish trend with decelerating growth and a high near 62.77. Recent months show a slight neutral trend with minimal price change.
Xcel Energy’s stock gained 45.99% in the same period, also bullish but with higher volatility. It reached a peak of 82.11 before showing a bearish trend recently, declining 4.73% over the last quarter.
Xcel Energy outperformed Dominion Energy in 2025–2026, achieving stronger overall gains despite recent downward pressure, while Dominion held steadier near-term pricing.
Target Prices
Analysts show a bullish consensus for Dominion Energy and Xcel Energy with solid upside potential.
| Company | Target Low | Target High | Consensus |
|---|---|---|---|
| Dominion Energy, Inc. | 63 | 69 | 65.86 |
| Xcel Energy Inc. | 81 | 95 | 88 |
Dominion Energy’s consensus target price sits about 5.6% above its current 62.33 price, signaling moderate upside. Xcel Energy’s target consensus at 88 suggests a more robust 16% potential gain versus its 75.9 price.

Don’t Let Luck Decide Your Entry Point
Optimize your entry points with our advanced ProRealTime indicators. You’ll get efficient buy signals with precise price targets for maximum performance. Start outperforming now!
How do institutions grade them?
Dominion Energy, Inc. Grades
Here are the recent grades assigned to Dominion Energy by major financial institutions:
| Grading Company | Action | New Grade | Date |
|---|---|---|---|
| Barclays | Maintain | Overweight | 2026-01-22 |
| Wells Fargo | Maintain | Overweight | 2026-01-20 |
| Barclays | Maintain | Overweight | 2025-12-17 |
| JP Morgan | Maintain | Underweight | 2025-12-11 |
| BMO Capital | Maintain | Market Perform | 2025-11-03 |
| Morgan Stanley | Maintain | Equal Weight | 2025-10-22 |
| Barclays | Maintain | Overweight | 2025-10-07 |
| Morgan Stanley | Maintain | Equal Weight | 2025-09-25 |
| JP Morgan | Maintain | Underweight | 2025-08-21 |
| JP Morgan | Maintain | Underweight | 2025-07-15 |
Xcel Energy Inc. Grades
Below are the latest grades issued for Xcel Energy from key grading firms:
| Grading Company | Action | New Grade | Date |
|---|---|---|---|
| Barclays | Maintain | Overweight | 2026-01-15 |
| UBS | Maintain | Neutral | 2025-12-17 |
| Keybanc | Maintain | Overweight | 2025-12-12 |
| JP Morgan | Maintain | Overweight | 2025-12-11 |
| Barclays | Maintain | Overweight | 2025-11-05 |
| Citigroup | Maintain | Buy | 2025-11-03 |
| UBS | Maintain | Neutral | 2025-10-31 |
| Mizuho | Maintain | Outperform | 2025-10-27 |
| Jefferies | Maintain | Buy | 2025-10-16 |
| Keybanc | Maintain | Overweight | 2025-10-15 |
Which company has the best grades?
Xcel Energy consistently receives stronger ratings, including multiple Buy and Outperform grades. Dominion Energy has mixed ratings, with Underweight and Market Perform marks. This divergence could influence investor sentiment and portfolio positioning.
Risks specific to each company
The following categories identify the critical pressure points and systemic threats facing both firms in the 2026 market environment:
1. Market & Competition
Dominion Energy, Inc.
- Operates mainly in regulated electric markets with stable demand but faces pressure from renewable competitors.
Xcel Energy Inc.
- Serves diverse geographies with varied energy sources but contends with increasing competition in renewables and natural gas.
2. Capital Structure & Debt
Dominion Energy, Inc.
- High debt-to-equity ratio (1.53) and weak interest coverage (2.16) signal elevated financial risk.
Xcel Energy Inc.
- Debt metrics favorable; low or unavailable debt, indicating stronger balance sheet stability.
3. Stock Volatility
Dominion Energy, Inc.
- Beta of 0.71 reflects moderate sensitivity to market swings, slightly riskier than Xcel.
Xcel Energy Inc.
- Lower beta at 0.48 suggests more stable stock price behavior, less volatility exposure.
4. Regulatory & Legal
Dominion Energy, Inc.
- Subject to stringent state-level regulations in VA, NC, and SC, with potential for rate case risks.
Xcel Energy Inc.
- Faces regulatory complexity across multiple states but benefits from diversified regulatory regimes.
5. Supply Chain & Operations
Dominion Energy, Inc.
- Large asset base with extensive transmission and distribution lines; operational risks from aging infrastructure.
Xcel Energy Inc.
- Broad energy mix including renewables; operational complexity but opportunities in pipeline and storage investments.
6. ESG & Climate Transition
Dominion Energy, Inc.
- Invests in renewable generation but still reliant on fossil fuels; transition risk moderate.
Xcel Energy Inc.
- Strong push towards renewables and clean energy; ESG initiatives support long-term sustainability.
7. Geopolitical Exposure
Dominion Energy, Inc.
- Operations concentrated in the US Southeast, limiting geopolitical risk but exposing to regional economic shifts.
Xcel Energy Inc.
- Presence in multiple US states with diverse economies reduces geopolitical concentration risk.
Which company shows a better risk-adjusted profile?
Dominion’s biggest risk is its stretched capital structure with weak liquidity ratios and distress-level Altman Z-Score. Xcel’s primary risk lies in underwhelming profitability and average financial strength reflected by zero ROE and ROIC. Xcel’s balance sheet strength and lower volatility give it a better risk-adjusted profile. Notably, Dominion’s Altman Z-Score of 0.71 signals high bankruptcy risk, demanding caution despite solid dividend yield.
Final Verdict: Which stock to choose?
Dominion Energy’s superpower lies in its consistent income quality and favorable net margins, making it a resilient cash generator in a capital-intensive sector. However, its high leverage and stretched liquidity ratios remain a point of vigilance. It suits investors with an appetite for steady income and moderate growth in a defensive portfolio.
Xcel Energy stands out with a strategic moat built on disciplined capital allocation and a slightly safer debt profile. Its dividend yield and operating margins provide recurring revenue safety, appealing to investors seeking a blend of income and growth. Compared to Dominion, it offers a more conservative risk profile suitable for GARP investors.
If you prioritize income stability and a proven ability to generate cash despite financial headwinds, Dominion Energy is the compelling choice due to its strong net margins and improving profitability. However, if you seek a more balanced risk-reward with an emphasis on capital preservation and steady dividend growth, Xcel Energy offers better stability and a cleaner balance sheet. Both names carry sector-specific risks, so matching them to your investment style is key.
Disclaimer: Investment carries a risk of loss of initial capital. The past performance is not a reliable indicator of future results. Be sure to understand risks before making an investment decision.
Go Further
I encourage you to read the complete analyses of Dominion Energy, Inc. and Xcel Energy Inc. to enhance your investment decisions: