Dominion Energy, Inc. and WEC Energy Group, Inc. are two leading players in the regulated electric utility sector in the United States. Both companies serve millions of customers with a mix of traditional and renewable energy solutions, operating extensive electric and natural gas infrastructure. Their innovation strategies and regional market strengths make them natural competitors. In this article, I will analyze which company presents a more compelling investment opportunity in 2026.
Table of contents
Companies Overview
I will begin the comparison between Dominion Energy, Inc. and WEC Energy Group, Inc. by providing an overview of these two companies and their main differences.
Dominion Energy Overview
Dominion Energy, Inc. is a major player in the regulated electric industry in the United States, focusing on producing and distributing energy through four main segments. It serves approximately 6.9M customers across Virginia, North Carolina, South Carolina, and several other states, with a diverse asset portfolio including 30.2GW of electric generation capacity and extensive transmission and distribution infrastructure. The company is headquartered in Richmond, Virginia, and employs around 14,700 people.
WEC Energy Group Overview
WEC Energy Group, Inc. operates through six segments, providing regulated natural gas, electricity, and renewable energy services predominantly in Wisconsin, Illinois, and other states. It manages a vast network of electric and natural gas distribution lines and infrastructure, serving millions of customers with diversified energy sources such as coal, natural gas, hydroelectric, and biomass. Headquartered in Milwaukee, Wisconsin, WEC employs about 7,000 full-time workers.
Key similarities and differences
Both Dominion Energy and WEC Energy Group operate within the regulated electric utility sector, offering natural gas and electricity services with a focus on regulated markets and renewable energy. Dominion has a larger workforce and broader geographic reach, while WEC operates more segments and maintains a balanced mix of overhead and underground electric distribution systems. Their asset bases differ in scale and infrastructure composition, reflecting varied regional footprints and operational strategies.
Income Statement Comparison
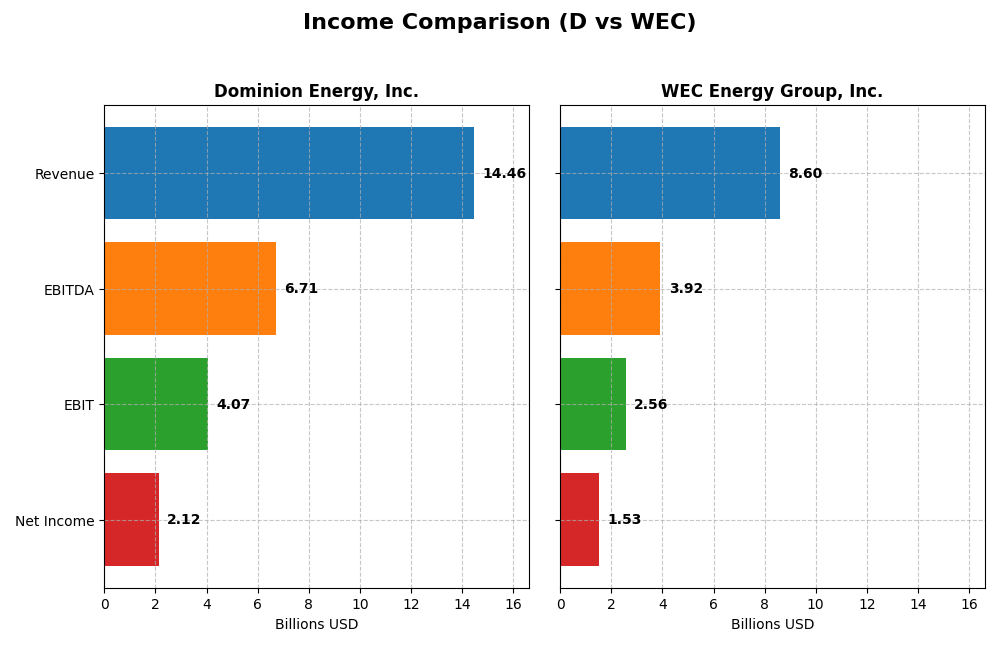
The table below compares key income statement metrics for Dominion Energy, Inc. and WEC Energy Group, Inc. for the fiscal year 2024, highlighting their financial performance.
| Metric | Dominion Energy, Inc. | WEC Energy Group, Inc. |
|---|---|---|
| Market Cap | 49.5B | 33.5B |
| Revenue | 14.46B | 8.60B |
| EBITDA | 6.71B | 3.92B |
| EBIT | 4.07B | 2.56B |
| Net Income | 2.12B | 1.53B |
| EPS | 2.44 | 4.81 |
| Fiscal Year | 2024 | 2024 |
Income Statement Interpretations
Dominion Energy, Inc.
Dominion Energy’s revenue showed modest growth from 2020 to 2024, reaching $14.46B in 2024, with net income recovering strongly to $2.12B after a loss in 2020. Gross and EBIT margins remained favorable, around 47.9% and 28.1% respectively, despite a slight decline in gross profit last year. The net margin improved to 14.7%, supported by a 6% rise in net margin and EPS growth in 2024.
WEC Energy Group, Inc.
WEC Energy’s revenue increased steadily over the period, reaching $8.6B in 2024 but declined slightly from 2023. Net income grew to $1.53B with a favorable net margin of 17.8%. Gross profit and EBIT margins were stable or improved, at 44.0% and 29.8%. The company experienced strong growth in EBIT (13.2%) and EPS (14.5%) in 2024, alongside favorable overall revenue and net income growth.
Which one has the stronger fundamentals?
WEC Energy demonstrates stronger fundamentals with a higher net margin (17.8% vs. 14.7%) and more consistent revenue growth over the period (18.8% vs. 2.0%). It also shows higher proportions of favorable income statement metrics (85.7% vs. 64.3%) and more robust recent EBIT and EPS growth. Dominion Energy, despite strong net income growth, faces higher interest expense pressures and slower revenue expansion.
Financial Ratios Comparison
The following table presents a side-by-side comparison of key financial ratios for Dominion Energy, Inc. (D) and WEC Energy Group, Inc. (WEC) based on their most recent fiscal year data (2024).
| Ratios | Dominion Energy, Inc. (D) | WEC Energy Group, Inc. (WEC) |
|---|---|---|
| ROE | 7.79% | 12.30% |
| ROIC | 2.86% | 4.14% |
| P/E | 21.28 | 19.46 |
| P/B | 1.66 | 2.39 |
| Current Ratio | 0.71 | 0.60 |
| Quick Ratio | 0.52 | 0.43 |
| D/E | 1.53 | 1.64 |
| Debt-to-Assets | 40.77% | 42.92% |
| Interest Coverage | 1.72 | 2.64 |
| Asset Turnover | 0.14 | 0.18 |
| Fixed Asset Turnover | 0.21 | 0.25 |
| Payout Ratio | 105.41% | 69.10% |
| Dividend Yield | 4.95% | 3.55% |
Interpretation of the Ratios
Dominion Energy, Inc.
Dominion Energy shows a mixed ratio profile with a favorable net margin of 14.69% and a strong dividend yield at 4.95%, indicating solid profitability and shareholder returns. However, its return on equity (7.79%), return on invested capital (2.86%), and liquidity ratios such as current ratio (0.71) are unfavorable, suggesting operational and financial efficiency concerns. The company maintains dividends, supported by a decent payout capacity but faces risks due to weaker cash flow coverage.
WEC Energy Group, Inc.
WEC Energy Group presents a stronger net margin at 17.77% and a favorable dividend yield of 3.55%, reflecting efficient profit generation and shareholder returns. Its return on equity is neutral at 12.3%, while return on invested capital is slightly unfavorable at 4.14%. Liquidity ratios remain below 1, indicating potential short-term liquidity pressures. The company supports dividends with moderate payout ratios but must monitor debt levels and operational efficiency.
Which one has the best ratios?
Both Dominion Energy and WEC Energy Group have slightly unfavorable global ratio profiles, each with about 21% favorable ratios and a notable portion of unfavorable metrics. WEC shows marginally better profitability and return on equity, while Dominion offers a higher dividend yield. Liquidity and asset turnover ratios are weak for both, suggesting neither company distinctly outperforms in ratio strength.
Strategic Positioning
This section compares the strategic positioning of Dominion Energy, Inc. (D) and WEC Energy Group, Inc. (WEC) regarding market position, key segments, and exposure to technological disruption:
Dominion Energy, Inc. (D)
- Large market cap of 49.5B with regulated electric focus, facing moderate competitive pressure.
- Key segments include Dominion Energy Virginia, Gas Distribution, South Carolina, and Contracted Energy.
- Limited explicit exposure to technological disruption noted; operates some renewable natural gas and solar generation.
WEC Energy Group, Inc. (WEC)
- Smaller market cap of 33.5B, also in regulated electric utilities with moderate competition.
- Key segments span Wisconsin, Illinois, Other States, Non-Utility Energy Infrastructure, and Electric Transmission.
- Exposure includes renewable and nonregulated renewable energy services alongside traditional energy sources.
Dominion Energy, Inc. (D) vs WEC Energy Group, Inc. (WEC) Positioning
D shows a more diversified regional and segment footprint with broader gas and electric operations, including contracted renewable assets. WEC focuses on a concentrated Midwestern market with a clearer emphasis on regulated electric and non-utility infrastructure segments. Both face moderate competition but differ in geographic and business segment diversification.
Which has the best competitive advantage?
Both companies are slightly unfavorable in MOAT evaluation, shedding value but with growing ROIC trends. Neither currently exhibits a strong competitive advantage based on ROIC versus WACC metrics for 2020-2024.
Stock Comparison
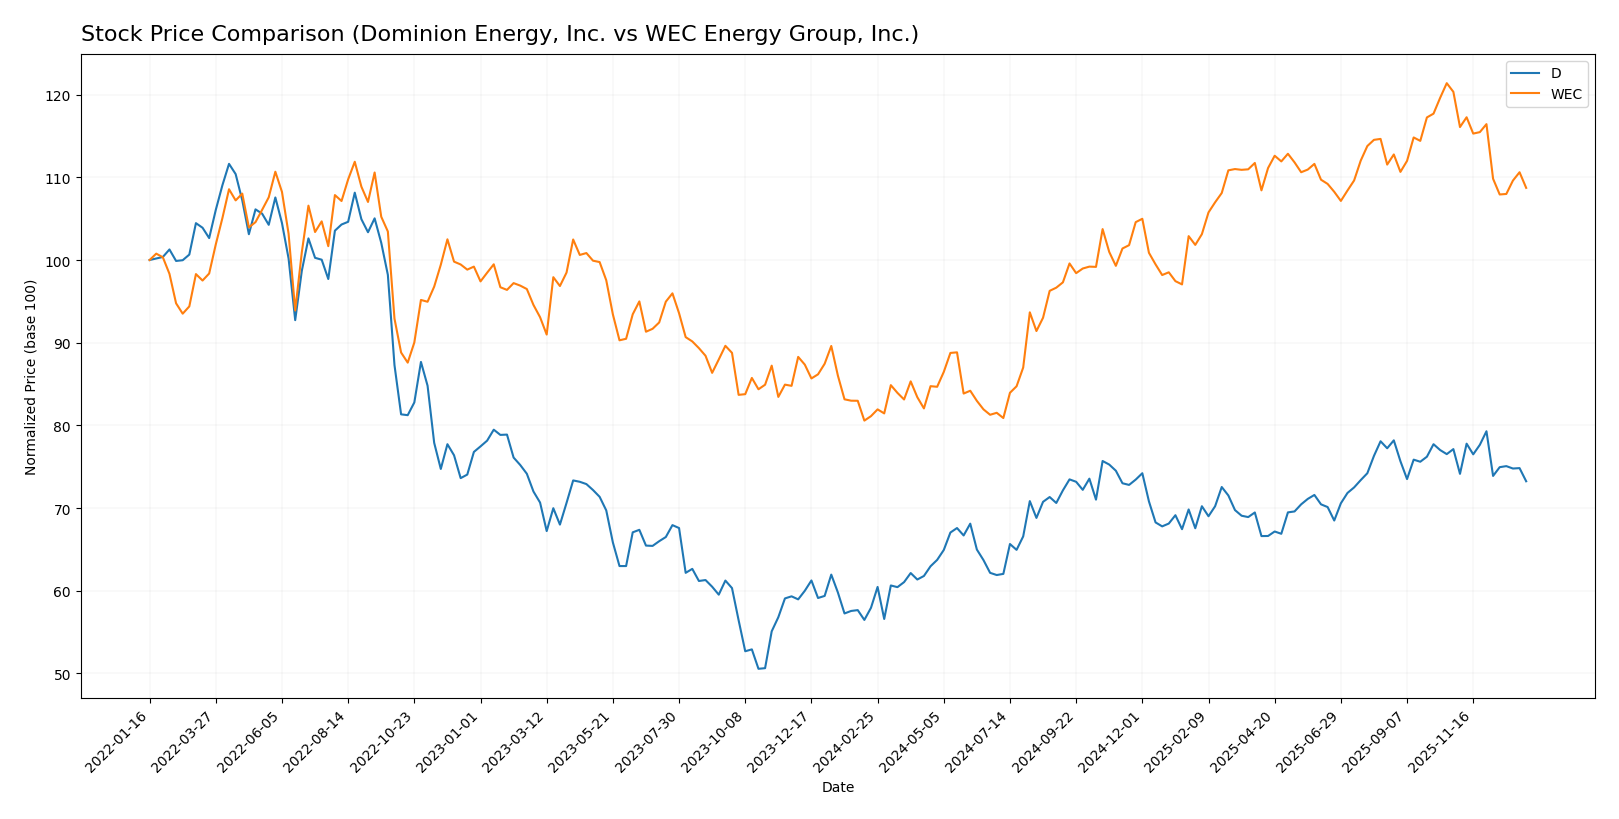
The stock price chart over the past 12 months reveals significant bullish trends for both Dominion Energy, Inc. and WEC Energy Group, Inc., with notable price increases followed by recent deceleration and downward pressure in the last quarter.
Trend Analysis
Dominion Energy, Inc. exhibited a 26.43% price increase over the past year, indicating a bullish trend with decelerating momentum; the stock ranged from a low of 44.79 to a high of 62.77. Recent months show a slight bearish correction of -5.04%.
WEC Energy Group, Inc. achieved a 34.05% price rise over the same period, also bullish with deceleration and higher volatility (std deviation 11.44). Its price fluctuated between 77.85 and 116.84, but recent trend shows a sharper decline of -9.65%.
Comparing the two, WEC Energy Group has delivered the highest market performance with a 34.05% gain, surpassing Dominion Energy’s 26.43% increase over the last year.
Target Prices
Analysts present a clear target price consensus for Dominion Energy, Inc. and WEC Energy Group, Inc.
| Company | Target High | Target Low | Consensus |
|---|---|---|---|
| Dominion Energy, Inc. | 70 | 63 | 66 |
| WEC Energy Group, Inc. | 136 | 105 | 122.67 |
The target consensus for Dominion Energy is $66, above its current price of $57.98, suggesting moderate upside potential. WEC Energy Group’s consensus of $122.67 also exceeds its $104.65 market price, indicating positive analyst expectations.
Analyst Opinions Comparison
This section compares analysts’ ratings and grades for Dominion Energy, Inc. (D) and WEC Energy Group, Inc. (WEC):
Rating Comparison
D Rating
- Rating: C+ with a very favorable status
- Discounted Cash Flow Score: 4, favorable
- ROE Score: 3, moderate
- ROA Score: 1, very unfavorable
- Debt To Equity Score: 3, moderate
- Overall Score: 2, moderate
WEC Rating
- Rating: B- with a very favorable status
- Discounted Cash Flow Score: 1, very unfavorable
- ROE Score: 4, favorable
- ROA Score: 4, favorable
- Debt To Equity Score: 2, moderate
- Overall Score: 3, moderate
Which one is the best rated?
Based strictly on the provided data, WEC holds a higher overall rating (B- vs. C+) and better scores in ROE and ROA, while D scores better on discounted cash flow. Overall, WEC is better rated by analysts.
Scores Comparison
The following table compares the Altman Z-Score and Piotroski Score of Dominion Energy, Inc. and WEC Energy Group, Inc.:
Dominion Energy, Inc. Scores
- Altman Z-Score: Unavailable for Dominion Energy
- Piotroski Score: 7, categorized as strong
WEC Energy Group, Inc. Scores
- Altman Z-Score: 1.14, indicates financial distress zone
- Piotroski Score: 6, categorized as average
Which company has the best scores?
Dominion Energy has a strong Piotroski Score of 7, while WEC Energy’s score is average at 6. WEC Energy’s Altman Z-Score indicates financial distress, whereas Dominion Energy’s Z-Score is unavailable.
Grades Comparison
Here is a comparison of the latest reliable grades from established financial institutions for both companies:
Dominion Energy, Inc. Grades
The following table summarizes recent grades and rating actions by major grading companies for Dominion Energy, Inc.:
| Grading Company | Action | New Grade | Date |
|---|---|---|---|
| Barclays | Maintain | Overweight | 2025-12-17 |
| JP Morgan | Maintain | Underweight | 2025-12-11 |
| BMO Capital | Maintain | Market Perform | 2025-11-03 |
| Morgan Stanley | Maintain | Equal Weight | 2025-10-22 |
| Barclays | Maintain | Overweight | 2025-10-07 |
| Morgan Stanley | Maintain | Equal Weight | 2025-09-25 |
| JP Morgan | Maintain | Underweight | 2025-08-21 |
| JP Morgan | Maintain | Underweight | 2025-07-15 |
| Morgan Stanley | Maintain | Equal Weight | 2025-06-18 |
| Morgan Stanley | Maintain | Equal Weight | 2025-05-22 |
Dominion Energy’s grades show a mixed but generally neutral trend, with several “Equal Weight” and “Market Perform” ratings balanced by some “Overweight” and “Underweight” opinions.
WEC Energy Group, Inc. Grades
The table below presents recent grades and rating actions by reputable grading firms for WEC Energy Group, Inc.:
| Grading Company | Action | New Grade | Date |
|---|---|---|---|
| B of A Securities | Maintain | Neutral | 2025-12-31 |
| UBS | Maintain | Neutral | 2025-12-17 |
| Barclays | Maintain | Underweight | 2025-12-16 |
| Keybanc | Maintain | Overweight | 2025-12-12 |
| JP Morgan | Maintain | Neutral | 2025-12-11 |
| Scotiabank | Maintain | Sector Outperform | 2025-10-31 |
| BMO Capital | Maintain | Market Perform | 2025-10-21 |
| Barclays | Maintain | Equal Weight | 2025-10-21 |
| Keybanc | Maintain | Overweight | 2025-10-15 |
| UBS | Maintain | Neutral | 2025-10-10 |
WEC Energy Group’s grades indicate a similarly balanced outlook, combining “Neutral,” “Overweight,” and “Market Perform” ratings with some indication of sector outperformance.
Which company has the best grades?
Both Dominion Energy, Inc. and WEC Energy Group, Inc. hold predominantly neutral consensus ratings with a mix of “Hold” and “Market Perform” grades. Dominion shows somewhat more divergence between “Overweight” and “Underweight” ratings, while WEC features more consistent “Neutral” and “Overweight” stances. For investors, this balanced grading suggests comparable market sentiment with moderate risk and reward expectations for both companies.
Strengths and Weaknesses
Below is a comparison table highlighting the key strengths and weaknesses of Dominion Energy, Inc. (D) and WEC Energy Group, Inc. (WEC) based on the most recent financial and operational data.
| Criterion | Dominion Energy, Inc. (D) | WEC Energy Group, Inc. (WEC) |
|---|---|---|
| Diversification | Moderate; mainly focused on energy in Virginia and South Carolina with some contracted energy | Moderate; concentrated in Wisconsin and Illinois with non-utility energy infrastructure |
| Profitability | Net margin 14.7% (favorable), but ROIC 2.9% (unfavorable) and ROE 7.8% (unfavorable) | Net margin 17.8% (favorable), ROIC 4.1% (unfavorable), ROE 12.3% (neutral) |
| Innovation | Limited innovation focus noted; growing ROIC indicating improved efficiency | Limited innovation focus; stable ROIC growth but still below cost of capital |
| Global presence | Primarily regional U.S. operations, no notable global footprint | Primarily regional U.S., focused in the Midwest with no global presence |
| Market Share | Strong in Virginia market with $10.2B revenue segment | Dominant in Wisconsin market with $6.3B revenue segment |
Key takeaways: Both companies show slightly unfavorable economic moats as their ROIC remains below WACC despite growing profitability. Dominion Energy has a larger revenue base but faces challenges in capital efficiency. WEC Energy maintains better profitability ratios but also needs to improve capital returns. Caution is advised due to their current value destruction status.
Risk Analysis
Below is a comparative overview of key risks for Dominion Energy, Inc. (D) and WEC Energy Group, Inc. (WEC) based on the most recent data:
| Metric | Dominion Energy, Inc. (D) | WEC Energy Group, Inc. (WEC) |
|---|---|---|
| Market Risk | Beta 0.699, moderate volatility | Beta 0.573, slightly lower volatility |
| Debt level | Debt-to-Equity 1.53 (unfavorable) | Debt-to-Equity 1.64 (unfavorable) |
| Regulatory Risk | High, given extensive regulated operations | High, similarly regulated utility business |
| Operational Risk | Large infrastructure (power lines, gas mains) increases complexity | Extensive network and multi-segment operations |
| Environmental Risk | Exposure to fossil fuel regulations; growing renewable assets | Mix of fossil fuels and renewables; regulatory pressure |
| Geopolitical Risk | US-focused operations, limited international exposure | US-focused, lower geopolitical risk |
Dominion Energy faces significant operational and debt risks with a slightly higher market beta, while WEC Energy, despite similar regulatory and operational risks, shows a lower market volatility but remains in financial distress per Altman Z-Score. Both companies are highly exposed to regulatory and environmental shifts impacting the utility sector.
Which Stock to Choose?
Dominion Energy, Inc. (D) shows a slightly unfavorable financial ratio profile with 50% unfavorable indicators despite favorable net margin (14.69%) and dividend yield (4.95%). Its income statement is globally favorable, with strong net income growth over 2020-2024 but carries high debt and moderate rating (C+).
WEC Energy Group, Inc. (WEC) presents a slightly more favorable ratio evaluation with fewer unfavorable metrics and a higher net margin at 17.77%. Its income statement is strongly favorable with consistent growth, supported by moderate debt and a better overall rating (B-).
Investors prioritizing income growth and profitability may find WEC’s stronger margins and rating more appealing, while those focused on dividend yield and improving profitability trends could see potential in Dominion Energy, given its favorable income growth despite some financial ratio weaknesses.
Disclaimer: Investment carries a risk of loss of initial capital. The past performance is not a reliable indicator of future results. Be sure to understand risks before making an investment decision.
Go Further
I encourage you to read the complete analyses of Dominion Energy, Inc. and WEC Energy Group, Inc. to enhance your investment decisions: