In the evolving utilities sector, The Southern Company (SO) and Dominion Energy, Inc. (D) stand out as leading players in regulated electric and natural gas services. Both companies share significant market overlap and emphasize innovation in renewable energy and infrastructure modernization. This comparison will explore their strengths and risks to help you identify which stock could be the most compelling addition to your investment portfolio. Let’s dive in to find the best opportunity for you.
Table of contents
Companies Overview
I will begin the comparison between The Southern Company and Dominion Energy, Inc. by providing an overview of these two companies and their main differences.
The Southern Company Overview
The Southern Company operates in the regulated electric industry, focusing on the generation, transmission, and distribution of electricity and natural gas. It serves approximately 8.7M customers across multiple states and manages a diversified portfolio including renewable energy projects, fossil fuel, nuclear, and hydroelectric stations. Headquartered in Atlanta, Georgia, it also provides digital wireless communications and fiber optics services.
Dominion Energy, Inc. Overview
Dominion Energy, Inc. produces and distributes energy through regulated electricity and natural gas operations serving around 6.3M customers in Virginia, North Carolina, South Carolina, and other states. Its business segments include electric generation, gas distribution, and nonregulated renewable energy projects. The company is headquartered in Richmond, Virginia, and operates extensive electric transmission and gas distribution infrastructure.
Key similarities and differences
Both companies operate in the regulated electric sector with significant natural gas distribution services and invest in renewable energy. Southern Company has a larger customer base and a broader energy generation mix including nuclear and hydroelectric power, while Dominion Energy has a more regionally focused footprint and additional nonregulated renewable and LNG operations. Southern employs nearly twice the full-time staff compared to Dominion.
Income Statement Comparison
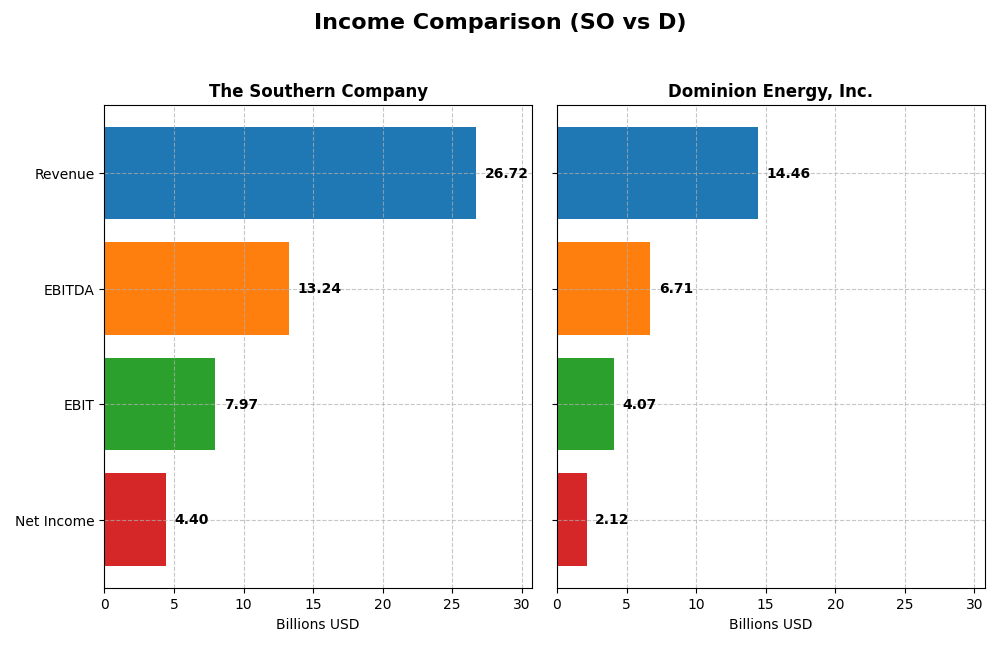
The following table compares key income statement metrics for The Southern Company and Dominion Energy, Inc. for the fiscal year 2024.
| Metric | The Southern Company (SO) | Dominion Energy, Inc. (D) |
|---|---|---|
| Market Cap | 95.7B | 49.5B |
| Revenue | 26.7B | 14.5B |
| EBITDA | 13.2B | 6.7B |
| EBIT | 7.97B | 4.07B |
| Net Income | 4.40B | 2.12B |
| EPS | 4.02 | 2.44 |
| Fiscal Year | 2024 | 2024 |
Income Statement Interpretations
The Southern Company
The Southern Company displayed a steady revenue growth of 31.16% from 2020 to 2024, with net income increasing 40.43%. Margins remained robust, with a gross margin of 49.93% and an EBIT margin of 29.83%, both favorable. In 2024, revenue rose by 5.83%, supported by a 13.96% jump in gross profit, while net margin growth was moderate at 4.6%, indicating stable profitability.
Dominion Energy, Inc.
Dominion Energy’s revenue showed minimal growth of 2.03% over the period but net income surged by 629.68%, reflecting improved operational efficiency. The company maintained favorable gross and EBIT margins at 47.87% and 28.14%, respectively. However, 2024 revenue growth slowed to 0.46%, with a slight decline in gross profit, although net margin and EPS grew by over 6%, signaling margin improvements despite flat top-line growth.
Which one has the stronger fundamentals?
Both companies demonstrate favorable income statement fundamentals, with The Southern Company showing consistent revenue and net income growth along with strong margins. Dominion Energy displays remarkable net income and margin growth but struggles with revenue stagnation and higher interest expenses. Southern’s broader favorable margin stability contrasts with Dominion’s mixed top-line performance, indicating differing strengths in their financial fundamentals.
Financial Ratios Comparison
The table below presents a side-by-side comparison of key financial ratios for The Southern Company (SO) and Dominion Energy, Inc. (D) for the fiscal year 2024, offering insights into their profitability, liquidity, leverage, efficiency, and dividend metrics.
| Ratios | The Southern Company (SO) | Dominion Energy, Inc. (D) |
|---|---|---|
| ROE | 13.25% | 7.79% |
| ROIC | 4.25% | 2.86% |
| P/E | 20.5 | 21.28 |
| P/B | 2.72 | 1.66 |
| Current Ratio | 0.67 | 0.71 |
| Quick Ratio | 0.46 | 0.52 |
| D/E (Debt-to-Equity) | 2.00 | 1.53 |
| Debt-to-Assets | 45.7% | 40.8% |
| Interest Coverage | 2.58 | 1.72 |
| Asset Turnover | 0.18 | 0.14 |
| Fixed Asset Turnover | 0.25 | 0.21 |
| Payout Ratio | 67.1% | 105.4% |
| Dividend Yield | 3.27% | 4.95% |
Interpretation of the Ratios
The Southern Company
The Southern Company shows a mixed ratio profile with favorable net margin (16.47%) and dividend yield (3.27%), but weak liquidity (current ratio 0.67), high leverage (debt-to-equity 2.0), and low asset turnover (0.18). Return on equity is neutral at 13.25%, while return on invested capital is unfavorable at 4.25%. Dividend payments appear sustainable given the coverage by free cash flow.
Dominion Energy, Inc.
Dominion Energy exhibits a favorable net margin (14.69%) and a higher dividend yield (4.95%) but faces challenges with a low return on equity (7.79%) and return on invested capital (2.86%). Liquidity ratios are weak (current ratio 0.71), and debt levels remain elevated (debt-to-equity 1.53). Dividend payments are supported but require monitoring due to cash flow constraints.
Which one has the best ratios?
Both companies display slightly unfavorable overall ratios with similar favorable ratios at 21.43%, but Dominion Energy has a higher proportion of unfavorable metrics (50%) compared to Southern Company (42.86%). Southern Company’s stronger return on equity and marginally better liquidity metrics suggest a modestly more balanced ratio profile.
Strategic Positioning
This section compares the strategic positioning of The Southern Company and Dominion Energy, Inc., including market position, key segments, and exposure to technological disruption:
The Southern Company
- Larger market cap of 95.7B USD with lower beta, indicating less volatility and competitive pressure.
- Diverse segments including electric utilities, gas distribution, marketing services, and renewable energy projects.
- Owns extensive renewable assets like solar, wind, hydro, and battery storage, showing significant exposure to energy transition.
Dominion Energy, Inc.
- Smaller market cap of 49.5B USD with higher beta, facing moderate competitive pressure in utilities.
- Concentrated segments focused on Virginia and South Carolina electricity, gas distribution, and contracted renewable energy.
- Operates nonregulated renewable natural gas and solar facilities, indicating moderate exposure to technological disruption.
The Southern Company vs Dominion Energy, Inc. Positioning
The Southern Company’s diversified portfolio spans multiple energy and gas segments providing scale advantages, while Dominion Energy focuses regionally with contracted renewable assets, offering concentrated operational focus but less geographic diversification.
Which has the best competitive advantage?
Both companies have a slightly unfavorable MOAT status due to ROIC below WACC but showing growing profitability. The Southern Company’s larger scale and diversified operations may suggest a more stable competitive advantage despite value destruction.
Stock Comparison
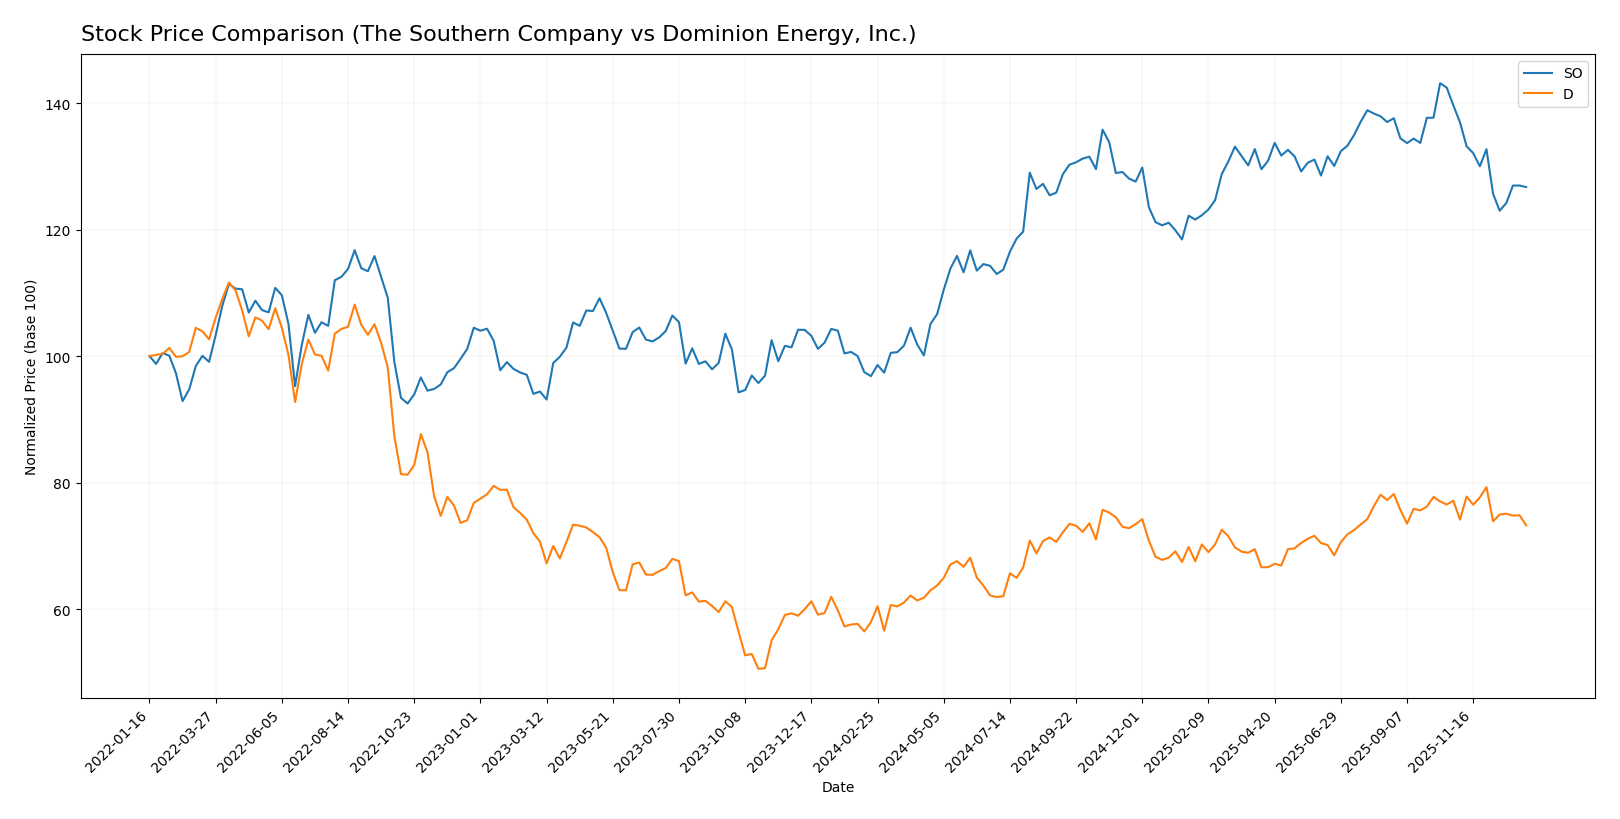
The stock price movements of The Southern Company (SO) and Dominion Energy, Inc. (D) over the past year reveal bullish trends with notable deceleration, accompanied by recent short-term declines and varying volume dynamics.
Trend Analysis
The Southern Company’s stock showed a bullish trend with a 30.88% increase over the past year, marked by deceleration and a high volatility of 7.54%. A recent short-term decline of 9.25% indicates a temporary pullback.
Dominion Energy’s stock also exhibited a bullish trend, rising 26.43% over the last 12 months with lower volatility at 4.03%. The recent trend shows a 5.04% decrease, reflecting a mild downward pressure near year-end.
Comparing both, The Southern Company delivered a higher market performance with a larger overall gain despite stronger recent selling pressure, while Dominion Energy maintained steadier volume dominance.
Target Prices
The latest analyst consensus provides a clear outlook for The Southern Company and Dominion Energy, Inc.
| Company | Target High | Target Low | Consensus |
|---|---|---|---|
| The Southern Company | 103 | 76 | 93.1 |
| Dominion Energy, Inc. | 70 | 63 | 66 |
Analysts expect The Southern Company’s stock to trade above its current price of $87.01, indicating potential upside. Dominion Energy’s consensus target of $66 also suggests room for growth above its current $57.98 price.
Analyst Opinions Comparison
This section compares analysts’ ratings and grades for The Southern Company and Dominion Energy, Inc.:
Rating Comparison
The Southern Company Rating
- Rating: B-, considered very favorable by analysts.
- Discounted Cash Flow Score: Moderate at 3 out of 5.
- ROE Score: Favorable at 4, showing efficient profit generation.
- ROA Score: Moderate at 3, reflecting average asset use.
- Debt To Equity Score: Very unfavorable at 1, signaling high financial risk.
- Overall Score: Moderate at 3, reflecting average financial standing.
Dominion Energy, Inc. Rating
- Rating: C+, also considered very favorable overall.
- Discounted Cash Flow Score: Favorable at 4 out of 5.
- ROE Score: Moderate at 3, indicating average efficiency.
- ROA Score: Very unfavorable at 1, indicating weak asset use.
- Debt To Equity Score: Moderate at 3, indicating balanced leverage.
- Overall Score: Moderate at 2, slightly below Southern Co.
Which one is the best rated?
The Southern Company holds a higher overall rating (B-) and stronger scores in ROE and ROA, but suffers from a weak debt-to-equity score. Dominion Energy has a better discounted cash flow and debt-to-equity profile but lower overall and asset efficiency scores. Based solely on the data, Southern Co. is better rated.
Scores Comparison
Here is a comparison of the Altman Z-Score and Piotroski Score for The Southern Company and Dominion Energy, Inc.:
The Southern Company Scores
- Altman Z-Score: 0.98, indicating financial distress zone risk of bankruptcy.
- Piotroski Score: 6, reflecting an average financial strength rating.
Dominion Energy, Inc. Scores
- Altman Z-Score: Unavailable, no data provided.
- Piotroski Score: 7, indicating strong financial strength.
Which company has the best scores?
Dominion Energy, Inc. has a higher Piotroski Score (7 vs. 6), suggesting stronger financial health. The Southern Company’s Altman Z-Score indicates financial distress, while Dominion’s Altman score is unavailable for comparison.
Grades Comparison
Here is a detailed comparison of the recent grades assigned to The Southern Company and Dominion Energy, Inc.:
The Southern Company Grades
This table summarizes recent grades and actions from major financial institutions for The Southern Company.
| Grading Company | Action | New Grade | Date |
|---|---|---|---|
| UBS | Maintain | Neutral | 2025-12-17 |
| JP Morgan | Maintain | Neutral | 2025-12-15 |
| Jefferies | Maintain | Neutral | 2025-12-15 |
| RBC Capital | Maintain | Sector Perform | 2025-12-12 |
| Keybanc | Maintain | Underweight | 2025-12-12 |
| Mizuho | Maintain | Neutral | 2025-12-11 |
| Barclays | Maintain | Equal Weight | 2025-11-20 |
| Jefferies | Downgrade | Neutral | 2025-11-05 |
| Ladenburg Thalmann | Downgrade | Neutral | 2025-10-17 |
| Keybanc | Maintain | Underweight | 2025-10-15 |
Overall, The Southern Company’s grades show a predominantly neutral to underweight stance, with recent downgrades from buy ratings to neutral.
Dominion Energy, Inc. Grades
Below is a summary of recent grades and rating actions for Dominion Energy, Inc.
| Grading Company | Action | New Grade | Date |
|---|---|---|---|
| Barclays | Maintain | Overweight | 2025-12-17 |
| JP Morgan | Maintain | Underweight | 2025-12-11 |
| BMO Capital | Maintain | Market Perform | 2025-11-03 |
| Morgan Stanley | Maintain | Equal Weight | 2025-10-22 |
| Barclays | Maintain | Overweight | 2025-10-07 |
| Morgan Stanley | Maintain | Equal Weight | 2025-09-25 |
| JP Morgan | Maintain | Underweight | 2025-08-21 |
| JP Morgan | Maintain | Underweight | 2025-07-15 |
| Morgan Stanley | Maintain | Equal Weight | 2025-06-18 |
| Morgan Stanley | Maintain | Equal Weight | 2025-05-22 |
Dominion Energy’s grades reflect a mixed but stable outlook, with significant overweight ratings balanced by underweight and equal weight opinions.
Which company has the best grades?
Dominion Energy, Inc. displays a stronger rating profile with several overweight grades from Barclays, compared to The Southern Company’s mainly neutral to underweight grades. This contrast may influence investors’ perception of relative growth potential and risk between the two utilities.
Strengths and Weaknesses
Below is a comparative overview of The Southern Company (SO) and Dominion Energy, Inc. (D) based on key financial and strategic criteria as of 2024.
| Criterion | The Southern Company (SO) | Dominion Energy, Inc. (D) |
|---|---|---|
| Diversification | Moderate: Primarily Electric Utilities and Gas segments; Southern Company Gas accounts for $4.46B revenue | Moderate: Focused on Dominion Energy Virginia ($10.24B) and South Carolina ($3.3B) plus Contracted Energy ($1.1B) |
| Profitability | Net margin strong at 16.47%; ROIC 4.25% below WACC 4.96%, indicating slight value destruction but improving ROIC trend | Net margin solid at 14.69%; ROIC 2.86% below WACC 5.34%, also value destroying but with a stronger ROIC growth trend |
| Innovation | Limited data on innovation; traditional utilities with growing ROIC suggests operational improvements | Similar limited innovation exposure; ROIC growth indicates efficiency gains but challenges remain |
| Global presence | Primarily US-based operations with no significant global footprint | Also US-focused with regional dominance in Virginia and South Carolina; no global presence |
| Market Share | Large electric utilities market share in the Southeast US | Strong market share in Virginia and South Carolina energy markets |
Key takeaways: Both companies show solid profitability but are shedding value as ROIC remains below their cost of capital. However, improving ROIC trends suggest operational efficiencies. Their diversification is regionally concentrated, and innovation exposure appears limited, implying cautious risk management is advisable.
Risk Analysis
Below is a comparative overview of key risks for The Southern Company (SO) and Dominion Energy, Inc. (D) based on their latest 2024 financial and operational data:
| Metric | The Southern Company (SO) | Dominion Energy, Inc. (D) |
|---|---|---|
| Market Risk | Low beta (0.447) indicating less volatility relative to market | Moderate beta (0.699) suggesting higher sensitivity to market swings |
| Debt level | High debt-to-equity ratio (2.0), unfavorable leverage score | Moderate debt-to-equity ratio (1.53), somewhat better leverage profile |
| Regulatory Risk | High due to extensive regulated electric and gas operations | Similar regulatory exposure across multiple states and segments |
| Operational Risk | Large asset base with fossil, nuclear, renewable plants increases complexity | Diverse operations with gas, electric, and contracted assets add operational challenges |
| Environmental Risk | Transition risks from fossil fuels to renewables; owns many fossil fuel stations | Greater focus on renewables and LNG, but still exposed to fossil fuel environmental risks |
| Geopolitical Risk | Primarily US-focused, low direct geopolitical risk | Also US-focused, but with assets in multiple states, moderate regional risk |
The most impactful risks are Southern Company’s high leverage and operational complexity, which could affect financial flexibility. Dominion Energy faces moderate market sensitivity and regulatory risks but benefits from a stronger environmental transition focus. Both companies have moderate to high debt levels that warrant cautious risk management.
Which Stock to Choose?
The Southern Company (SO) shows a favorable income evolution with 31.16% revenue growth over 2020-2024 and a 40.43% net income increase. Its financial ratios reveal a slightly unfavorable profile due to high debt and liquidity concerns, despite a favorable net margin (16.47%) and dividend yield (3.27%). The company’s ROIC is below WACC, indicating value destruction, but ROIC is growing, and overall rating is very favorable (B-).
Dominion Energy, Inc. (D) has a more modest revenue growth of 2.03% over the period but a large net income increase of 629.68%. Its financial ratios also appear slightly unfavorable, with notably higher debt and weaker profitability metrics, including a lower ROE (7.79%) and ROIC below WACC. The company’s income statement is favorable but with some negative growth elements. Its overall rating is very favorable (C+), and Piotroski score indicates stronger financial health than SO.
For investors focused on income stability and moderate growth, The Southern Company’s stronger revenue growth and higher net margin might appear more attractive. Conversely, those prioritizing financial strength and potential value improvement could view Dominion Energy’s improving profitability and stronger Piotroski score as favorable. Both companies show signs of value destruction but with growing profitability, suggesting caution and a need for careful risk assessment.
Disclaimer: Investment carries a risk of loss of initial capital. The past performance is not a reliable indicator of future results. Be sure to understand risks before making an investment decision.
Go Further
I encourage you to read the complete analyses of The Southern Company and Dominion Energy, Inc. to enhance your investment decisions: