Dominion Energy, Inc. (D) and Public Service Enterprise Group Incorporated (PEG) are two leading players in the regulated electric utility sector, serving millions of customers across key U.S. regions. Both companies emphasize innovation through renewable energy investments and infrastructure modernization, positioning themselves for the evolving energy landscape. This article will provide a clear comparison to help investors identify which company offers the most compelling opportunity for their portfolio.
Table of contents
Companies Overview
I will begin the comparison between Dominion Energy, Inc. and Public Service Enterprise Group Incorporated by providing an overview of these two companies and their main differences.
Dominion Energy Overview
Dominion Energy, Inc. is a US-based utility company focused on producing and distributing energy through regulated electric and gas operations. It serves millions of customers across Virginia, North Carolina, South Carolina, and several other states. The company operates a diversified portfolio, including regulated electricity generation, gas distribution, renewable natural gas, and contracted renewable energy assets, positioning itself as a significant player in the energy infrastructure sector.
Public Service Enterprise Group Overview
Public Service Enterprise Group Incorporated operates primarily in the Northeastern and Mid-Atlantic US regions, providing electricity and gas transmission and distribution services. Its main segments include PSE&G and PSEG Power, with investments in solar generation and energy efficiency programs. The company manages extensive electric and gas infrastructure, serving residential, commercial, and industrial customers, and emphasizes sustainable energy solutions alongside traditional utility services.
Key similarities and differences
Both companies operate in the regulated electric utility industry, focusing on electricity and gas distribution to a broad customer base. Dominion Energy has a larger market capitalization and a more diversified asset base, including significant renewable energy contracts and natural gas services across multiple states. In contrast, Public Service Enterprise Group concentrates on the Northeastern US with a strong emphasis on solar projects and energy efficiency programs, reflecting slightly different regional focuses and strategic priorities within the utilities sector.
Income Statement Comparison
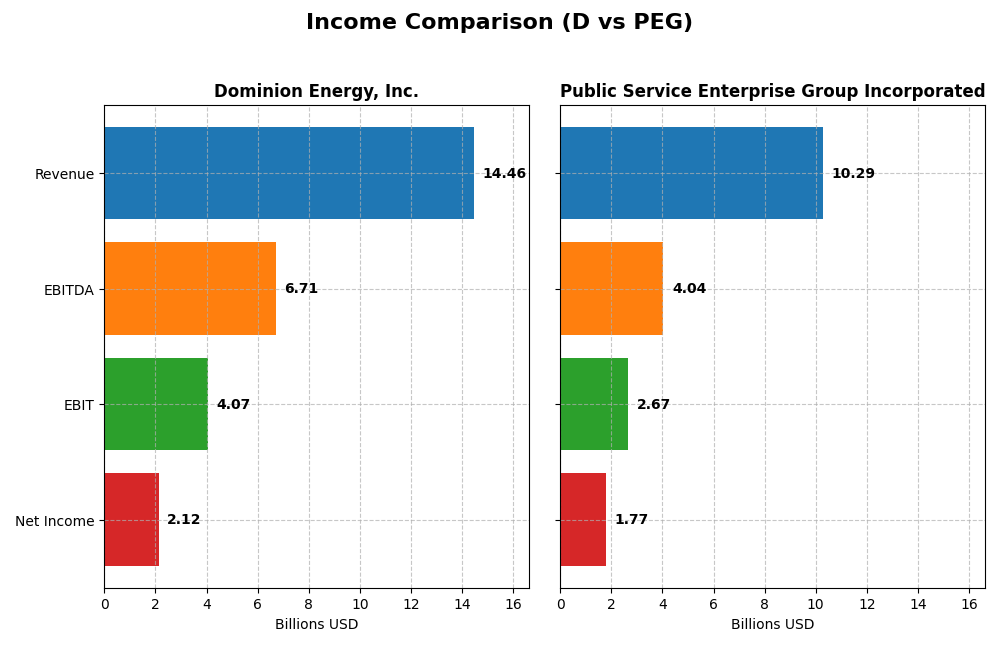
The following table compares key income statement metrics for Dominion Energy, Inc. and Public Service Enterprise Group Incorporated for the fiscal year 2024.
| Metric | Dominion Energy, Inc. | Public Service Enterprise Group Incorporated |
|---|---|---|
| Market Cap | 49.5B | 39.3B |
| Revenue | 14.5B | 10.3B |
| EBITDA | 6.7B | 4.0B |
| EBIT | 4.1B | 2.7B |
| Net Income | 2.1B | 1.8B |
| EPS | 2.44 | 3.56 |
| Fiscal Year | 2024 | 2024 |
Income Statement Interpretations
Dominion Energy, Inc.
Dominion Energy’s revenue demonstrated modest growth from 2020 to 2024, with a slight 0.46% increase in the latest year, while net income surged significantly by over 600% during the period. Gross and EBIT margins remained favorable and stable, with a 47.87% gross margin and 28.14% EBIT margin in 2024. Despite a small decline in gross profit last year, net margin and EPS improved, reflecting enhanced profitability.
Public Service Enterprise Group Incorporated
Public Service Enterprise Group’s revenue showed a neutral overall growth of 7.15% from 2020 to 2024 but declined by 8.43% in 2024 alone. The company’s net income and margins deteriorated over the period, with net income shrinking nearly 7% and net margin dropping by more than 13%. The latest year saw marked declines in EBIT, net margin, and EPS, indicating worsening profitability and operational challenges.
Which one has the stronger fundamentals?
Dominion Energy exhibits stronger fundamentals with mostly favorable margins, significant net income growth, and improving EPS, despite some pressure on interest expenses and revenue growth. Conversely, Public Service Enterprise Group faces unfavorable trends with shrinking profitability and negative growth metrics. Overall, Dominion Energy’s income statement presents a more favorable financial health profile.
Financial Ratios Comparison
The table below compares key financial ratios for Dominion Energy, Inc. (D) and Public Service Enterprise Group Incorporated (PEG) based on their most recent fiscal year data (2024).
| Ratios | Dominion Energy, Inc. (D) | Public Service Enterprise Group (PEG) |
|---|---|---|
| ROE | 7.79% | 10.99% |
| ROIC | 2.86% | 4.40% |
| P/E | 21.3 | 23.7 |
| P/B | 1.66 | 2.61 |
| Current Ratio | 0.71 | 0.65 |
| Quick Ratio | 0.52 | 0.48 |
| D/E | 1.53 | 1.42 |
| Debt-to-Assets | 40.8% | 41.9% |
| Interest Coverage | 1.72 | 2.80 |
| Asset Turnover | 0.14 | 0.19 |
| Fixed Asset Turnover | 0.21 | 0.26 |
| Payout ratio | 105.4% | 67.5% |
| Dividend yield | 4.95% | 2.84% |
Interpretation of the Ratios
Dominion Energy, Inc.
Dominion Energy shows a mixed ratio profile with a strong net margin of 14.69% and a favorable dividend yield of 4.95%, but weaker returns on equity (7.79%) and invested capital (2.86%). The company faces unfavorable liquidity ratios and asset turnover, raising concerns about operational efficiency. Dividend payments are sustained with a moderate payout, yet coverage by free cash flow is negative, indicating potential risk in distribution sustainability.
Public Service Enterprise Group Incorporated
Public Service Enterprise Group demonstrates a favorable net margin of 17.22% and a decent return on equity of 11%, though return on invested capital is slightly weak at 4.4%. Liquidity measures remain below ideal levels, and asset turnover is also unfavorable. The company maintains dividend payments with a 2.84% yield, supported by a stable payout policy, but free cash flow coverage is negative, suggesting some caution for dividend sustainability.
Which one has the best ratios?
Both companies present slightly unfavorable global ratio profiles with 21.43% favorable and between 42.86% to 50% unfavorable ratios. Dominion Energy has stronger dividend yield but weaker returns and liquidity, while Public Service Enterprise Group has better profitability ratios but lower dividend yield. The choice depends on prioritizing yield versus profitability and operational efficiency.
Strategic Positioning
This section compares the strategic positioning of Dominion Energy, Inc. and Public Service Enterprise Group Incorporated, including Market position, Key segments, and disruption:
Dominion Energy, Inc.
- Leading regulated electric utility with significant market cap and moderate competitive pressure.
- Diverse segments with emphasis on regulated electricity and gas distribution across multiple states.
- Exposure includes nonregulated renewable energy and gas infrastructure; moderate technological disruption risk.
Public Service Enterprise Group Incorporated
- Regulated electric utility with slightly smaller market cap, serving Northeastern and Mid-Atlantic US markets.
- Focused on electricity and gas transmission, distribution, and solar investments primarily in Northeast and Mid-Atlantic.
- Invests in solar and energy efficiency; primarily regulated utility with moderate exposure to technological changes.
Dominion Energy, Inc. vs Public Service Enterprise Group Incorporated Positioning
Dominion Energy exhibits a more diversified geographic and segment presence across regulated electricity and gas, while Public Service Enterprise Group concentrates on Northeastern markets with emphasis on transmission and solar. Dominion’s broader footprint offers varied revenue streams; PEG’s focus may allow operational efficiencies but limits geographic diversification.
Which has the best competitive advantage?
Both companies have slightly unfavorable MOAT evaluations, shedding value but showing growing ROIC trends. Dominion Energy’s larger scale and diversified segments contrast with PEG’s regional focus, yet neither currently demonstrates a strong sustainable competitive advantage based on ROIC versus WACC.
Stock Comparison
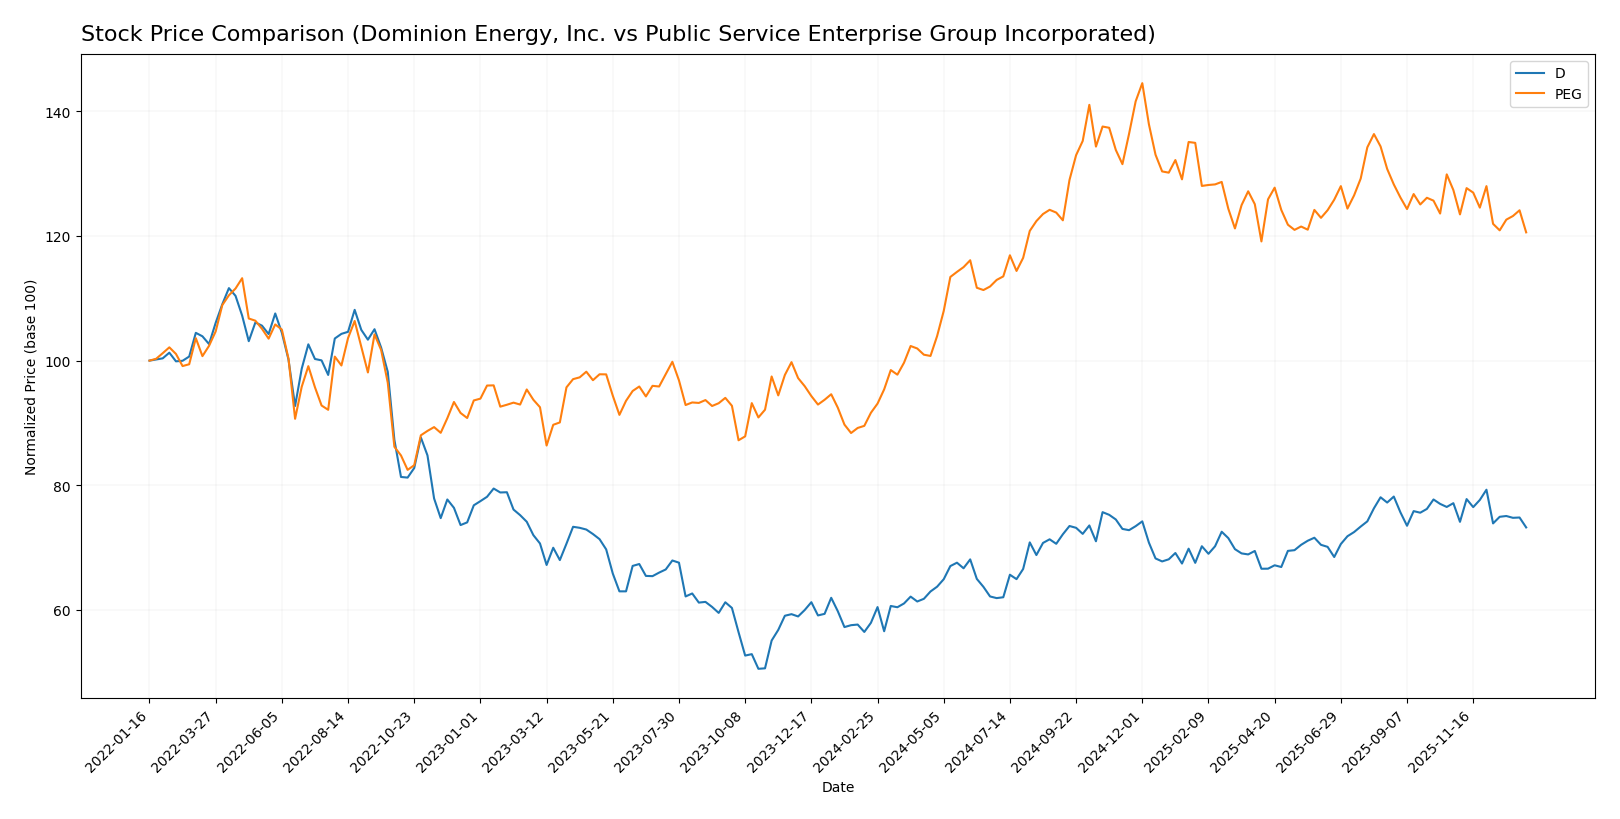
The stock price movements of Dominion Energy, Inc. (D) and Public Service Enterprise Group Incorporated (PEG) over the past year reveal distinct bullish trends with notable deceleration phases and recent short-term declines in both equities.
Trend Analysis
Dominion Energy, Inc. exhibited a bullish trend over the past 12 months with a 26.43% price increase, showing deceleration and a price range between 44.79 and 62.77. The recent three-month period reveals a -5.04% pullback with mild volatility.
Public Service Enterprise Group Incorporated posted a stronger 31.59% bullish trend over the year, also with deceleration and higher volatility, ranging from 59.79 to 94.3. Its recent quarterly trend declined by -5.33%, accompanied by slightly higher short-term volatility.
Comparing the two, PEG outperformed Dominion Energy over the 12-month span with a higher overall price gain, despite both facing recent downward corrections.
Target Prices
Here is the current consensus of analyst target prices for these utilities stocks.
| Company | Target High | Target Low | Consensus |
|---|---|---|---|
| Dominion Energy, Inc. | 70 | 63 | 66 |
| Public Service Enterprise Group Incorporated | 98 | 83 | 89 |
Analysts expect Dominion Energy’s price to appreciate moderately from its current $57.98, while Public Service Enterprise Group shows stronger upside potential versus its $78.68 market price.
Analyst Opinions Comparison
This section compares analysts’ ratings and grades for Dominion Energy, Inc. (D) and Public Service Enterprise Group Incorporated (PEG):
Rating Comparison
D Rating
- Rating: C+ with a very favorable status.
- Discounted Cash Flow Score: 4, favorable rating.
- ROE Score: 3, moderate rating.
- ROA Score: 1, very unfavorable rating.
- Debt To Equity Score: 3, moderate rating.
- Overall Score: 2, moderate rating.
PEG Rating
- Rating: B- with a very favorable status.
- Discounted Cash Flow Score: 1, very unfavorable.
- ROE Score: 4, favorable rating.
- ROA Score: 4, favorable rating.
- Debt To Equity Score: 2, moderate rating.
- Overall Score: 3, moderate rating.
Which one is the best rated?
Based on the data, PEG holds a higher overall rating (B-) and better scores in ROE and ROA, while D has a stronger discounted cash flow score. PEG is generally better rated overall.
Scores Comparison
The following table compares the Altman Z-Score and Piotroski Score of Dominion Energy, Inc. (D) and Public Service Enterprise Group Incorporated (PEG):
D Scores
- Altman Z-Score: Unavailable for D
- Piotroski Score: 7, reflecting strong financial health
PEG Scores
- Altman Z-Score: 1.32, indicating distress zone risk
- Piotroski Score: 7, reflecting strong financial health
Which company has the best scores?
Based on the provided data, PEG has a measurable Altman Z-Score indicating financial distress risk, while D’s score is unavailable. Both companies share equally strong Piotroski Scores of 7, showing similar financial strength.
Grades Comparison
Here is the grades comparison for Dominion Energy, Inc. and Public Service Enterprise Group Incorporated:
Dominion Energy, Inc. Grades
The following table summarizes the recent grades from recognized financial institutions for Dominion Energy, Inc.:
| Grading Company | Action | New Grade | Date |
|---|---|---|---|
| Barclays | Maintain | Overweight | 2025-12-17 |
| JP Morgan | Maintain | Underweight | 2025-12-11 |
| BMO Capital | Maintain | Market Perform | 2025-11-03 |
| Morgan Stanley | Maintain | Equal Weight | 2025-10-22 |
| Barclays | Maintain | Overweight | 2025-10-07 |
| Morgan Stanley | Maintain | Equal Weight | 2025-09-25 |
| JP Morgan | Maintain | Underweight | 2025-08-21 |
| JP Morgan | Maintain | Underweight | 2025-07-15 |
| Morgan Stanley | Maintain | Equal Weight | 2025-06-18 |
| Morgan Stanley | Maintain | Equal Weight | 2025-05-22 |
Dominion Energy’s grades show a predominance of hold and neutral ratings, with some overweight and underweight views, indicating a mixed but generally cautious stance among analysts.
Public Service Enterprise Group Incorporated Grades
The table below shows the latest grading from verified firms for Public Service Enterprise Group Incorporated:
| Grading Company | Action | New Grade | Date |
|---|---|---|---|
| Ladenburg Thalmann | Upgrade | Buy | 2026-01-07 |
| UBS | Maintain | Buy | 2025-12-17 |
| JP Morgan | Maintain | Overweight | 2025-12-12 |
| Jefferies | Upgrade | Buy | 2025-11-06 |
| TD Cowen | Maintain | Buy | 2025-11-05 |
| BMO Capital | Maintain | Market Perform | 2025-11-04 |
| Barclays | Maintain | Equal Weight | 2025-10-21 |
| BMO Capital | Maintain | Market Perform | 2025-10-20 |
| Morgan Stanley | Maintain | Overweight | 2025-09-25 |
| BMO Capital | Maintain | Market Perform | 2025-08-06 |
Public Service Enterprise Group has predominantly buy and overweight grades, with several upgrades, reflecting a generally positive outlook from analysts.
Which company has the best grades?
Public Service Enterprise Group Incorporated has received stronger grades overall, with numerous buy and overweight ratings, compared to Dominion Energy’s more neutral and mixed grades. This difference may influence investors seeking growth or positive momentum to consider the relative analyst sentiment in their decisions.
Strengths and Weaknesses
Below is a comparative table highlighting key strengths and weaknesses of Dominion Energy, Inc. (D) and Public Service Enterprise Group Incorporated (PEG) based on recent financial and operational data.
| Criterion | Dominion Energy, Inc. (D) | Public Service Enterprise Group (PEG) |
|---|---|---|
| Diversification | Strong regional energy segmentation: Virginia (10.2B), South Carolina (3.3B), Contracted Energy (1.1B) | Broad energy portfolio with significant gas distribution (2.1B) and transmission (1.75B) segments |
| Profitability | Net margin 14.7% (favorable); ROIC 2.9% (unfavorable, below WACC 5.3%) | Net margin 17.2% (favorable); ROIC 4.4% (unfavorable, below WACC 5.4%) |
| Innovation | Moderate focus; ROIC growing but still value-destroying | ROIC growing, slightly better value retention but still shedding value |
| Global presence | Primarily regional US focus, limited international exposure | Similar US regional concentration, slightly more diversified contracts |
| Market Share | Leading energy provider in Virginia and South Carolina markets | Strong regional presence with growing gas distribution and transmission services |
Key takeaways: Both Dominion Energy and PEG exhibit favorable profitability margins but struggle to generate returns above their cost of capital, indicating slight value destruction. However, both companies show improving ROIC trends, suggesting enhanced operational efficiency. Their regional diversification and strong market positions offer stability, though investors should monitor capital efficiency closely.
Risk Analysis
Below is a comparative risk assessment table for Dominion Energy, Inc. (D) and Public Service Enterprise Group Incorporated (PEG) based on the most recent data from 2024.
| Metric | Dominion Energy, Inc. (D) | Public Service Enterprise Group (PEG) |
|---|---|---|
| Market Risk | Beta 0.70, moderate volatility | Beta 0.61, slightly lower volatility |
| Debt level | Debt-to-Equity 1.53 (unfavorable) | Debt-to-Equity 1.42 (unfavorable) |
| Regulatory Risk | High, due to extensive regulated electric and gas operations | High, with significant regulated utility footprint |
| Operational Risk | Large asset base with complex operations in multiple states | Extensive infrastructure but concentrated in Northeastern US |
| Environmental Risk | Transition to renewables ongoing; exposure to regulatory changes | Active solar investments; environmental compliance critical |
| Geopolitical Risk | Moderate, primarily US-focused with regional dependencies | Moderate, US regional exposure with energy policy impact |
Both companies face market risks with moderate beta values, indicating some sensitivity to market fluctuations. Debt levels are high for both, which could constrain financial flexibility. Regulatory risk remains significant given their regulated utility status, with environmental regulations increasingly shaping operations. PEG’s Altman Z-Score indicates financial distress risk, while Dominion maintains a stronger overall financial rating. The most impactful risks are regulatory and debt-related, as they influence long-term stability and growth potential.
Which Stock to Choose?
Dominion Energy, Inc. (D) shows a mostly favorable income statement with growing profitability, yet revenue growth is weak. Its financial ratios reveal mixed signals: favorable net margin and dividend yield contrast with several unfavorable metrics, including ROE and asset turnover. The company carries significant debt and receives a very favorable overall rating of C+.
Public Service Enterprise Group Incorporated (PEG) presents an unfavorable income trend with declines in net income and earnings per share over the period. Its financial ratios are slightly more balanced, with a favorable net margin and moderate debt levels, but also several unfavorable indicators. PEG holds a very favorable rating of B- despite showing distress in Altman Z-Score.
For investors prioritizing growth and improving profitability, Dominion Energy’s rising income metrics and stable dividend yield might appear attractive despite some financial weaknesses. Conversely, PEG’s profile could be more appealing to those accepting higher risk given its distressed financial score but stronger ROE and asset utilization. The choice may depend on individual risk tolerance and investment strategy, as both companies exhibit slightly unfavorable financial ratios and are currently value-destroyers with improving profitability.
Disclaimer: Investment carries a risk of loss of initial capital. The past performance is not a reliable indicator of future results. Be sure to understand risks before making an investment decision.
Go Further
I encourage you to read the complete analyses of Dominion Energy, Inc. and Public Service Enterprise Group Incorporated to enhance your investment decisions: