Dominion Energy, Inc. (D) and PPL Corporation (PPL) are two prominent players in the regulated electric utility sector, both delivering energy solutions across key U.S. regions. Their overlapping market presence and distinct approaches to innovation in renewable and traditional energy make them ideal candidates for comparison. In this article, I will analyze both companies to help you determine which one offers the most compelling investment opportunity.
Table of contents
Companies Overview
I will begin the comparison between Dominion Energy, Inc. and PPL Corporation by providing an overview of these two companies and their main differences.
Dominion Energy Overview
Dominion Energy, Inc. is a US-based utility company focused on producing and distributing energy through regulated electric and gas operations. It serves millions of customers across multiple states including Virginia, North Carolina, South Carolina, Ohio, and others. The company operates significant electric generating capacity and extensive transmission and distribution infrastructure, with additional involvement in renewable energy and gas transportation.
PPL Corporation Overview
PPL Corporation is a utility holding company delivering electricity and natural gas in the United States and the UK. It operates mainly through Kentucky and Pennsylvania segments, serving over two million customers in these regions. PPL generates electricity from coal, gas, hydro, and solar sources and also sells wholesale electricity. Founded in 1920, it maintains a strong regional presence with a focus on regulated utilities.
Key similarities and differences
Both Dominion Energy and PPL operate in the regulated electric utility sector, serving residential, commercial, and industrial customers. Dominion Energy has a broader geographic footprint and larger asset base, including a significant renewable energy segment. PPL, while smaller, also focuses on diversified energy generation and serves customers in both the US and the UK. Each company emphasizes regulated operations but differs in scale and regional concentration.
Income Statement Comparison
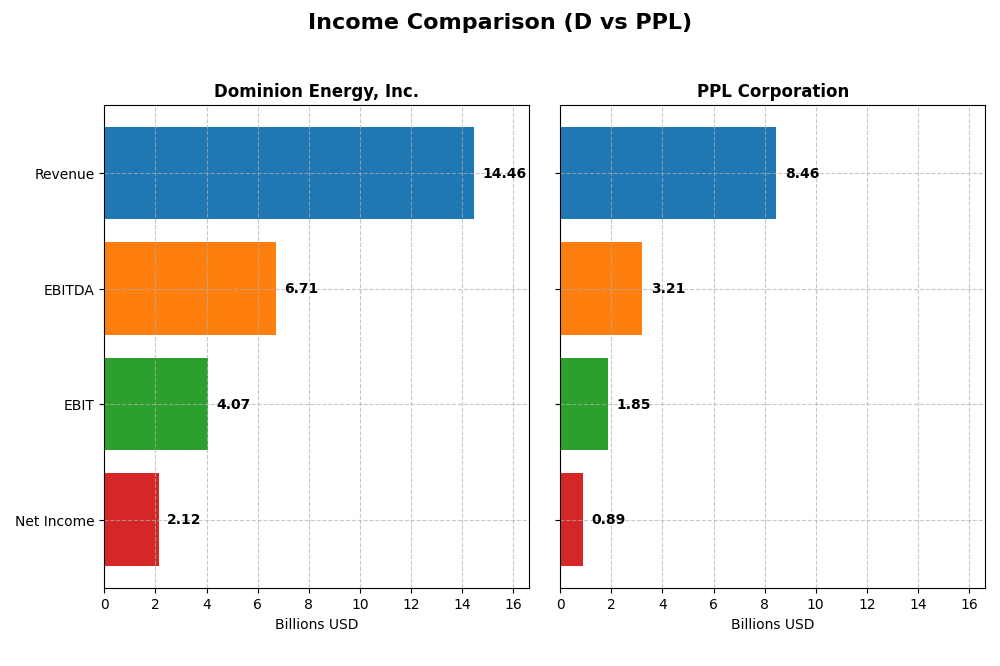
The table below presents a side-by-side comparison of key income statement metrics for Dominion Energy, Inc. and PPL Corporation for the fiscal year ended 2024.
| Metric | Dominion Energy, Inc. | PPL Corporation |
|---|---|---|
| Market Cap | 49.5B | 25.6B |
| Revenue | 14.46B | 8.46B |
| EBITDA | 6.71B | 3.21B |
| EBIT | 4.07B | 1.85B |
| Net Income | 2.12B | 888M |
| EPS | 2.44 | 1.20 |
| Fiscal Year | 2024 | 2024 |
Income Statement Interpretations
Dominion Energy, Inc.
Dominion Energy’s revenue grew modestly from 2020 to 2024, with a 2.03% overall increase, while net income surged by 630%, indicating strong profitability improvements. Gross and EBIT margins remain favorable, around 48% and 28%, respectively. The 2024 fiscal year saw a slight revenue growth slowdown (0.46%) but improvements in EBIT and net margin growth, signaling enhanced operational efficiency.
PPL Corporation
PPL’s revenue increased significantly by 54.6% over the 2020-2024 period, yet net income declined nearly 40%, reflecting margin pressures. Gross margin and EBIT margin remain favorable but lower than Dominion’s at 40.1% and 21.9%. In 2024, revenue growth slowed to 1.8%, but EBIT, net margin, and EPS showed strong gains, suggesting recent operating leverage despite longer-term profitability challenges.
Which one has the stronger fundamentals?
Dominion Energy presents stronger fundamentals with consistent margin improvement and substantial net income growth over the period, despite slower revenue expansion. PPL shows robust revenue growth but struggles with declining net income and margin contraction overall. Both companies maintain favorable income statements, though Dominion’s metrics indicate superior profitability and efficiency trends.
Financial Ratios Comparison
The table below presents key financial ratios for Dominion Energy, Inc. and PPL Corporation based on their most recent fiscal year data, allowing a straightforward side-by-side comparison.
| Ratios | Dominion Energy, Inc. (D) | PPL Corporation (PPL) |
|---|---|---|
| ROE | 7.79% | 6.31% |
| ROIC | 2.86% | 3.59% |
| P/E | 21.28 | 26.97 |
| P/B | 1.66 | 1.70 |
| Current Ratio | 0.71 | 0.86 |
| Quick Ratio | 0.52 | 0.71 |
| D/E (Debt to Equity) | 1.53 | 1.19 |
| Debt-to-Assets | 40.8% | 40.9% |
| Interest Coverage | 1.72 | 2.36 |
| Asset Turnover | 0.14 | 0.21 |
| Fixed Asset Turnover | 0.21 | 0.26 |
| Payout Ratio | 105.4% | 84.1% |
| Dividend Yield | 4.95% | 3.12% |
Interpretation of the Ratios
Dominion Energy, Inc.
Dominion Energy shows mixed financial strength with a favorable net margin of 14.69% but weaker returns on equity (7.79%) and invested capital (2.86%). Liquidity ratios are concerning, with a current ratio of 0.71 and quick ratio of 0.52, indicating potential short-term solvency risks. The dividend yield is strong at 4.95%, supported by steady payouts, though free cash flow coverage is negative, suggesting caution on sustainability.
PPL Corporation
PPL Corporation’s ratios also reflect mixed performance: a favorable net margin of 10.49% contrasts with below-par returns on equity (6.31%) and capital (3.59%). Liquidity remains a concern, with a current ratio of 0.86 and quick ratio of 0.71. Dividend yield at 3.12% is positive, but higher payout risks exist given negative free cash flow and a relatively high debt-to-equity level of 1.19, implying financial leverage concerns.
Which one has the best ratios?
Dominion Energy and PPL both demonstrate challenges in returns and liquidity, but Dominion’s higher dividend yield and slightly better net margin offer some strength. However, Dominion’s liquidity and asset turnover ratios are weaker. PPL’s valuation metrics appear less attractive, with a higher PE ratio and similar leverage. Overall, both companies have significant unfavorable ratios; Dominion’s profile is slightly less negative.
Strategic Positioning
This section compares the strategic positioning of Dominion Energy, Inc. and PPL Corporation, focusing on Market position, Key segments, and exposure to technological disruption:
Dominion Energy, Inc.
- Leading regulated electric utility with 49.5B market cap, facing moderate competitive pressure.
- Diverse segments: Dominion Energy Virginia, Gas Distribution, South Carolina, Contracted Assets driving revenues.
- Exposure includes renewable energy contracts and gas infrastructure; nonregulated renewable natural gas assets present.
PPL Corporation
- Regulated electric utility with 25.6B market cap, moderate competition in US and UK markets.
- Concentrated in Kentucky and Pennsylvania regulated segments, plus Rhode Island revenues.
- Generates electricity from coal, gas, hydro, solar; operates in regulated markets, limited diversification in renewables.
Dominion Energy, Inc. vs PPL Corporation Positioning
Dominion Energy shows a diversified portfolio across multiple regions and business lines, including renewables and gas infrastructure. PPL focuses more narrowly on regulated electric and gas markets in specific states and the UK, reflecting a more concentrated approach.
Which has the best competitive advantage?
Both companies exhibit slightly unfavorable MOAT evaluations, shedding value but with growing ROIC trends. Dominion Energy’s larger scale and segment diversity contrast with PPL’s focused regulated operations, yet neither currently demonstrates a strong economic moat.
Stock Comparison
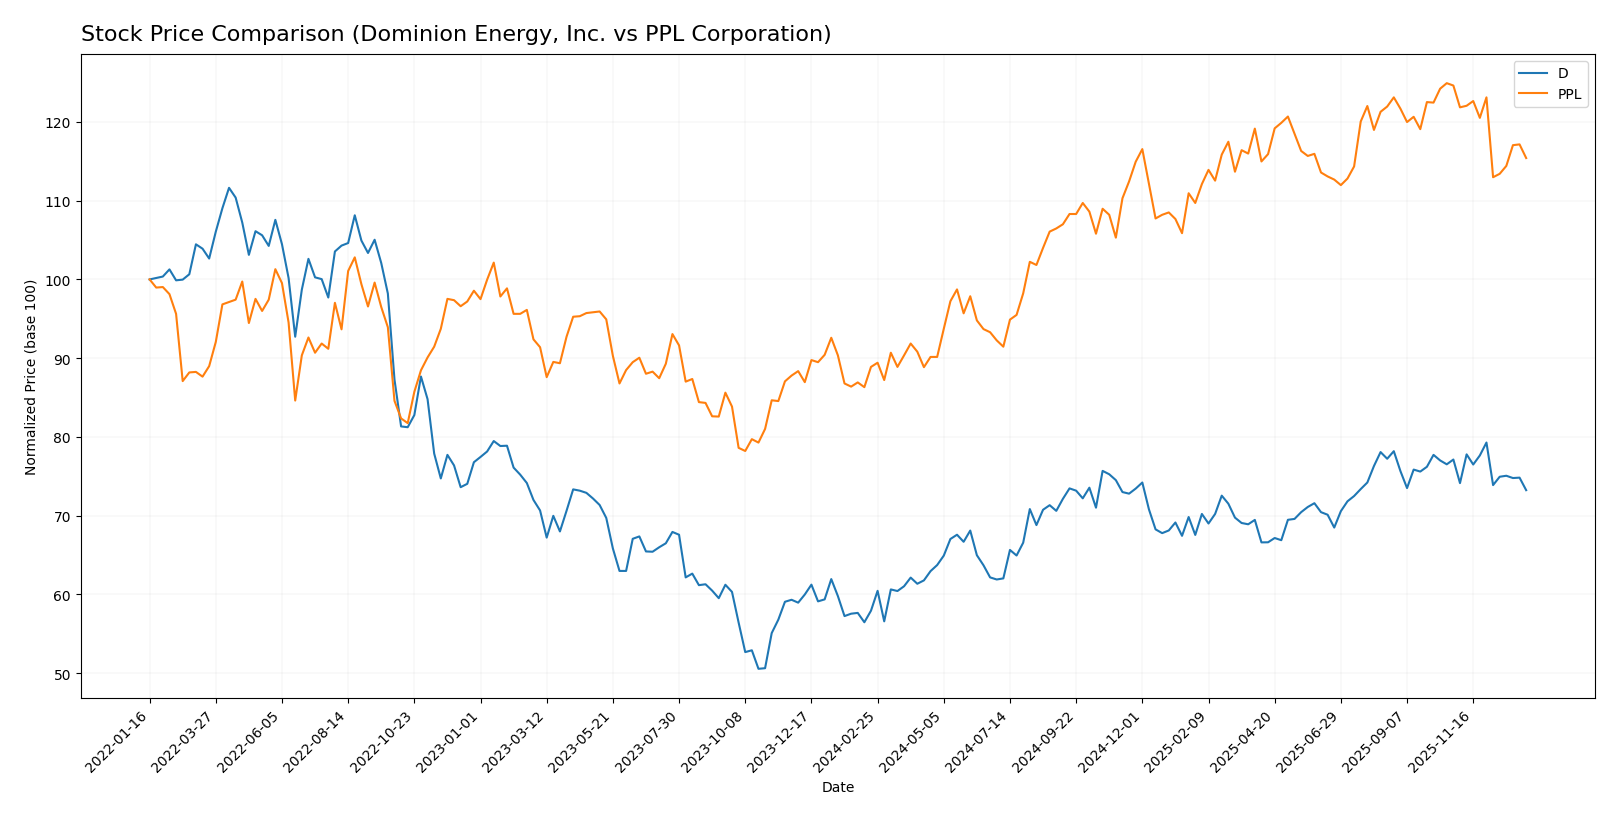
The stock price movements of Dominion Energy, Inc. and PPL Corporation over the past year reveal notable bullish trends with decelerating momentum, marked by significant gains despite recent downward shifts in price direction.
Trend Analysis
Dominion Energy, Inc. experienced a bullish trend over the past 12 months with a 26.43% price increase, though the upward momentum has decelerated. The stock reached a high of 62.77 and a low of 44.79, with volatility reflected by a 4.03 standard deviation.
PPL Corporation also showed a bullish trend with a 29.84% increase over the same period, accompanied by decelerating acceleration. Its price ranged between 26.14 and 37.44, and volatility was slightly lower at a 3.24 standard deviation.
Comparing both, PPL Corporation delivered a higher overall market performance with a 29.84% gain versus Dominion’s 26.43%, despite both stocks showing recent short-term declines.
Target Prices
The analyst consensus indicates moderate upside potential for these utility stocks based on current valuations.
| Company | Target High | Target Low | Consensus |
|---|---|---|---|
| Dominion Energy, Inc. | 70 | 63 | 66 |
| PPL Corporation | 45 | 36 | 41.29 |
Analysts expect Dominion Energy shares to rise from $57.98 to around $66, suggesting a solid upside. PPL Corporation offers a similar opportunity with a consensus target notably above its current $34.59 price.
Analyst Opinions Comparison
This section compares analysts’ ratings and grades for Dominion Energy, Inc. and PPL Corporation:
Rating Comparison
D Rating
- Rating: C+ with a Very Favorable status
- Discounted Cash Flow Score: 4, Favorable
- ROE Score: 3, Moderate
- ROA Score: 1, Very Unfavorable
- Debt To Equity Score: 3, Moderate
- Overall Score: 2, Moderate
PPL Rating
- Rating: C+ with a Very Favorable status
- Discounted Cash Flow Score: 1, Very Unfavorable
- ROE Score: 3, Moderate
- ROA Score: 3, Moderate
- Debt To Equity Score: 2, Moderate
- Overall Score: 2, Moderate
Which one is the best rated?
Both Dominion Energy and PPL have the same overall rating of C+ and a moderate overall score of 2. Dominion Energy scores higher on discounted cash flow, while PPL has better return on assets.
Scores Comparison
Here is a comparison of the Altman Z-Score and Piotroski Score for Dominion Energy, Inc. and PPL Corporation:
Dominion Energy, Inc. Scores
- Altman Z-Score: Unavailable, no data provided.
- Piotroski Score: 7, classified as strong financial health.
PPL Corporation Scores
- Altman Z-Score: 0.97, in distress zone indicating high risk.
- Piotroski Score: 6, classified as average financial health.
Which company has the best scores?
Dominion Energy shows a strong Piotroski Score of 7, indicating better financial health than PPL’s average score of 6. However, PPL has a measurable Altman Z-Score signaling financial distress, while Dominion’s Altman Z-Score is unavailable.
Grades Comparison
Here is a comparison of the latest reliable grades issued by recognized financial institutions for Dominion Energy, Inc. and PPL Corporation:
Dominion Energy, Inc. Grades
The following table summarizes recent grades from key financial analysts covering Dominion Energy, Inc.:
| Grading Company | Action | New Grade | Date |
|---|---|---|---|
| Barclays | Maintain | Overweight | 2025-12-17 |
| JP Morgan | Maintain | Underweight | 2025-12-11 |
| BMO Capital | Maintain | Market Perform | 2025-11-03 |
| Morgan Stanley | Maintain | Equal Weight | 2025-10-22 |
| Barclays | Maintain | Overweight | 2025-10-07 |
| Morgan Stanley | Maintain | Equal Weight | 2025-09-25 |
| JP Morgan | Maintain | Underweight | 2025-08-21 |
| JP Morgan | Maintain | Underweight | 2025-07-15 |
| Morgan Stanley | Maintain | Equal Weight | 2025-06-18 |
| Morgan Stanley | Maintain | Equal Weight | 2025-05-22 |
Dominion Energy’s grades mostly range from Underweight to Overweight, with a consensus rating of Hold, indicating moderate investor caution.
PPL Corporation Grades
The table below lists recent grades from major financial institutions for PPL Corporation:
| Grading Company | Action | New Grade | Date |
|---|---|---|---|
| UBS | Maintain | Neutral | 2025-12-17 |
| Wells Fargo | Maintain | Overweight | 2025-12-12 |
| JP Morgan | Maintain | Overweight | 2025-12-11 |
| BMO Capital | Maintain | Outperform | 2025-10-21 |
| B of A Securities | Maintain | Buy | 2025-10-16 |
| Barclays | Maintain | Equal Weight | 2025-10-14 |
| UBS | Maintain | Neutral | 2025-10-10 |
| Morgan Stanley | Maintain | Overweight | 2025-09-25 |
| Barclays | Maintain | Equal Weight | 2025-07-01 |
| Morgan Stanley | Maintain | Overweight | 2025-06-18 |
PPL Corporation’s grades predominantly range from Neutral to Overweight and Buy, supported by a consensus rating of Buy, reflecting a generally positive outlook from analysts.
Which company has the best grades?
PPL Corporation has received stronger and more favorable grades overall compared to Dominion Energy, Inc., which has a more mixed rating profile. This difference could influence investor sentiment, as PPL’s more positive consensus may suggest higher growth expectations or lower perceived risks.
Strengths and Weaknesses
Below is a comparison table highlighting key strengths and weaknesses of Dominion Energy, Inc. (D) and PPL Corporation (PPL) based on recent financial and operational data.
| Criterion | Dominion Energy, Inc. (D) | PPL Corporation (PPL) |
|---|---|---|
| Diversification | Moderate diversification with energy generation and regulated utilities in Virginia and South Carolina; growing contracted energy segment | More focused on regulated utilities primarily in Kentucky, Pennsylvania, and Rhode Island with some past international exposure |
| Profitability | Net margin favorable at 14.69%, but ROIC (2.86%) below WACC (5.34%) indicates value destruction; dividend yield strong at 4.95% | Net margin favorable at 10.49%, ROIC (3.59%) also below WACC (5.5%) signaling value shedding; dividend yield moderate at 3.12% |
| Innovation | No specific data on innovation; ROIC growth positive (+30.5%) suggests improving operational efficiency | Similar positive ROIC trend (+19%) indicating improving profitability despite current value destruction |
| Global presence | Primarily US-focused, with strong presence in Virginia and South Carolina | Mainly US regional focus, with reduced international exposure compared to prior years |
| Market Share | Large market share in Virginia energy market with revenues over $10B | Strong regional utility market share in Kentucky and Pennsylvania, with revenues around $9B combined |
Key takeaways: Both companies currently face challenges as their ROIC remains below WACC, indicating value destruction despite improving profitability trends. Dominion Energy shows a broader regional presence and higher dividend yield, while PPL is more regionally concentrated with slightly more unfavorable financial ratios. Caution is advised, focusing on their improving operational efficiencies but monitoring profitability versus capital costs closely.
Risk Analysis
The following table summarizes key risks for Dominion Energy, Inc. (D) and PPL Corporation (PPL) based on the latest available data from 2024.
| Metric | Dominion Energy, Inc. (D) | PPL Corporation (PPL) |
|---|---|---|
| Market Risk | Moderate (Beta 0.699) | Moderate (Beta 0.716) |
| Debt Level | High (D/E 1.53, neutral debt/assets 40.77%) | High (D/E 1.19, neutral debt/assets 40.92%) |
| Regulatory Risk | Significant (Utility sector, multi-state operations) | Significant (Utility sector, US & UK operations) |
| Operational Risk | Moderate (Complex asset base, extensive infrastructure) | Moderate (Regional utility with varied assets) |
| Environmental Risk | Elevated (Transition to renewables ongoing, coal/gas reliance) | Elevated (Coal, gas, hydro, solar mix) |
| Geopolitical Risk | Low to moderate (US-focused with limited exposure) | Moderate (US and UK operations subject to different regulations) |
Dominion Energy faces notable operational and environmental risks due to its large asset base and energy transition efforts, while PPL is in financial distress per the Altman Z-score and has moderate geopolitical exposure due to UK operations. Debt levels are elevated for both, increasing financial risk amid regulatory and market pressures.
Which Stock to Choose?
Dominion Energy, Inc. (D) shows a slightly unfavorable financial ratio profile with 50% unfavorable metrics, though it maintains favorable net margin (14.69%) and dividend yield (4.95%). Income growth is strong overall, with a 630% net income increase since 2020, but the company carries significant debt and a moderate rating of C+ (very favorable).
PPL Corporation (PPL) presents an unfavorable ratio evaluation, with 57% unfavorable metrics and a lower net margin of 10.49%. Its income growth is mixed, showing 54.6% revenue growth but a 39.6% decline in net income over 2020-2024. Debt levels are moderate, and it shares the same C+ rating (very favorable) as D.
For investors focused on growth, Dominion’s strong net income growth and robust dividends might appear attractive, while those prioritizing revenue growth or an average financial health profile could find PPL more fitting. Both companies show slightly unfavorable economic moats, indicating value destruction but improving profitability trends.
Disclaimer: Investment carries a risk of loss of initial capital. The past performance is not a reliable indicator of future results. Be sure to understand risks before making an investment decision.
Go Further
I encourage you to read the complete analyses of Dominion Energy, Inc. and PPL Corporation to enhance your investment decisions: