Dominion Energy, Inc. and Exelon Corporation are two major players in the regulated electric utility sector, each with significant market presence and diverse energy portfolios. Both companies operate extensively across the United States, focusing on energy generation, distribution, and innovation in renewable sources. Given their overlapping markets and approaches to sustainable energy, this comparison aims to identify which company offers a more compelling investment opportunity for your portfolio in 2026.
Table of contents
Companies Overview
I will begin the comparison between Dominion Energy, Inc. and Exelon Corporation by providing an overview of these two companies and their main differences.
Dominion Energy Overview
Dominion Energy, Inc. operates in the regulated electric industry, focusing on energy production and distribution across multiple U.S. regions. Its mission centers on delivering reliable electricity and natural gas to millions of residential, commercial, and industrial customers. The company manages a diversified portfolio including electric generation, transmission, natural gas distribution, and renewable energy assets, positioning it as a significant utility provider in Virginia, South Carolina, and other states.
Exelon Corporation Overview
Exelon Corporation is a utility holding company engaged in energy generation, delivery, and marketing in the United States and Canada. It owns a diverse mix of nuclear, fossil, wind, hydroelectric, biomass, and solar power facilities. Exelon also provides electricity and natural gas sales to wholesale and retail customers and supports a broad range of utility services. Headquartered in Chicago, it serves a wide customer base including municipalities, cooperatives, and commercial clients.
Key similarities and differences
Both Dominion Energy and Exelon operate in the regulated electric sector, focusing on energy generation and distribution with commitments to renewable sources. However, Dominion emphasizes regional operations with a strong natural gas distribution segment, while Exelon has a larger workforce and a more diversified energy generation portfolio including nuclear power. Their business models overlap in utility services, but Exelon’s greater geographic reach and varied energy mix differentiate it from Dominion’s more regionally concentrated approach.
Income Statement Comparison
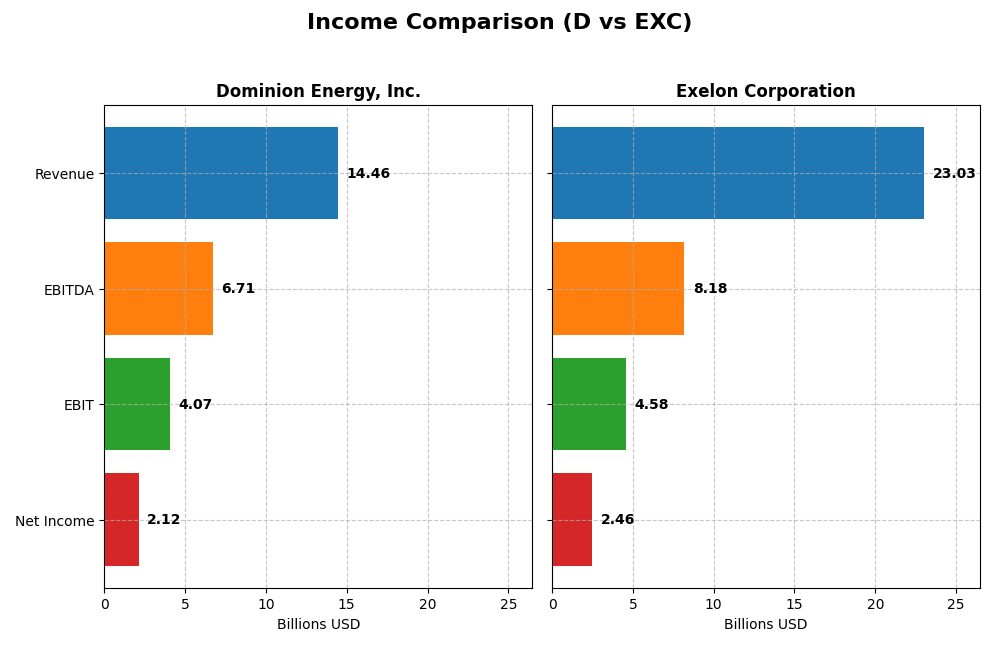
Below is a comparison of key income statement metrics for Dominion Energy, Inc. and Exelon Corporation for the fiscal year 2024.
| Metric | Dominion Energy, Inc. | Exelon Corporation |
|---|---|---|
| Market Cap | 49.5B | 43.8B |
| Revenue | 14.5B | 23.0B |
| EBITDA | 6.7B | 8.2B |
| EBIT | 4.1B | 4.6B |
| Net Income | 2.1B | 2.5B |
| EPS | 2.44 | 2.45 |
| Fiscal Year | 2024 | 2024 |
Income Statement Interpretations
Dominion Energy, Inc.
Dominion Energy’s revenue showed modest growth over 2020-2024, increasing from $14.2B to $14.5B, while net income surged significantly, driven by improved net margins rising to 14.69%. The 2024 fiscal year saw a slight revenue growth slowdown of 0.46%, but EBIT margin rose to a favorable 28.14%, reflecting enhanced profitability despite higher interest expenses.
Exelon Corporation
Exelon’s revenue fluctuated, peaking at $33B in 2020 and settling at $23B in 2024, with net income steadily growing to $2.46B. Margins remained stable with a gross margin near 40.84% and net margin at 10.68%. The latest year showed a 6% revenue increase and a 4.7% EPS growth, although net margin slightly declined by 0.3%, indicating mixed margin performance.
Which one has the stronger fundamentals?
Dominion Energy demonstrates stronger fundamentals with a significant net income growth of 630% and consistent margin improvements over the period, despite some unfavorable interest expenses and slower revenue growth. Exelon shows favorable margin stability and moderate income growth but suffers from larger revenue volatility and less pronounced bottom-line expansion, making its fundamentals comparatively less robust.
Financial Ratios Comparison
This table presents a side-by-side comparison of key financial ratios for Dominion Energy, Inc. (D) and Exelon Corporation (EXC) based on their latest fiscal year 2024 data.
| Ratios | Dominion Energy, Inc. (D) | Exelon Corporation (EXC) |
|---|---|---|
| ROE | 7.79% | 9.14% |
| ROIC | 2.86% | 3.93% |
| P/E | 21.28 | 15.35 |
| P/B | 1.66 | 1.40 |
| Current Ratio | 0.71 | 0.87 |
| Quick Ratio | 0.52 | 0.78 |
| D/E (Debt-to-Equity) | 1.53 | 1.73 |
| Debt-to-Assets | 40.8% | 43.3% |
| Interest Coverage | 1.72 | 2.26 |
| Asset Turnover | 0.14 | 0.21 |
| Fixed Asset Turnover | 0.21 | 0.29 |
| Payout Ratio | 105.4% | 61.9% |
| Dividend Yield | 4.95% | 4.04% |
Interpretation of the Ratios
Dominion Energy, Inc.
Dominion Energy shows a mixed ratio profile with a strong net margin of 14.69% and a favorable dividend yield of 4.95%. However, the company faces concerns due to a low return on equity (7.79%) and return on invested capital (2.86%), coupled with weak liquidity indicated by a current ratio of 0.71. Dividend payments are supported but risk exists from leverage and cash flow constraints.
Exelon Corporation
Exelon presents a solid net margin of 10.68% and a dividend yield of 4.04%, with a favorable price-to-book ratio of 1.4. Yet, its return on equity at 9.14% and return on invested capital of 3.93% are classified as unfavorable, alongside weak current and quick ratios below 1. Dividend payouts appear sustainable but debt levels and asset turnover ratios warrant monitoring.
Which one has the best ratios?
Both Dominion Energy and Exelon exhibit slightly unfavorable overall ratio profiles, each with half their ratios marked unfavorable. Dominion’s stronger net margin and dividend yield contrast with weaker liquidity and returns, while Exelon’s better price-to-book and slightly higher returns face similar liquidity and efficiency challenges, making their ratio quality comparable.
Strategic Positioning
This section compares the strategic positioning of Dominion Energy and Exelon, focusing on market position, key segments, and exposure to technological disruption:
Dominion Energy, Inc.
- Leading regulated electric utility with diversified regional presence; faces moderate competitive pressure.
- Key segments include regulated electricity in Virginia and South Carolina, gas distribution, and contracted renewable energy assets.
- Exposure includes nonregulated renewable natural gas and solar assets; operates regulated and contracted energy infrastructure.
Exelon Corporation
- Major utility services holding company with broad US and Canada presence; competitive in multiple markets.
- Diverse business drivers: nuclear, fossil, wind, hydroelectric, solar generation, and retail energy sales.
- Owns multiple generation types including nuclear and renewables; involved in energy marketing and delivery services.
Dominion Energy, Inc. vs Exelon Corporation Positioning
Dominion Energy focuses on a diversified portfolio across regional regulated electricity and gas, plus renewable contracted assets, offering stable cash flows. Exelon has a more concentrated approach in generation types and energy services, with broader geographic reach including Canada. Dominion’s mix includes substantial gas infrastructure, whereas Exelon emphasizes nuclear and renewables.
Which has the best competitive advantage?
Both companies are currently shedding value as ROIC is below WACC, though with growing profitability trends. Neither shows a strong moat; Exelon’s higher ROIC growth suggests a slightly better competitive advantage despite value destruction.
Stock Comparison
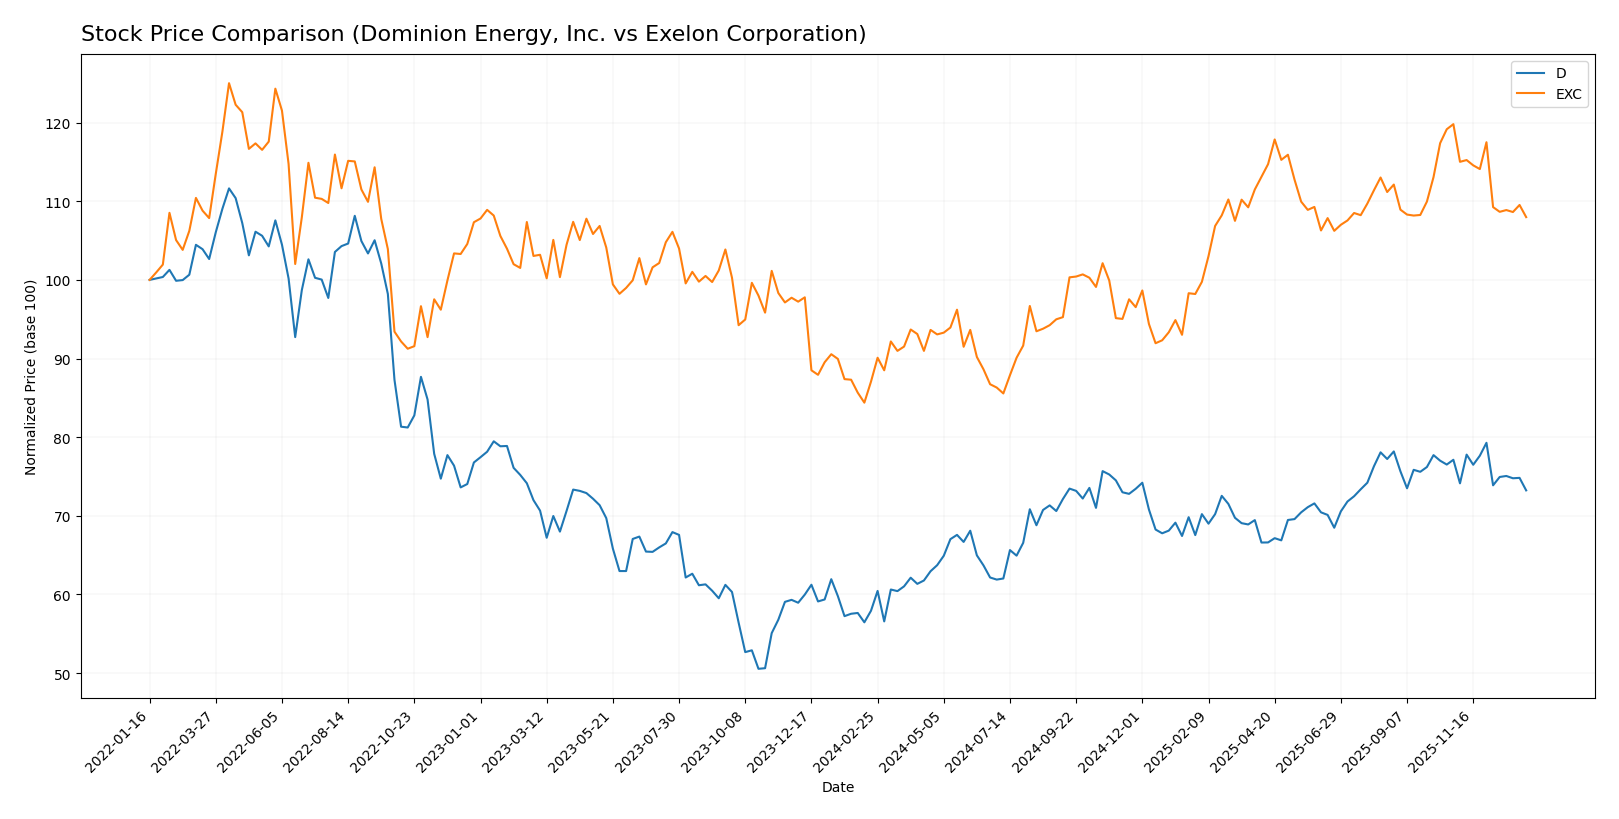
The past year has seen Dominion Energy, Inc. and Exelon Corporation stocks both exhibiting bullish trends with notable price gains, though recent months reveal a reversal in momentum with declining prices.
Trend Analysis
Dominion Energy, Inc. showed a 26.43% price increase over the past 12 months, indicating a bullish trend with decelerating momentum. The stock ranged between 44.79 and 62.77, with a recent slight decline of -5.04%.
Exelon Corporation experienced a 24.03% rise over the same period, also bullish with deceleration. Its price fluctuated from 34.31 to 48.04 but more recently dropped by -9.87%, reflecting a sharper short-term decline.
Comparing both, Dominion Energy outperformed Exelon over the year with a higher overall gain, despite both stocks showing recent downward trends in price.
Target Prices
Here is the consensus of analyst target prices for Dominion Energy, Inc. and Exelon Corporation, reflecting their expected trading ranges.
| Company | Target High | Target Low | Consensus |
|---|---|---|---|
| Dominion Energy, Inc. | 70 | 63 | 66 |
| Exelon Corporation | 57 | 39 | 50.86 |
Analysts expect Dominion Energy to trade moderately above its current price of 57.98 USD, indicating potential upside. Exelon’s consensus target of 50.86 USD also suggests a positive outlook compared to its current price of 43.3 USD.
Analyst Opinions Comparison
This section compares analysts’ ratings and grades for Dominion Energy, Inc. and Exelon Corporation:
Rating Comparison
Dominion Energy, Inc. Rating
- Rating: C+ with a very favorable status
- Discounted Cash Flow Score: 4, favorable assessment
- Return on Equity Score: 3, moderate assessment
- Return on Assets Score: 1, very unfavorable assessment
- Debt To Equity Score: 3, moderate assessment
- Overall Score: 2, moderate assessment
Exelon Corporation Rating
- Rating: B with a very favorable status
- Discounted Cash Flow Score: 3, moderate assessment
- Return on Equity Score: 3, moderate assessment
- Return on Assets Score: 3, moderate assessment
- Debt To Equity Score: 2, moderate assessment
- Overall Score: 3, moderate assessment
Which one is the best rated?
Exelon holds a higher rating (B) compared to Dominion Energy’s C+ and scores better on return on assets and overall score. Dominion Energy leads only in discounted cash flow score. Overall, Exelon is better rated based on the available data.
Scores Comparison
Here is a comparison of the key financial scores for Dominion Energy and Exelon Corporation:
Dominion Energy Scores
- Altman Z-Score: Unavailable, no data provided.
- Piotroski Score: 7, classified as strong financial health.
Exelon Scores
- Altman Z-Score: 0.78, in distress zone indicating high bankruptcy risk.
- Piotroski Score: 5, considered average financial strength.
Which company has the best scores?
Dominion Energy has a strong Piotroski Score of 7, while Exelon has an average Piotroski Score of 5 and a distress-zone Altman Z-Score. Based on these scores, Dominion Energy shows stronger financial health.
Grades Comparison
The following presents a comparison of recent grades issued by reputable grading companies for Dominion Energy, Inc. and Exelon Corporation:
Dominion Energy, Inc. Grades
This table summarizes recent analyst grades and actions for Dominion Energy, Inc.:
| Grading Company | Action | New Grade | Date |
|---|---|---|---|
| Barclays | Maintain | Overweight | 2025-12-17 |
| JP Morgan | Maintain | Underweight | 2025-12-11 |
| BMO Capital | Maintain | Market Perform | 2025-11-03 |
| Morgan Stanley | Maintain | Equal Weight | 2025-10-22 |
| Barclays | Maintain | Overweight | 2025-10-07 |
| Morgan Stanley | Maintain | Equal Weight | 2025-09-25 |
| JP Morgan | Maintain | Underweight | 2025-08-21 |
| JP Morgan | Maintain | Underweight | 2025-07-15 |
| Morgan Stanley | Maintain | Equal Weight | 2025-06-18 |
| Morgan Stanley | Maintain | Equal Weight | 2025-05-22 |
Dominion Energy’s grades show a consistent pattern of mixed recommendations, with multiple “Equal Weight” and “Underweight” ratings alongside some “Overweight” views, indicating moderate analyst caution.
Exelon Corporation Grades
This table summarizes recent analyst grades and actions for Exelon Corporation:
| Grading Company | Action | New Grade | Date |
|---|---|---|---|
| UBS | Maintain | Neutral | 2025-12-17 |
| JP Morgan | Maintain | Neutral | 2025-12-12 |
| Morgan Stanley | Maintain | Equal Weight | 2025-10-22 |
| Keybanc | Maintain | Underweight | 2025-10-15 |
| Jefferies | Maintain | Buy | 2025-10-15 |
| Barclays | Maintain | Overweight | 2025-10-14 |
| UBS | Maintain | Neutral | 2025-10-10 |
| Morgan Stanley | Maintain | Equal Weight | 2025-09-25 |
| Keybanc | Maintain | Underweight | 2025-07-16 |
| UBS | Maintain | Neutral | 2025-07-11 |
Exelon Corporation’s grades reflect a broader distribution, including “Buy” and “Overweight” ratings as well as “Neutral” and “Underweight” positions, suggesting a more varied analyst outlook.
Which company has the best grades?
Exelon Corporation generally receives slightly more favorable grades, including a “Buy” and “Overweight” from Jefferies and Barclays respectively, compared to Dominion Energy’s more cautious “Equal Weight” and “Underweight” ratings. For investors, this variance may influence perceived growth potential and risk profile.
Strengths and Weaknesses
Below is a comparative overview of key strengths and weaknesses for Dominion Energy, Inc. (D) and Exelon Corporation (EXC) based on the most recent data available.
| Criterion | Dominion Energy, Inc. (D) | Exelon Corporation (EXC) |
|---|---|---|
| Diversification | Moderate diversification with focus on energy generation and regional utilities across Virginia and South Carolina; some exposure to contracted energy. | Broad diversification across multiple regulated utilities and energy services in several states, with a more balanced segment distribution. |
| Profitability | Net margin favorable at 14.69%; however, ROIC (2.86%) below WACC (5.34%), indicating value destruction despite improving ROIC trend. | Net margin favorable at 10.68%; ROIC (3.93%) also below WACC (5.00%), shedding value but with a strong positive ROIC trend. |
| Innovation | Limited innovation emphasis; focus remains on traditional energy infrastructure and regulated services. | Moderate innovation with investments in diverse energy solutions and infrastructure upgrades. |
| Global presence | Primarily regional U.S. focus in Virginia and South Carolina markets. | U.S.-based with multiple service territories; no significant international presence. |
| Market Share | Strong presence in Virginia energy market; moderate share in South Carolina. | Leading market positions in several regional utilities, including Commonwealth Edison and Pepco Holdings. |
In summary, both Dominion Energy and Exelon show slightly unfavorable economic moats as they currently destroy value with ROIC below WACC, but both have improving profitability trends. Exelon benefits from broader diversification and stronger market positions, while Dominion holds a solid regional footprint with favorable net margins but faces challenges in capital efficiency. Investors should weigh these factors carefully, considering the improving ROIC trends as potential for future value creation.
Risk Analysis
Below is a comparative table of key risks affecting Dominion Energy, Inc. (D) and Exelon Corporation (EXC) based on the latest available data for 2024-2026:
| Metric | Dominion Energy, Inc. (D) | Exelon Corporation (EXC) |
|---|---|---|
| Market Risk | Moderate beta at 0.70, less volatile | Lower beta at 0.56, relatively stable |
| Debt level | Debt-to-Equity 1.53 (unfavorable), Debt-to-Assets 40.8% (neutral) | Debt-to-Equity 1.73 (unfavorable), Debt-to-Assets 43.3% (neutral) |
| Regulatory Risk | High, given regulated electric and gas operations subject to state policies | High, extensive nuclear and fossil assets under strict regulation |
| Operational Risk | Moderate, with diversified segments but lower asset turnover (0.14) | Moderate, with broader generation mix but similarly low asset turnover (0.21) |
| Environmental Risk | Elevated due to gas distribution and fossil-based assets | Elevated, nuclear and fossil fuel generation pose environmental scrutiny |
| Geopolitical Risk | Low to moderate, primarily US-focused operations | Low to moderate, US and Canada operations with exposure to cross-border policies |
In synthesis, both companies face significant regulatory and environmental risks due to their utility sectors and energy generation mix. Dominion Energy’s moderate market risk and somewhat better diversification contrast with Exelon’s higher debt and nuclear exposure, which may pose greater operational and regulatory challenges. The most impactful risk remains regulatory changes affecting fossil and nuclear energy, potentially influencing future profitability and investment returns.
Which Stock to Choose?
Dominion Energy, Inc. shows a slightly unfavorable global financial ratios profile with 50% unfavorable metrics including low asset turnover and leverage concerns, despite favorable net margin and dividend yield. Its income statement is favorable, with strong net income growth and improved profitability, though the company carries a high debt load and moderate credit rating of C+.
Exelon Corporation also presents a slightly unfavorable ratios evaluation, with half the ratios unfavorable, but it has a stronger position in price-to-book and dividend yield. Its income statement is similarly favorable with steady profitability and revenue growth, coupled with a moderate debt profile and a better credit rating of B.
Investors seeking growth with improving profitability might find both companies showing value destruction but rising returns, yet those prioritizing financial stability and valuation metrics could lean towards Exelon, while risk-tolerant profiles focused on income growth may see potential in Dominion Energy.
Disclaimer: Investment carries a risk of loss of initial capital. The past performance is not a reliable indicator of future results. Be sure to understand risks before making an investment decision.
Go Further
I encourage you to read the complete analyses of Dominion Energy, Inc. and Exelon Corporation to enhance your investment decisions: