Dominion Energy, Inc. and Eversource Energy are two major players in the regulated electric utility sector, serving millions of customers across multiple states. Both companies focus on energy distribution and are advancing renewable energy initiatives to meet evolving market demands. Given their industry overlap and innovation strategies, comparing these utilities can reveal which stands out as a more compelling investment opportunity. Let’s explore which company deserves a place in your portfolio.

Table of contents
Companies Overview
I will begin the comparison between Dominion Energy and Eversource Energy by providing an overview of these two companies and their main differences.
Dominion Energy Overview
Dominion Energy, Inc. is a major player in the regulated electric sector, producing and distributing energy across multiple U.S. states. It operates through segments including electricity generation and distribution, natural gas distribution, and contracted renewable assets. With a substantial portfolio of 30.2GW electric capacity and extensive transmission and distribution networks, Dominion serves millions of residential, commercial, and industrial customers primarily in Virginia, the Carolinas, and other states.
Eversource Energy Overview
Eversource Energy is a public utility holding company focused on energy delivery across the northeastern U.S. It operates in electric distribution and transmission, natural gas distribution, and water utilities, serving customers in Connecticut, Massachusetts, and New Hampshire. Eversource supports a diverse customer base including residential, commercial, and municipal sectors, and maintains solar power facilities alongside its regulated utility operations.
Key similarities and differences
Both Dominion and Eversource are regulated utility companies with a focus on electricity and natural gas distribution, serving residential and commercial customers. Dominion has a larger asset base and geographic reach, including significant renewable energy and contracted assets, while Eversource integrates water services and operates primarily in the Northeast. Their business models emphasize regulated energy delivery but differ in scale and regional focus.
Income Statement Comparison
This table compares key income statement metrics for Dominion Energy, Inc. and Eversource Energy for the fiscal year 2024, providing a snapshot of their recent financial performance.

| Metric | Dominion Energy, Inc. | Eversource Energy |
|---|---|---|
| Market Cap | 49.5B | 25.0B |
| Revenue | 14.5B | 11.9B |
| EBITDA | 6.7B | 4.1B |
| EBIT | 4.1B | 2.4B |
| Net Income | 2.1B | 812M |
| EPS | 2.44 | 2.27 |
| Fiscal Year | 2024 | 2024 |
Income Statement Interpretations
Dominion Energy, Inc.
Dominion Energy shows a generally stable revenue trend from 2020 to 2024, with a slight 0.46% increase in the last year. Net income grew significantly over the period, driven by a 629.68% rise overall. Gross and net margins remain favorable, with a gross margin near 48% and a net margin improving by 6.03% in 2024. The recent year saw EBIT and EPS growth, indicating improved profitability despite flat revenue growth.
Eversource Energy
Eversource Energy’s revenue grew by 33.65% over the five-year span but slightly declined by 0.08% in 2024. Net income declined overall by 32.65%, despite a strong rebound in EBIT and net margin growth last year, which improved by 305.78% and 283.68%, respectively. Gross and EBIT margins are favorable around 31% and 20%, with interest expenses neutral. The latest year shows a recovery in profitability after prior declines.
Which one has the stronger fundamentals?
Dominion Energy benefits from consistent revenue and substantial net income growth, supported by high and improving margins, though its interest expense ratio is less favorable. Eversource shows stronger revenue growth but struggles with net income decline over the period, despite recent margin improvements. Overall, Dominion’s income statement reflects steadier earnings growth and margin stability, suggesting comparatively stronger fundamentals.
Financial Ratios Comparison
The table below compares key financial ratios for Dominion Energy, Inc. and Eversource Energy based on their most recent fiscal year data from 2024.
| Ratios | Dominion Energy, Inc. (D) | Eversource Energy (ES) |
|---|---|---|
| ROE | 7.79% | 5.40% |
| ROIC | 2.86% | 3.18% |
| P/E | 21.28 | 25.29 |
| P/B | 1.66 | 1.37 |
| Current Ratio | 0.71 | 0.76 |
| Quick Ratio | 0.52 | 0.67 |
| D/E | 1.53 | 1.94 |
| Debt-to-Assets | 40.77% | 48.85% |
| Interest Coverage | 1.72 | 2.43 |
| Asset Turnover | 0.14 | 0.20 |
| Fixed Asset Turnover | 0.21 | 0.29 |
| Payout Ratio | 105.4% | 124.3% |
| Dividend Yield | 4.95% | 4.91% |
Interpretation of the Ratios
Dominion Energy, Inc.
Dominion Energy shows mixed financial health with a strong net margin of 14.69% and a favorable dividend yield of 4.95%, indicating reliable shareholder returns. However, the company faces concerns with an unfavorable return on equity of 7.79%, low current and quick ratios, and a high debt-to-equity ratio of 1.53, suggesting liquidity and leverage risks. Dividend payments appear sustainable but warrant monitoring.
Eversource Energy
Eversource Energy presents a neutral net margin at 6.82% and a favorable dividend yield near 4.91%, reflecting consistent shareholder returns. Challenges include an unfavorable return on equity of 5.4%, a high debt-to-equity ratio of 1.94, and weak liquidity ratios, which may constrain financial flexibility. The payout seems balanced, but operational efficiency requires attention.
Which one has the best ratios?
Both Dominion Energy and Eversource Energy exhibit significant unfavorable ratios, particularly in returns and liquidity. Dominion Energy’s stronger net margin and slightly better leverage profile contrast with Eversource’s higher debt and weaker profitability. Overall, Dominion’s ratios are slightly less unfavorable, though both companies face financial challenges that investors should consider.
Strategic Positioning
This section compares the strategic positioning of Dominion Energy, Inc. (D) and Eversource Energy (ES) across Market position, Key segments, and Exposure to technological disruption:
Dominion Energy, Inc.
- Large market cap of $49.5B with diversified regulated electric and gas operations, facing steady competition
- Key segments: Dominion Energy Virginia ($10.2B), South Carolina ($3.3B), Gas Distribution, Contracted Energy
- Exposed to renewable energy via contracted assets and solar; operates long transmission and distribution lines
Eversource Energy
- Smaller market cap of $25B, focused on regulated electric, gas, and water distribution in Northeast US
- Key segments: Electric Distribution ($9.1B), Electric Transmission, Natural Gas Distribution, Water Segment
- Involved in solar power facilities; primarily regulated utility with incremental exposure to renewables
Dominion Energy, Inc. vs Eversource Energy Positioning
Dominion Energy takes a more diversified approach with multiple geographic and energy segments, including nonregulated renewable assets. Eversource concentrates on Northeast US regulated utilities, adding water services. Dominion’s broader scale contrasts with Eversource’s regional focus.
Which has the best competitive advantage?
Both companies are shedding value relative to their cost of capital. Dominion shows a growing ROIC trend, indicating improving profitability, while Eversource’s declining ROIC suggests weakening competitive efficiency. Dominion’s moat evaluation is slightly unfavorable; Eversource’s is very unfavorable.
Stock Comparison
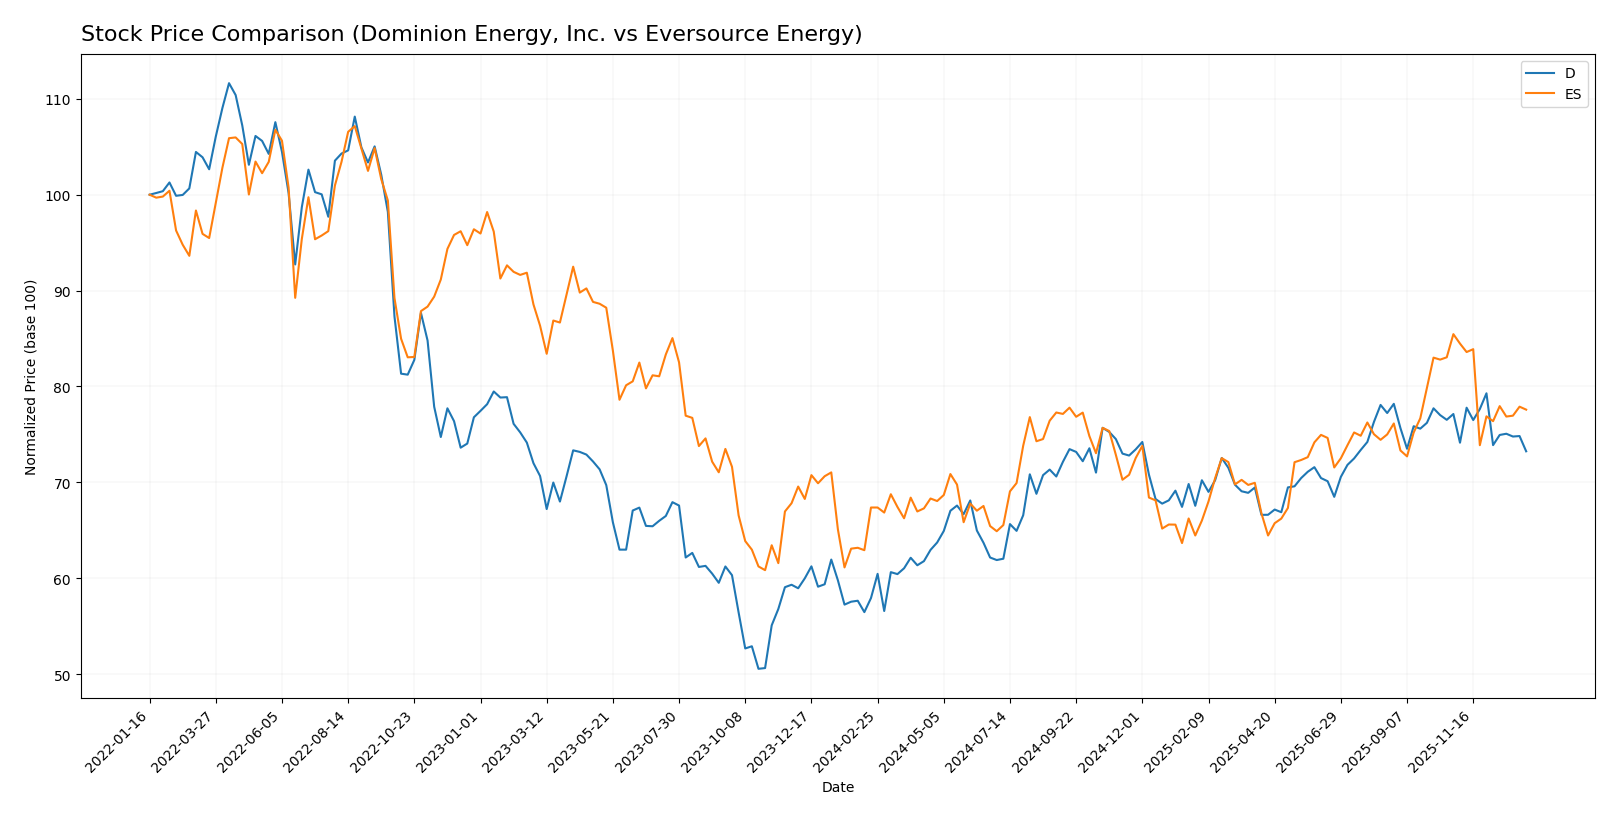
The stock price movements of Dominion Energy, Inc. and Eversource Energy over the past 12 months reveal distinct bullish trends with decelerating momentum and contrasting volume dynamics.
Trend Analysis
Dominion Energy, Inc. displayed a strong bullish trend with a 26.43% price increase over the past year, reaching a high of 62.77. However, recent months show a slight bearish correction with a -5.04% decline and reduced volatility. Eversource Energy also showed a bullish trend with a 15.15% gain over the past year, peaking at 74.67, but its recent trend is bearish with a -9.21% drop and higher recent volatility compared to Dominion Energy. Dominion Energy outperformed Eversource Energy in overall market performance, showing a larger price increase and more sustained buyer dominance throughout the year.
Target Prices
Analysts provide a clear consensus on target prices for Dominion Energy, Inc. and Eversource Energy, indicating potential upside from current levels.
| Company | Target High | Target Low | Consensus |
|---|---|---|---|
| Dominion Energy, Inc. | 70 | 63 | 66 |
| Eversource Energy | 81 | 60 | 68 |
The consensus targets suggest moderate appreciation potential for both stocks, with Dominion Energy’s target consensus at 66 compared to its current price of 57.98, and Eversource Energy’s consensus at 68 versus its current price of 67.79. This reflects generally positive analyst expectations within the regulated electric utilities sector.
Analyst Opinions Comparison
This section compares analysts’ ratings and grades for Dominion Energy, Inc. (D) and Eversource Energy (ES):
Rating Comparison
D Rating
- Rating: C+, rated Very Favorable overall by analysts.
- Discounted Cash Flow Score: 4, considered Favorable for valuation.
- ROE Score: 3, indicating Moderate efficiency in generating equity returns.
- ROA Score: 1, seen as Very Unfavorable, indicating weak asset utilization.
- Debt To Equity Score: 3, Moderate level of financial risk.
- Overall Score: 2, Moderate overall financial standing.
ES Rating
- Rating: C+, also rated Very Favorable overall by analysts.
- Discounted Cash Flow Score: 1, considered Very Unfavorable for valuation.
- ROE Score: 3, showing Moderate efficiency in generating equity returns.
- ROA Score: 3, Moderate, reflecting better asset utilization compared to D.
- Debt To Equity Score: 1, Very Unfavorable, indicating higher financial risk.
- Overall Score: 2, also Moderate overall financial standing.
Which one is the best rated?
Both D and ES share the same overall rating of C+ and a Moderate overall score of 2. However, D scores better on discounted cash flow and debt-to-equity metrics, while ES shows stronger return on assets. Neither company clearly outperforms the other across all metrics.
Scores Comparison
Here is a comparison of Dominion Energy and Eversource Energy scores:
Dominion Energy Scores
- Altman Z-Score: Unavailable, no data to assess risk.
- Piotroski Score: 7, indicating strong financial health.
Eversource Energy Scores
- Altman Z-Score: 0.75, in distress zone, high risk.
- Piotroski Score: 6, indicating average financial health.
Which company has the best scores?
Dominion Energy has a stronger Piotroski Score of 7 versus Eversource’s 6, suggesting better financial strength. However, Eversource’s Altman Z-Score shows financial distress, while Dominion’s Altman score is unavailable.
Grades Comparison
Here is a comparison of the recent grades assigned to Dominion Energy, Inc. and Eversource Energy by reputable grading firms:
Dominion Energy, Inc. Grades
The following table summarizes the recent grades from major financial institutions for Dominion Energy, Inc.:
| Grading Company | Action | New Grade | Date |
|---|---|---|---|
| Barclays | Maintain | Overweight | 2025-12-17 |
| JP Morgan | Maintain | Underweight | 2025-12-11 |
| BMO Capital | Maintain | Market Perform | 2025-11-03 |
| Morgan Stanley | Maintain | Equal Weight | 2025-10-22 |
| Barclays | Maintain | Overweight | 2025-10-07 |
| Morgan Stanley | Maintain | Equal Weight | 2025-09-25 |
| JP Morgan | Maintain | Underweight | 2025-08-21 |
| JP Morgan | Maintain | Underweight | 2025-07-15 |
| Morgan Stanley | Maintain | Equal Weight | 2025-06-18 |
| Morgan Stanley | Maintain | Equal Weight | 2025-05-22 |
Dominion Energy’s grades show a consistent pattern of cautious optimism, with multiple “Overweight” and “Equal Weight” ratings, but also some “Underweight” assessments.
Eversource Energy Grades
The following table summarizes recent grades from recognized financial institutions for Eversource Energy:
| Grading Company | Action | New Grade | Date |
|---|---|---|---|
| UBS | Maintain | Neutral | 2025-12-17 |
| JP Morgan | Maintain | Underweight | 2025-12-12 |
| Janney Montgomery Scott | Upgrade | Buy | 2025-11-24 |
| Scotiabank | Maintain | Sector Underperform | 2025-11-20 |
| Mizuho | Downgrade | Neutral | 2025-11-20 |
| Wells Fargo | Downgrade | Equal Weight | 2025-11-20 |
| UBS | Downgrade | Neutral | 2025-11-06 |
| BMO Capital | Maintain | Market Perform | 2025-11-06 |
| Scotiabank | Maintain | Sector Underperform | 2025-11-06 |
| Mizuho | Maintain | Outperform | 2025-10-27 |
Eversource Energy’s ratings are mixed, featuring both downgrades and upgrades, with a notable shift toward more neutral and cautious stances.
Which company has the best grades?
Both Dominion Energy and Eversource Energy have a consensus rating of “Hold,” with Dominion showing a more stable pattern of “Overweight” and “Equal Weight” grades, while Eversource displays a wider range of opinions including downgrades and upgrades. Investors may interpret Dominion’s steadier grades as signaling moderate confidence, whereas Eversource’s varied assessments indicate greater uncertainty or evolving views among analysts.
Strengths and Weaknesses
Here is a comparison of key strengths and weaknesses for Dominion Energy, Inc. (D) and Eversource Energy (ES) based on the most recent data available.
| Criterion | Dominion Energy, Inc. (D) | Eversource Energy (ES) |
|---|---|---|
| Diversification | Moderate: Revenue mainly from Virginia (10.2B) and South Carolina (3.3B), plus Contracted Energy (1.1B) | Moderate: Strong electric distribution (9.1B) and transmission (2.1B), plus natural gas (2.1B) and water (0.23B) |
| Profitability | Mixed: Net margin 14.7% (favorable), but ROIC 2.9% below WACC 5.3% (unfavorable) | Mixed: Net margin 6.8% (neutral), ROIC 3.2% below WACC 5.0% (unfavorable) |
| Innovation | Limited data; ROIC trending up (+30.5%) suggests improving capital efficiency | Declining ROIC (-10.4%) indicates challenges in improving returns |
| Global presence | Regional U.S. utility focus, no significant global operations | Regional U.S. utility focus, no significant global operations |
| Market Share | Strong in Virginia energy market | Strong in New England electric and gas markets |
Dominion Energy shows improving profitability trends despite currently shedding value, while Eversource faces declining returns with less margin cushion. Both have regional focus and moderate diversification. Investors should weigh Dominion’s growth potential against Eversource’s current profitability challenges.
Risk Analysis
Below is a summary table comparing key risk factors for Dominion Energy, Inc. (D) and Eversource Energy (ES) based on the latest 2024 data and market environment:
| Metric | Dominion Energy, Inc. (D) | Eversource Energy (ES) |
|---|---|---|
| Market Risk | Beta 0.70 – Moderate volatility; stable regulated utility sector | Beta 0.77 – Moderate volatility; regional utility exposure |
| Debt level | Debt/Equity 1.53 – Elevated leverage; interest coverage 2.16x (neutral) | Debt/Equity 1.94 – Higher leverage; interest coverage 2.12x (neutral) |
| Regulatory Risk | High – Extensive operations in multiple states with stringent regulation | High – Operates in Northeast states with active regulatory environment |
| Operational Risk | Moderate – Large transmission and distribution network; aging infrastructure risks | Moderate – Diverse utility operations including water; infrastructure investment required |
| Environmental Risk | Moderate – Transition to renewables ongoing; regulatory pressure on emissions | Moderate – Investment in solar and clean energy; exposure to climate policies |
| Geopolitical Risk | Low – US-focused operations with limited international exposure | Low – US regional focus with minimal geopolitical risk |
In synthesis, both companies face the most impactful risks from regulatory environments and elevated debt levels, which may constrain financial flexibility. Dominion Energy’s slightly lower leverage and broader operational footprint provide some cushion. Eversource’s higher debt and concentrated Northeast exposure increase vulnerability, especially amid evolving environmental regulations. Investors should weigh these factors carefully alongside dividend yields and sector stability.
Which Stock to Choose?
Dominion Energy, Inc. (D) shows a generally favorable income statement with a 14.69% net margin and growing profitability over the 2020–2024 period, despite slight revenue stagnation. Its financial ratios are slightly unfavorable overall, with a 7.79% ROE and high debt levels, though dividend yield and WACC remain favorable. The company is rated C+ with a very favorable overall rating but exhibits a slightly unfavorable moat due to value destruction despite improving ROIC.
Eversource Energy (ES) maintains a favorable income statement with a 6.82% net margin and positive revenue growth overall but declining net income and profitability. Its financial ratios lean unfavorable, with a 5.4% ROE, higher debt ratios, and mixed valuation metrics. The rating is also C+ and very favorable overall, but the moat is very unfavorable, reflecting value destruction with decreasing profitability and financial distress indicated by a low Altman Z-Score.
Which stock is the most favorable for an investor might depend on risk tolerance and investment strategy. Investors focused on improving profitability and moderate income growth might find Dominion Energy more appealing given its favorable income trends and improving ROIC. Conversely, those prioritizing stable dividend yields and potentially undervalued assets may consider Eversource Energy, despite its more challenging profitability and financial health indicators.
Disclaimer: Investment carries a risk of loss of initial capital. The past performance is not a reliable indicator of future results. Be sure to understand risks before making an investment decision.
Go Further
I encourage you to read the complete analyses of Dominion Energy, Inc. and Eversource Energy to enhance your investment decisions: