Dominion Energy, Inc. and Evergy, Inc. are two prominent players in the regulated electric utility sector, serving millions of customers across the United States. Both companies focus on energy generation, transmission, and distribution, while embracing renewable innovations to shape the future of power. This comparison highlights their market presence, operational scale, and strategic approaches. Join me as we explore which company presents the most compelling opportunity for investors today.
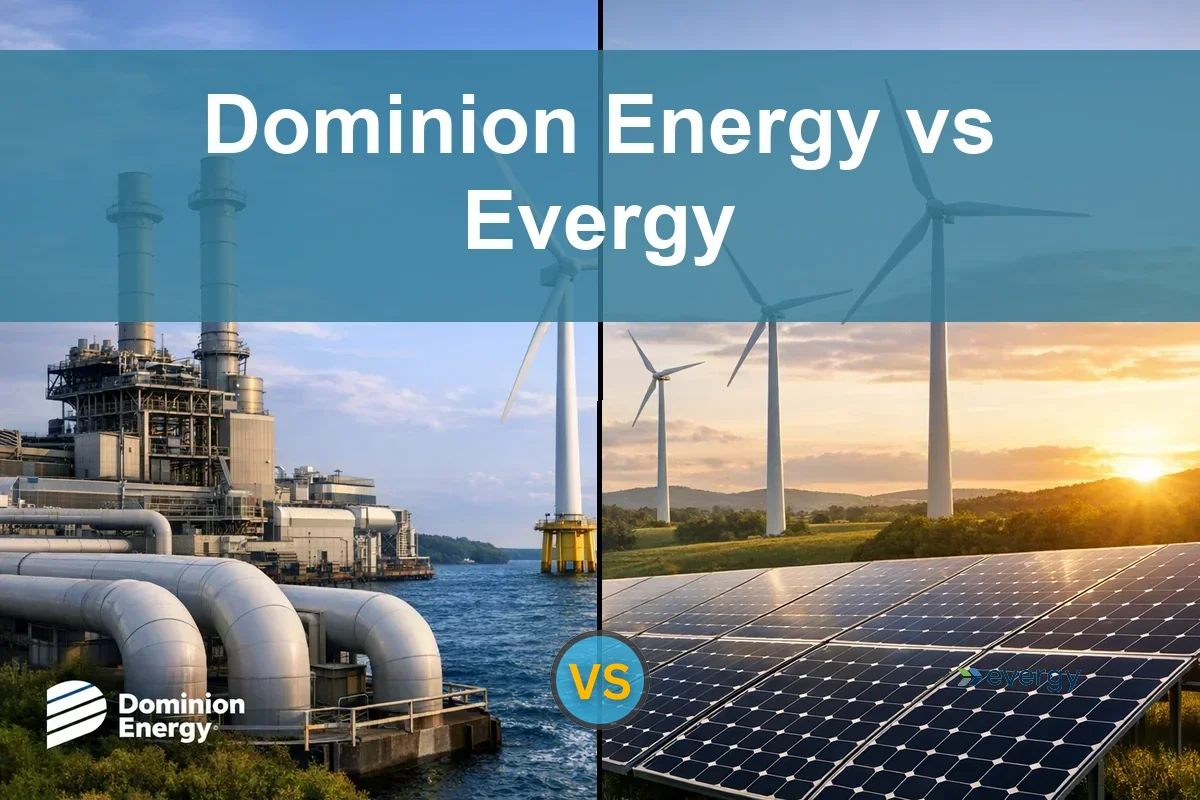
Table of contents
Companies Overview
I will begin the comparison between Dominion Energy and Evergy by providing an overview of these two companies and their main differences.
Dominion Energy Overview
Dominion Energy, Inc. operates in the U.S. regulated electric industry, providing energy through segments like Dominion Energy Virginia, Gas Distribution, and South Carolina operations. It serves millions of customers with electricity and natural gas, supported by a vast infrastructure including 30.2GW of electric capacity and extensive transmission and distribution lines. Headquartered in Richmond, Virginia, Dominion emphasizes both regulated and nonregulated renewable energy assets.
Evergy Overview
Evergy, Inc., headquartered in Kansas City, Missouri, is engaged in electricity generation, transmission, and distribution in Kansas and Missouri. It uses diverse energy sources including coal, hydro, natural gas, and renewables like solar and wind. Serving approximately 1.6M customers, Evergy manages transmission and distribution networks totaling over 62,000 circuit miles and focuses on a balanced energy mix within the regulated electric sector.
Key similarities and differences
Both companies operate in the regulated electric utilities sector in the U.S., focusing on electricity generation, transmission, and distribution. Dominion has a larger scale, with more extensive infrastructure and customer base, and includes significant natural gas operations. Evergy serves fewer customers with a broad energy mix including fossil fuels and renewables, and has a smaller workforce. Both emphasize regulated services but differ in geographic focus and asset scale.
Income Statement Comparison
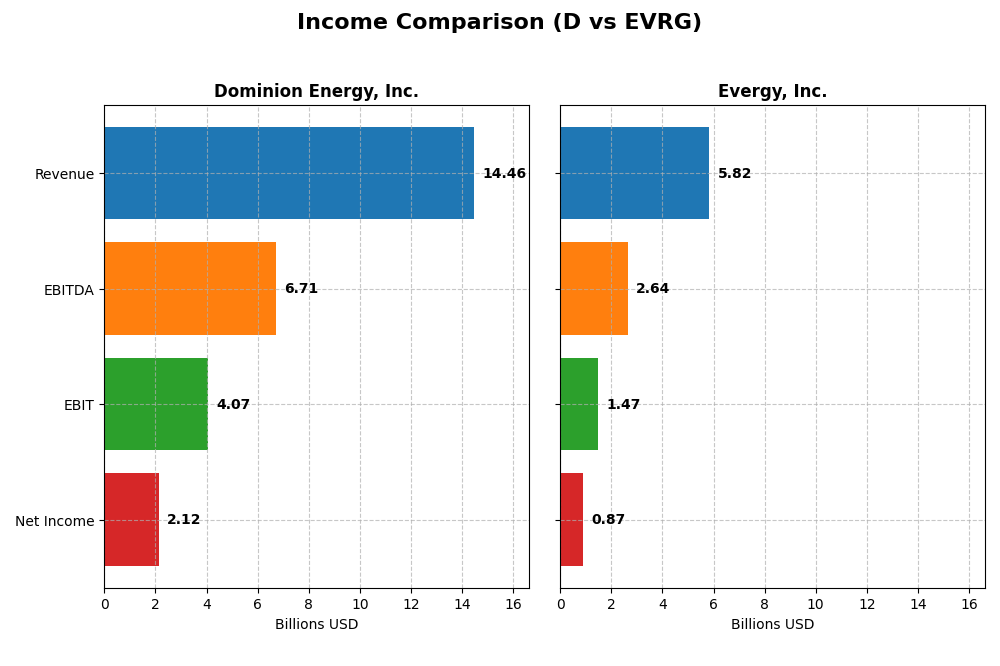
Below is a side-by-side comparison of key income statement metrics for Dominion Energy, Inc. and Evergy, Inc. for the fiscal year 2024.
| Metric | Dominion Energy, Inc. | Evergy, Inc. |
|---|---|---|
| Market Cap | 49.5B | 16.8B |
| Revenue | 14.5B | 5.82B |
| EBITDA | 6.71B | 2.64B |
| EBIT | 4.07B | 1.47B |
| Net Income | 2.12B | 873.5M |
| EPS | 2.44 | 3.79 |
| Fiscal Year | 2024 | 2024 |
Income Statement Interpretations
Dominion Energy, Inc.
Dominion Energy’s revenue showed modest growth from 2020 to 2024, reaching $14.46B in 2024, while net income surged notably to about $2.12B. Gross and EBIT margins remained strong and favorable, around 47.9% and 28.1%, respectively. However, interest expenses are relatively high at 13%, slightly dampening overall profitability. The latest year saw slowed revenue growth but improved net margin and EPS.
Evergy, Inc.
Evergy reported steady revenue growth over the five-year span, reaching $5.82B in 2024 with a net income of $873.5M. Margins are stable, with gross margin around 32.6% and EBIT margin near 25.3%, both favorable. Interest expense is moderate and neutral at 9.7%. The most recent year showed solid revenue and gross profit growth, alongside favorable increases in net margin and EPS, indicating improving profitability.
Which one has the stronger fundamentals?
Both companies demonstrate favorable income statement fundamentals with growing net income and positive margin trends. Dominion Energy benefits from higher gross and EBIT margins but faces higher interest costs, while Evergy shows steadier revenue growth and better control over interest expenses. Evergy’s broader favorable growth metrics and lower financial burden suggest more balanced fundamentals, though both maintain a positive outlook.
Financial Ratios Comparison
The table below compares key financial ratios for Dominion Energy, Inc. and Evergy, Inc. based on their most recent fiscal year data from 2024.
| Ratios | Dominion Energy, Inc. (D) | Evergy, Inc. (EVRG) |
|---|---|---|
| ROE | 7.79% | 8.77% |
| ROIC | 2.86% | 4.52% |
| P/E | 21.28 | 16.23 |
| P/B | 1.66 | 1.42 |
| Current Ratio | 0.71 | 0.50 |
| Quick Ratio | 0.52 | 0.27 |
| D/E | 1.53 | 1.41 |
| Debt-to-Assets | 40.77% | 43.58% |
| Interest Coverage | 1.72 | 2.57 |
| Asset Turnover | 0.14 | 0.18 |
| Fixed Asset Turnover | 0.21 | 0.23 |
| Payout Ratio | 105.4% | 68.3% |
| Dividend Yield | 4.95% | 4.21% |
Interpretation of the Ratios
Dominion Energy, Inc.
Dominion Energy shows a mixed ratio profile with a favorable net margin of 14.69% and a dividend yield of 4.95%, indicating solid profitability and shareholder return. However, weak returns on equity (7.79%) and invested capital (2.86%), coupled with a low current ratio (0.71), highlight liquidity and efficiency concerns. The company maintains dividend payments, supported by a moderate payout, but free cash flow coverage is negative, suggesting potential risks in sustaining distributions.
Evergy, Inc.
Evergy presents a similarly mixed ratio picture with a slightly better net margin at 15.0% and a dividend yield of 4.21%. Its return on equity (8.77%) and return on invested capital (4.52%) remain below optimal, and liquidity ratios are weak, with a current ratio of 0.5. Evergy pays dividends, supported by moderate payout levels, yet negative free cash flow yields imply caution regarding long-term dividend sustainability.
Which one has the best ratios?
Both Dominion Energy and Evergy face challenges with liquidity and capital efficiency, reflected in unfavorable returns and current ratios. Dominion Energy offers a slightly higher dividend yield, while Evergy has a marginally stronger price-to-book ratio. Overall, both companies show a slightly unfavorable ratio profile, with no clear leader in terms of financial strength based on the 2024 data.
Strategic Positioning
This section compares the strategic positioning of Dominion Energy and Evergy, focusing on market position, key segments, and exposure to technological disruption:
Dominion Energy
- Large market cap of 49.5B in regulated electric utilities with significant scale and competitive presence.
- Diverse business segments including Virginia and South Carolina electricity, gas distribution, and contracted renewable energy assets.
- Exposure includes nonregulated renewable natural gas and solar, along with traditional electricity and gas infrastructure.
Evergy
- Smaller market cap of 16.8B in regulated electric utilities focused on Kansas and Missouri markets.
- Concentrated on electric utility generation, transmission, and distribution with multiple energy sources including renewables.
- Utilizes a mix of coal, hydro, landfill gas, uranium, natural gas, oil, solar, and wind, showing diversified energy sources.
Dominion Energy vs Evergy Positioning
Dominion Energy has a diversified portfolio spanning multiple states and energy types, including gas and renewables, offering broad market coverage. Evergy maintains a more concentrated focus on electric utilities across two states with a varied generation mix, potentially limiting scale but diversifying energy sources.
Which has the best competitive advantage?
Both companies exhibit slightly unfavorable MOAT evaluations due to ROIC below WACC, but with growing ROIC trends. Dominion’s larger scale contrasts with Evergy’s mixed generation sources; neither currently demonstrates a strong durable competitive advantage.
Stock Comparison
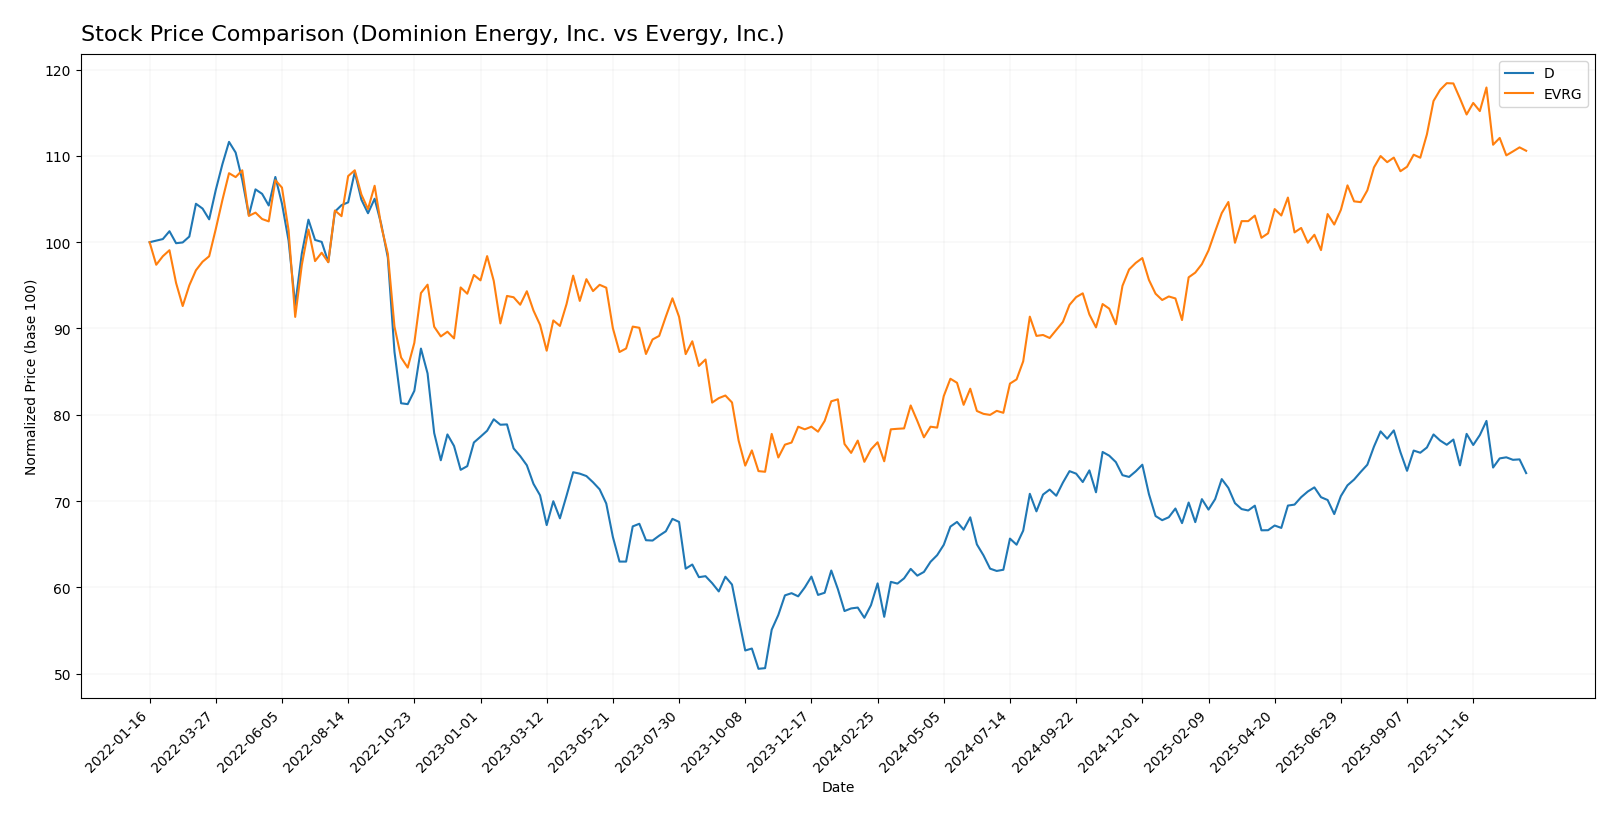
The stock price chart illustrates notable bullish trends for Dominion Energy, Inc. and Evergy, Inc. over the past 12 months, with both showing decelerating momentum and recent short-term declines in price.
Trend Analysis
Dominion Energy, Inc. experienced a 26.43% price increase over the past year, indicating a bullish trend with deceleration and a price range between 44.79 and 62.77. Recent weeks show a mild bearish correction with a -5.04% change.
Evergy, Inc. posted a stronger 45.55% gain over the same period, maintaining a bullish trend despite deceleration and higher volatility. The stock peaked at 77.98 and recently declined by -6.59%, signaling a short-term bearish movement.
Comparing both, Evergy, Inc. delivered higher market performance over the past year, although both stocks have shown recent downward price adjustments.
Target Prices
The analyst consensus on target prices shows a positive outlook for both Dominion Energy, Inc. and Evergy, Inc.
| Company | Target High | Target Low | Consensus |
|---|---|---|---|
| Dominion Energy, Inc. | 70 | 63 | 66 |
| Evergy, Inc. | 93 | 76 | 82.67 |
Analysts expect Dominion Energy’s price to rise from $57.98 to around $66, indicating modest upside potential. Evergy’s consensus target of $82.67 suggests a stronger upside compared to its current $72.82 price.
Analyst Opinions Comparison
This section compares analysts’ ratings and grades for Dominion Energy, Inc. and Evergy, Inc.:
Rating Comparison
D Rating
- Rating: C+ with a status of Very Favorable
- Discounted Cash Flow Score: 4, considered Favorable
- ROE Score: 3, considered Moderate
- ROA Score: 1, considered Very Unfavorable
- Debt To Equity Score: 3, considered Moderate
- Overall Score: 2, considered Moderate
EVRG Rating
- Rating: B- with a status of Very Favorable
- Discounted Cash Flow Score: 1, considered Very Unfavorable
- ROE Score: 3, considered Moderate
- ROA Score: 3, considered Moderate
- Debt To Equity Score: 2, considered Moderate
- Overall Score: 2, considered Moderate
Which one is the best rated?
Evergy holds a higher letter rating (B-) compared to Dominion’s C+, both rated Very Favorable. However, Dominion scores better on discounted cash flow, while Evergy shows stronger return on assets. Overall scores are equal.
Scores Comparison
The scores comparison between Dominion Energy and Evergy highlights their financial health and bankruptcy risk:
Dominion Energy, Inc. Scores
- Altman Z-Score: Unavailable
- Piotroski Score: 7, classified as strong financial strength.
Evergy, Inc. Scores
- Altman Z-Score: 0.82, indicating financial distress zone with high bankruptcy risk.
- Piotroski Score: 5, classified as average financial strength.
Which company has the best scores?
Dominion Energy shows a stronger Piotroski Score of 7, while Evergy’s Altman Z-Score signals financial distress and a lower Piotroski Score of 5. Based solely on provided data, Dominion Energy has the better overall scores.
Grades Comparison
Here is a comparison of the recent grades assigned to Dominion Energy, Inc. and Evergy, Inc.:
Dominion Energy, Inc. Grades
The following table summarizes the latest grades from major financial institutions for Dominion Energy, Inc.:
| Grading Company | Action | New Grade | Date |
|---|---|---|---|
| Barclays | Maintain | Overweight | 2025-12-17 |
| JP Morgan | Maintain | Underweight | 2025-12-11 |
| BMO Capital | Maintain | Market Perform | 2025-11-03 |
| Morgan Stanley | Maintain | Equal Weight | 2025-10-22 |
| Barclays | Maintain | Overweight | 2025-10-07 |
| Morgan Stanley | Maintain | Equal Weight | 2025-09-25 |
| JP Morgan | Maintain | Underweight | 2025-08-21 |
| JP Morgan | Maintain | Underweight | 2025-07-15 |
| Morgan Stanley | Maintain | Equal Weight | 2025-06-18 |
| Morgan Stanley | Maintain | Equal Weight | 2025-05-22 |
Dominion Energy’s ratings mostly cluster around “Hold” or “Equal Weight,” with some mixed “Overweight” and “Underweight” views, indicating a generally cautious sentiment.
Evergy, Inc. Grades
The following table summarizes the latest grades from major financial institutions for Evergy, Inc.:
| Grading Company | Action | New Grade | Date |
|---|---|---|---|
| Mizuho | Downgrade | Neutral | 2025-12-18 |
| UBS | Maintain | Buy | 2025-12-17 |
| Citigroup | Maintain | Buy | 2025-11-10 |
| Jefferies | Maintain | Buy | 2025-10-09 |
| Mizuho | Maintain | Outperform | 2025-08-08 |
| Mizuho | Maintain | Outperform | 2025-07-18 |
| Barclays | Maintain | Overweight | 2025-05-30 |
| Citigroup | Maintain | Buy | 2025-05-16 |
| UBS | Upgrade | Buy | 2025-04-28 |
| Barclays | Maintain | Overweight | 2025-04-22 |
Evergy’s grades show a stronger bias toward “Buy” and “Outperform,” despite a recent downgrade by Mizuho to “Neutral,” reflecting a generally positive outlook.
Which company has the best grades?
Evergy, Inc. has received a higher proportion of “Buy” and “Outperform” grades compared to Dominion Energy’s predominantly “Hold” and mixed ratings. This suggests investors might view Evergy as having better growth or performance potential relative to Dominion Energy in recent assessments.
Strengths and Weaknesses
Below is a comparison table summarizing key strengths and weaknesses of Dominion Energy, Inc. (D) and Evergy, Inc. (EVRG) based on their recent financial and operational data.
| Criterion | Dominion Energy, Inc. (D) | Evergy, Inc. (EVRG) |
|---|---|---|
| Diversification | High: Multiple segments including contracted energy and regional utilities with revenues in multiple billions USD. | Low: Primarily focused on electric utility segment with revenue around 2.7B USD. |
| Profitability | Moderate: Net margin 14.69% (favorable), but ROIC 2.86% below WACC; company shedding value but ROIC growing. | Moderate: Net margin 15.0% (favorable), ROIC 4.52% below WACC; also shedding value with improving ROIC. |
| Innovation | Neutral: No strong signals of innovation leadership; stable but not outstanding asset turnover ratios. | Neutral: Similar asset turnover and financial ratios indicate average innovation impact. |
| Global presence | Limited: Operations mainly regional within the U.S. (Virginia, South Carolina). | Limited: Primarily regional within the U.S. Midwest. |
| Market Share | Strong in regional markets, with revenues exceeding 10B USD in Virginia alone. | Moderate market share, with revenues around 2.7B USD. |
Key takeaways: Both Dominion Energy and Evergy show slightly unfavorable economic moats by shedding value despite growing ROIC trends. Dominion’s more diversified revenue base and larger regional footprint contrast with Evergy’s narrower focus, suggesting Dominion may offer better risk diversification. However, both require cautious consideration due to financial and operational challenges.
Risk Analysis
Below is a comparison table outlining key risks for Dominion Energy, Inc. (D) and Evergy, Inc. (EVRG) based on the most recent data available for 2024.
| Risk | Dominion Energy, Inc. (D) | Evergy, Inc. (EVRG) |
|---|---|---|
| Market Risk | Moderate (Beta 0.70, stable sector) | Moderate (Beta 0.65, regulated utilities) |
| Debt Level | High leverage (Debt/Equity 1.53, interest coverage 2.16) | High leverage (Debt/Equity 1.41, interest coverage 2.61) |
| Regulatory Risk | Significant (regulated electric and gas markets) | Significant (regulated electric markets) |
| Operational Risk | Moderate (large asset base, complex operations) | Moderate (diverse generation sources, grid complexity) |
| Environmental Risk | Elevated (gas distribution and renewable transition) | Elevated (coal and natural gas generation mix) |
| Geopolitical Risk | Low (US-focused operations) | Low (US-focused operations) |
Dominion Energy and Evergy face the most impactful risks from their high debt levels and regulatory environments. Dominion’s broad gas and electricity asset base heightens operational and environmental challenges amid energy transition pressures. Evergy’s coal reliance raises environmental concerns, compounded by financial distress signals such as its Altman Z-Score in the distress zone, indicating elevated bankruptcy risk. Cautious risk management is advised for both.
Which Stock to Choose?
Dominion Energy, Inc. (D) shows a favorable income statement with steady net margin growth and improving EBIT margin, despite slight revenue declines. Its financial ratios are slightly unfavorable overall, with moderate debt and a C+ rating reflecting mixed performance and moderate financial strength.
Evergy, Inc. (EVRG) exhibits a favorable income profile marked by solid revenue and net income growth alongside strong EBIT margin. Its financial ratios are also slightly unfavorable but with a somewhat better balance, supported by a B- rating and moderate financial scores that indicate average financial health.
For investors prioritizing income growth and profitability stability, Evergy may appear more aligned, given its stronger income growth and higher rating. Conversely, those focused on dividend yield and value consistency might find Dominion’s profile more fitting, despite its mixed ratios. Both companies show growing ROIC trends but are currently shedding value relative to WACC, suggesting cautious evaluation based on risk tolerance.
Disclaimer: Investment carries a risk of loss of initial capital. The past performance is not a reliable indicator of future results. Be sure to understand risks before making an investment decision.
Go Further
I encourage you to read the complete analyses of Dominion Energy, Inc. and Evergy, Inc. to enhance your investment decisions: