Dominion Energy, Inc. and Entergy Corporation are two major players in the regulated electric utility industry, each serving millions of customers across different U.S. regions. Both companies emphasize innovation in energy generation and distribution, including renewable sources and nuclear power. Their overlapping markets and commitment to sustainable growth make them natural candidates for comparison. In this article, I will help you determine which of these utilities offers the most compelling investment opportunity.

Table of contents
Companies Overview
I will begin the comparison between Dominion Energy and Entergy by providing an overview of these two companies and their main differences.
Dominion Energy Overview
Dominion Energy, Inc. operates in the regulated electric industry, producing and distributing energy across multiple U.S. states. The company’s mission focuses on regulated electricity and natural gas sales, serving over 6.9M customers through its Virginia, South Carolina, and gas distribution segments. Dominion manages a vast infrastructure including 30.2GW of electric capacity and extensive transmission and distribution lines, emphasizing a mix of regulated and nonregulated renewable assets.
Entergy Overview
Entergy Corporation also operates in the regulated electric sector, generating and distributing electricity primarily in Arkansas, Louisiana, Mississippi, and Texas. It serves around 3M utility customers and operates both utility and wholesale commodity segments. Entergy’s generation portfolio includes gas, nuclear, coal, hydro, and solar, with a total capacity of approximately 26GW, including 6GW nuclear power, reflecting a diversified energy mix and a focus on retail and wholesale electricity sales.
Key similarities and differences
Both companies operate in the U.S. regulated electric utilities sector, focusing on electricity generation and distribution with significant customer bases. Dominion Energy has a broader geographic footprint and larger customer reach, while Entergy’s capacity is slightly smaller but includes a substantial nuclear power component. Dominion emphasizes gas and renewable segments, whereas Entergy has a diversified generation mix including nuclear and wholesale power operations, reflecting differences in asset composition and market approach.
Income Statement Comparison
The following table presents a side-by-side comparison of key income statement metrics for Dominion Energy, Inc. and Entergy Corporation for the fiscal year 2024.
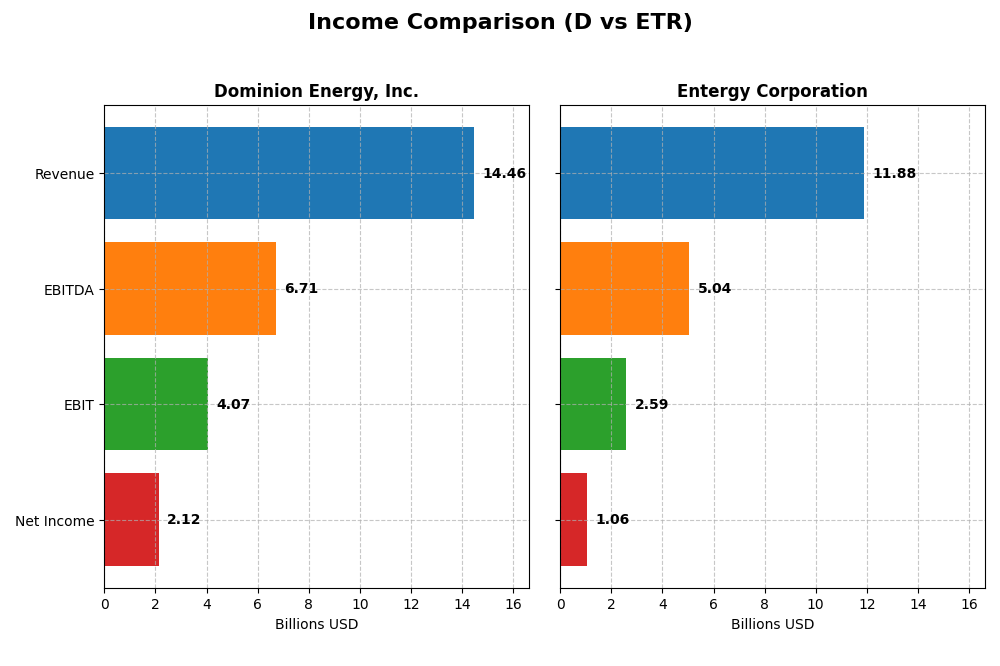
| Metric | Dominion Energy, Inc. | Entergy Corporation |
|---|---|---|
| Market Cap | 49.5B | 41.8B |
| Revenue | 14.46B | 11.88B |
| EBITDA | 6.71B | 5.04B |
| EBIT | 4.07B | 2.59B |
| Net Income | 2.12B | 1.06B |
| EPS | 2.44 | 2.47 |
| Fiscal Year | 2024 | 2024 |
Income Statement Interpretations
Dominion Energy, Inc.
Dominion Energy’s revenue showed modest growth from 2020 to 2024, increasing from $14.2B to $14.5B, with net income rising significantly from a loss of $-477M in 2020 to $2.1B in 2024. Margins remained generally favorable, with gross margin stable around 48% and net margin improving to 14.7%. In 2024, revenue growth slowed to 0.46%, but EBIT and net margin both improved, indicating enhanced profitability.
Entergy Corporation
Entergy’s revenue grew more robustly over the period, from $10.1B in 2020 to $11.9B in 2024, despite a 2.2% decline in 2024. Net income decreased overall by 24.6%, with $1.4B in 2020 falling to $1.1B in 2024. Margins saw a favorable gross margin near 48%, but EBIT and net margins declined, reflecting operational challenges. The latest year showed mixed results, with gross profit up but EBIT and net margin down, highlighting margin compression.
Which one has the stronger fundamentals?
Dominion Energy exhibits stronger fundamentals, with a favorable overall income statement evaluation and significant net income growth of over 600% across five years. Its margins are generally higher and improving, despite slightly slower revenue growth. Conversely, Entergy faces unfavorable income statement trends, including declining net income and margins, despite revenue growth, indicating weaker profitability and operational efficiency over the period.
Financial Ratios Comparison
The table below compares key financial ratios for Dominion Energy, Inc. and Entergy Corporation based on their most recent fiscal year, 2024. These ratios provide insights into profitability, liquidity, valuation, leverage, and efficiency.
| Ratios | Dominion Energy, Inc. (D) | Entergy Corporation (ETR) |
|---|---|---|
| ROE | 7.79% | 7.02% |
| ROIC | 2.86% | 3.20% |
| P/E | 21.28 | 30.56 |
| P/B | 1.66 | 2.14 |
| Current Ratio | 0.71 | 0.72 |
| Quick Ratio | 0.52 | 0.43 |
| D/E (Debt to Equity) | 1.53 | 1.91 |
| Debt-to-Assets | 40.8% | 44.6% |
| Interest Coverage | 1.72 | 2.30 |
| Asset Turnover | 0.14 | 0.18 |
| Fixed Asset Turnover | 0.21 | 0.25 |
| Payout Ratio | 105% | 94% |
| Dividend Yield | 4.95% | 3.08% |
Interpretation of the Ratios
Dominion Energy, Inc.
Dominion Energy exhibits a mixed ratio profile with strengths in net margin (14.69%, favorable) and dividend yield (4.95%, favorable), but weaknesses in return on equity (7.79%) and capital efficiency ratios, including asset turnover. The current and quick ratios indicate liquidity concerns. The company pays dividends supported by a solid yield, but some coverage and leverage metrics suggest caution in sustainability.
Entergy Corporation
Entergy shows neutral to unfavorable ratios, with a moderate net margin (8.93%, neutral) and a lower dividend yield (3.08%, favorable). Leverage and liquidity ratios are weak, and the price-to-earnings ratio is relatively high at 30.56, signaling potential valuation risk. Dividend payments exist, but the overall financial health reflects challenges in profitability and capital management.
Which one has the best ratios?
Dominion Energy presents a slightly more favorable overall ratio profile than Entergy, with higher net margin and dividend yield, despite weaknesses in liquidity and returns. Entergy’s ratios skew more toward unfavorable, particularly with a higher P/E and weaker capital efficiency. Both companies face challenges, but Dominion’s ratios are comparatively stronger.
Strategic Positioning
This section compares the strategic positioning of Dominion Energy and Entergy Corporation, including their market position, key segments, and exposure to technological disruption:
Dominion Energy, Inc. (D)
- Market position and competitive pressure
- Key segments and business drivers
- Exposure to technological disruption
Entergy Corporation (ETR)
- Leading in regulated electric markets in Virginia, Carolinas; faces moderate competition.
- Diverse segments: Virginia and South Carolina electricity, gas distribution, contracted renewable energy.
- Moderate exposure with investments in renewable natural gas and solar generation facilities.
Dominion Energy vs Entergy Corporation Positioning
Dominion Energy follows a diversified strategy across multiple regulated utility and gas distribution segments, benefiting from geographic spread. Entergy concentrates on electric utilities and wholesale commodities, including nuclear power, with a focus on fewer states. Dominion’s diversification may offer broader revenue streams, while Entergy’s specialized segments may face concentrated risks.
Which has the best competitive advantage?
Both companies are shedding value relative to their cost of capital. Dominion Energy shows a growing ROIC trend, indicating improving profitability, while Entergy experiences declining ROIC, reflecting worsening profitability and a weaker moat.
Stock Comparison
The stock price movements of Dominion Energy, Inc. and Entergy Corporation over the past year reveal significant bullish trends with recent deceleration and slight downward adjustments in the last quarter.
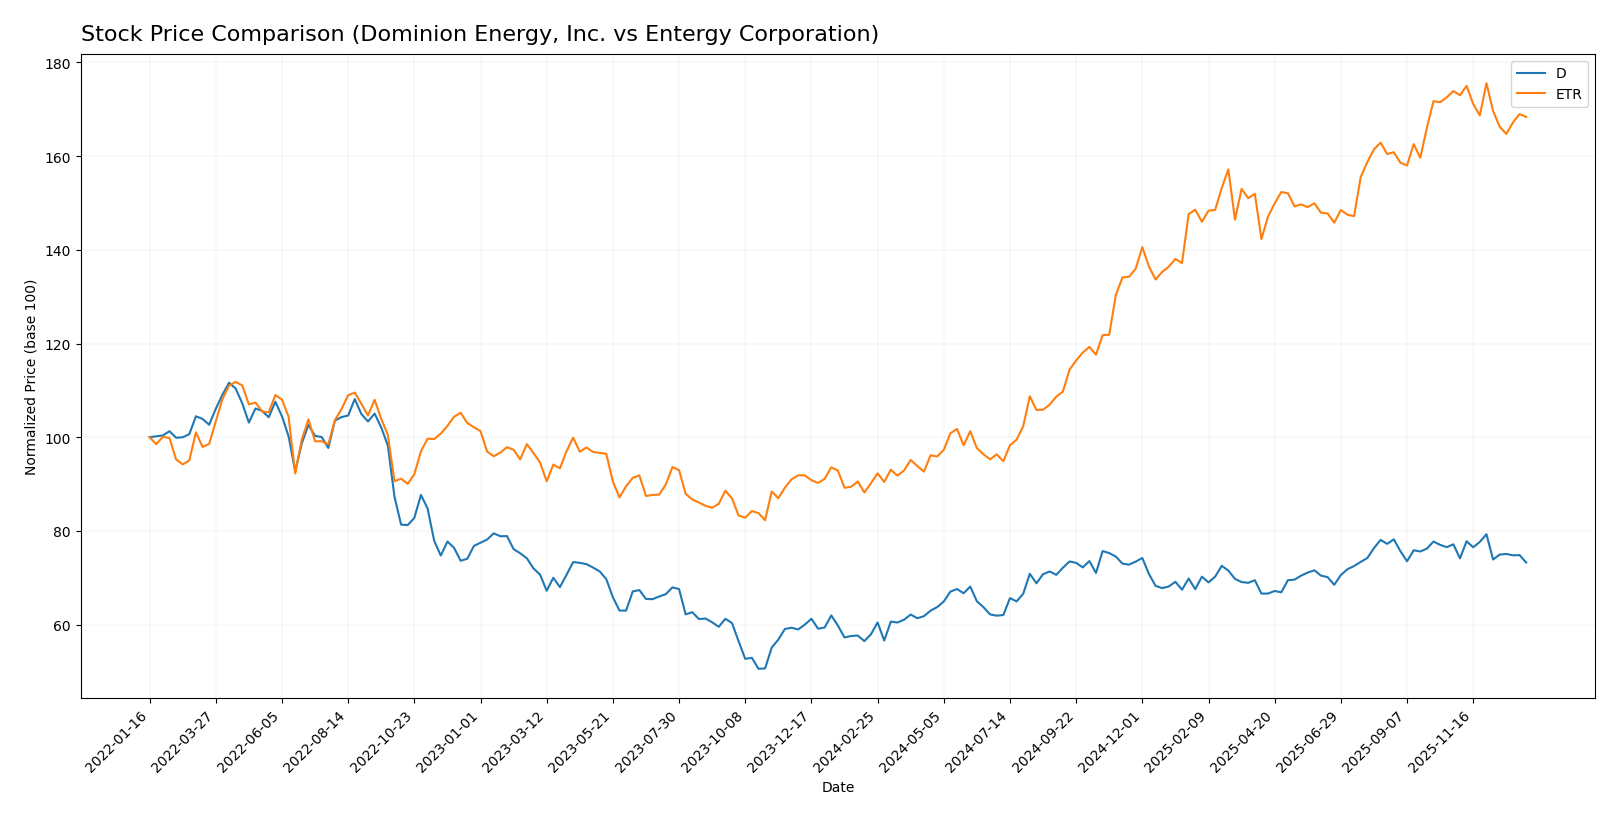
Trend Analysis
Dominion Energy, Inc. shows a bullish trend with a 26.43% price increase over the past 12 months, despite recent deceleration and a 5.04% decline in the last quarter, with moderate volatility at 4.03 std deviation.
Entergy Corporation exhibits a stronger bullish trend, gaining 86.74% over the year but also decelerating recently with a 3.17% drop in the last quarter and higher volatility at 15.22 std deviation.
Comparing both, Entergy Corporation delivered the highest market performance in the past year, outperforming Dominion Energy by a substantial margin in price appreciation.
Target Prices
The current analyst consensus presents promising target price ranges for Dominion Energy, Inc. and Entergy Corporation.
| Company | Target High | Target Low | Consensus |
|---|---|---|---|
| Dominion Energy, Inc. | 70 | 63 | 66 |
| Entergy Corporation | 115 | 91 | 103.17 |
Analysts expect Dominion Energy’s stock to appreciate from its current price of $57.98 toward a consensus target of $66, indicating moderate upside potential. Entergy’s consensus target of $103.17 significantly exceeds its current price of $93.52, suggesting stronger anticipated growth.
Analyst Opinions Comparison
This section compares analysts’ ratings and grades for Dominion Energy, Inc. (D) and Entergy Corporation (ETR):
Rating Comparison
D Rating
- Rating: C+, assessed as Very Favorable overall rating.
- Discounted Cash Flow Score: 4, indicating a Favorable valuation outlook.
- ROE Score: 3, considered Moderate efficiency in generating profit from equity.
- ROA Score: 1, marked as Very Unfavorable asset utilization efficiency.
- Debt To Equity Score: 3, reflecting Moderate financial risk.
- Overall Score: 2, classified as Moderate overall financial standing.
ETR Rating
- Rating: B-, assessed as Very Favorable overall rating.
- Discounted Cash Flow Score: 1, indicating a Very Unfavorable valuation outlook.
- ROE Score: 4, considered Favorable efficiency in generating profit from equity.
- ROA Score: 3, marked as Moderate asset utilization efficiency.
- Debt To Equity Score: 2, reflecting Moderate financial risk but slightly better.
- Overall Score: 2, classified as Moderate overall financial standing.
Which one is the best rated?
Both companies share a Moderate overall score of 2, but ETR holds a higher rating of B- compared to D’s C+. ETR scores better on ROE and ROA, while D shows a stronger discounted cash flow score.
Scores Comparison
Here is a comparison of the financial scores for Dominion Energy, Inc. (D) and Entergy Corporation (ETR):
D Scores
- Piotroski Score of 7, indicating strong financial health.
- Altman Z-Score unavailable for D.
ETR Scores
- Piotroski Score of 4, indicating average financial health.
- Altman Z-Score of 1.04, placing ETR in the distress zone.
Which company has the best scores?
Based on the available data, Dominion Energy has a stronger Piotroski Score, signaling better financial health. Entergy’s Altman Z-Score suggests financial distress, while Dominion’s Altman score is unavailable.
Grades Comparison
The following presents the recent grades assigned to Dominion Energy, Inc. and Entergy Corporation by reputable grading companies:
Dominion Energy, Inc. Grades
This table summarizes the latest grades given to Dominion Energy by established financial institutions.
| Grading Company | Action | New Grade | Date |
|---|---|---|---|
| Barclays | Maintain | Overweight | 2025-12-17 |
| JP Morgan | Maintain | Underweight | 2025-12-11 |
| BMO Capital | Maintain | Market Perform | 2025-11-03 |
| Morgan Stanley | Maintain | Equal Weight | 2025-10-22 |
| Barclays | Maintain | Overweight | 2025-10-07 |
| Morgan Stanley | Maintain | Equal Weight | 2025-09-25 |
| JP Morgan | Maintain | Underweight | 2025-08-21 |
| JP Morgan | Maintain | Underweight | 2025-07-15 |
| Morgan Stanley | Maintain | Equal Weight | 2025-06-18 |
| Morgan Stanley | Maintain | Equal Weight | 2025-05-22 |
Dominion Energy’s grades show a mixed sentiment, with several equal weight and underweight ratings, but some overweight opinions from Barclays.
Entergy Corporation Grades
Below is the summary of Entergy’s recent grades from credible financial analysts.
| Grading Company | Action | New Grade | Date |
|---|---|---|---|
| Argus Research | Maintain | Buy | 2026-01-06 |
| UBS | Maintain | Buy | 2025-12-17 |
| Keybanc | Maintain | Overweight | 2025-12-12 |
| JP Morgan | Maintain | Overweight | 2025-12-11 |
| Citigroup | Maintain | Neutral | 2025-11-18 |
| Evercore ISI Group | Maintain | In Line | 2025-10-30 |
| Mizuho | Maintain | Outperform | 2025-10-27 |
| Morgan Stanley | Maintain | Equal Weight | 2025-10-22 |
| B of A Securities | Maintain | Neutral | 2025-10-16 |
| Keybanc | Maintain | Overweight | 2025-10-15 |
Entergy Corporation’s grades predominantly reflect positive ratings, including several buy and overweight recommendations.
Which company has the best grades?
Entergy Corporation holds the stronger overall grades, with a consensus leaning towards “Buy” and numerous overweight and outperform ratings. Dominion Energy’s consensus is “Hold” with more balanced and cautious grades. This disparity may influence investors considering growth potential versus stability.
Strengths and Weaknesses
Below is a comparative overview of key strengths and weaknesses for Dominion Energy, Inc. (D) and Entergy Corporation (ETR) based on recent financial and operational data.
| Criterion | Dominion Energy, Inc. (D) | Entergy Corporation (ETR) |
|---|---|---|
| Diversification | Moderate diversification with strong regional utilities in Virginia and South Carolina; energy contracting segment adds revenue diversity | Diversified across commercial, residential, industrial sectors; significant regulated utility operations |
| Profitability | Net margin favorable at 14.69%; ROIC slightly unfavorable at 2.86% but improving | Net margin neutral at 8.93%; ROIC unfavorable at 3.2% with declining trend |
| Innovation | Gradual shift towards contracted energy and cleaner energy sources; innovation pace moderate | Limited recent innovation; focus remains on stable utility services rather than expansion |
| Global presence | Primarily US regional focus, concentrated in Virginia and South Carolina | US-centric with no significant global footprint |
| Market Share | Strong presence in Virginia market, generating over $10B revenue | Broad US utility market coverage but with lower growth momentum |
Key takeaways: Dominion Energy shows improving profitability trends despite current value destruction, supported by a focused regional market and increasing ROIC. Entergy faces challenges with declining profitability and less favorable financial ratios, signaling caution for investors seeking growth and value creation.
Risk Analysis
The following table summarizes key risks for Dominion Energy, Inc. and Entergy Corporation as of 2024, helping investors weigh potential challenges.
| Metric | Dominion Energy, Inc. (D) | Entergy Corporation (ETR) |
|---|---|---|
| Market Risk | Moderate (Beta: 0.699) | Moderate (Beta: 0.648) |
| Debt level | High (Debt/Equity: 1.53) | Very High (Debt/Equity: 1.91) |
| Regulatory Risk | Significant in US utilities | Significant in US utilities |
| Operational Risk | Asset turnover low (0.14) | Asset turnover low (0.18) |
| Environmental Risk | Exposure to fossil & renewable | Nuclear plant operations risk |
| Geopolitical Risk | Low US domestic focus | Low US domestic focus |
Dominion’s most impactful risks include high debt and low liquidity ratios, despite a solid dividend yield. Entergy faces heightened financial distress risks, confirmed by a low Altman Z-score (1.04) indicating potential bankruptcy concerns, mainly due to heavy debt and nuclear plant operational risks. Caution and close monitoring are advised.
Which Stock to Choose?
Dominion Energy, Inc. shows a slightly unfavorable financial ratio profile despite favorable income statement metrics, with improving profitability but high debt levels and a moderate rating of C+. Its ROIC remains below WACC, indicating value destruction, though ROIC trends upward.
Entergy Corporation presents an unfavorable ratio evaluation and an unfavorable income statement trend, with declining profitability and higher debt ratios. Its rating is B- with average Piotroski health scores, while its ROIC stays below WACC and is declining, signaling worsening value destruction.
For risk-averse investors prioritizing stability, Dominion Energy’s improving profitability and favorable income metrics might appear more attractive, while risk-tolerant investors focused on growth could see Entergy’s strong recent price appreciation as an opportunity despite financial challenges.
Disclaimer: Investment carries a risk of loss of initial capital. The past performance is not a reliable indicator of future results. Be sure to understand risks before making an investment decision.
Go Further
I encourage you to read the complete analyses of Dominion Energy, Inc. and Entergy Corporation to enhance your investment decisions: