Dominion Energy, Inc. and Edison International are two leading players in the regulated electric utility sector, both serving millions of customers across different U.S. regions. Their overlapping focus on electricity generation, transmission, and distribution, combined with a growing emphasis on innovation and renewable energy, makes them compelling peers for comparison. In this article, I will help you evaluate which company offers the most attractive investment opportunity in today’s dynamic energy landscape.
Table of contents
Companies Overview
I will begin the comparison between Dominion Energy, Inc. and Edison International by providing an overview of these two companies and their main differences.
Dominion Energy Overview
Dominion Energy, Inc. operates as a regulated electric utility company in the United States, serving approximately 2.7M electricity customers in Virginia and North Carolina and 3.1M natural gas customers across several states. It manages a diverse portfolio including electric generation, transmission, distribution, and gas operations with over 30.2GW of generating capacity and extensive transmission and distribution infrastructure. Headquartered in Richmond, Virginia, Dominion emphasizes regulated energy distribution and renewable assets.
Edison International Overview
Edison International, founded in 1886 and based in Rosemead, California, generates and distributes electricity to about 15M customers across Southern, Central, and Coastal California. It focuses on electric power delivery and energy solutions for commercial and industrial users, leveraging a large transmission and distribution network with approximately 70,000 circuit-miles of lines and 800 substations. Edison operates mainly in the regulated electric sector with a strong regional presence in California.
Key similarities and differences
Both Dominion Energy and Edison International operate in the regulated electric utility industry, focusing on electricity generation and distribution to millions of customers. Dominion has a more diversified geographic footprint including natural gas distribution, while Edison’s operations are concentrated in California with a larger customer base. Both companies maintain extensive transmission and distribution infrastructure, but Dominion integrates more renewable and gas assets, contrasting Edison’s emphasis on electric power and energy solutions.
Income Statement Comparison
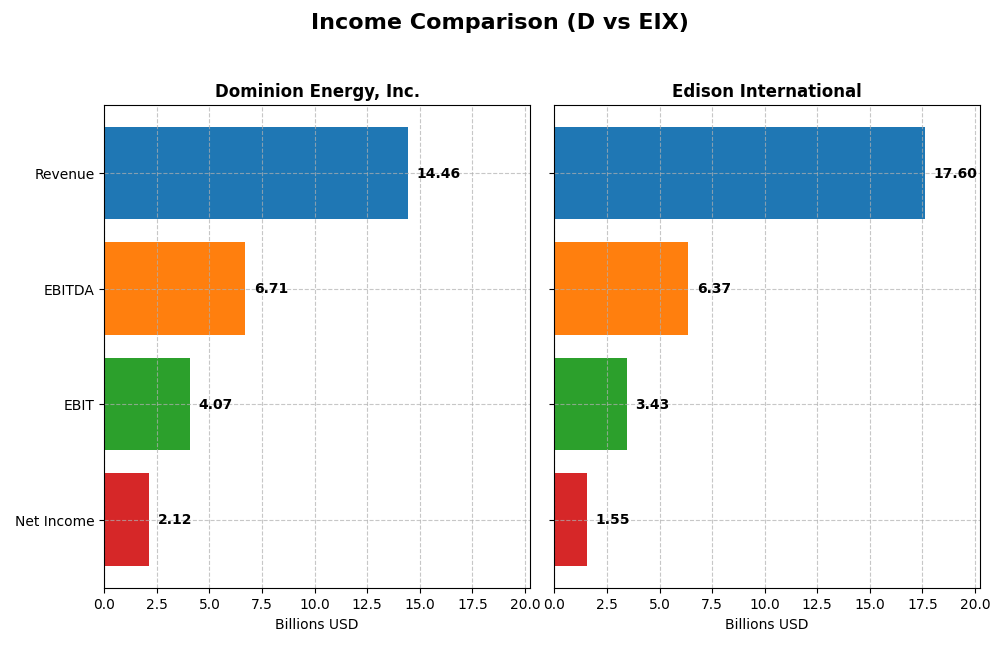
Below is the income statement comparison for Dominion Energy, Inc. and Edison International for the fiscal year 2024, highlighting key financial metrics.
| Metric | Dominion Energy, Inc. | Edison International |
|---|---|---|
| Market Cap | 49.5B | 23.5B |
| Revenue | 14.5B | 17.6B |
| EBITDA | 6.7B | 6.4B |
| EBIT | 4.1B | 3.4B |
| Net Income | 2.1B | 1.5B |
| EPS | 2.44 | 3.33 |
| Fiscal Year | 2024 | 2024 |
Income Statement Interpretations
Dominion Energy, Inc.
Dominion Energy’s revenue showed modest growth from 2020 to 2024, increasing from $14.17B to $14.46B, with net income rising sharply from a negative $477M in 2020 to $2.04B in 2024. Margins remained generally stable, with a favorable gross margin around 47.9% and improving net margin to 14.7%. The latest year saw slower revenue growth at 0.46%, but net income and margins improved, reflecting operational efficiency gains.
Edison International
Edison International’s revenue increased more robustly over the period, from $13.58B in 2020 to $17.60B in 2024, accompanied by net income growth from $739M to $1.28B. Margins were favorable but lower than Dominion’s, with a gross margin of 41.0% and net margin near 8.8%. The most recent fiscal year showed solid revenue growth of 7.7%, stable margins, and EPS growth, indicating steady operational performance.
Which one has the stronger fundamentals?
Both companies demonstrate favorable income statement fundamentals, but Dominion Energy exhibits stronger profitability metrics with higher gross and net margins and more significant net income growth over the period. Edison International shows stronger revenue growth and a higher proportion of favorable income statement growth metrics. Overall, Dominion’s robust margin profile contrasts with Edison’s revenue expansion, reflecting different strengths in their fundamentals.
Financial Ratios Comparison
The table below presents key financial ratios for Dominion Energy, Inc. (D) and Edison International (EIX) based on their most recent full fiscal year data for 2024.
| Ratios | Dominion Energy, Inc. (D) | Edison International (EIX) |
|---|---|---|
| ROE | 7.79% | 9.93% |
| ROIC | 2.86% | 3.61% |
| P/E | 21.3 | 19.9 |
| P/B | 1.66 | 1.98 |
| Current Ratio | 0.71 | 0.85 |
| Quick Ratio | 0.52 | 0.78 |
| D/E (Debt-to-Equity) | 1.53 | 2.43 |
| Debt-to-Assets | 40.8% | 44.1% |
| Interest Coverage | 1.72 | 1.57 |
| Asset Turnover | 0.14 | 0.21 |
| Fixed Asset Turnover | 0.21 | 0.29 |
| Payout Ratio | 105.4% | 83.2% |
| Dividend Yield | 4.95% | 4.17% |
Interpretation of the Ratios
Dominion Energy, Inc.
Dominion Energy shows a mixed financial profile with a strong net margin of 14.69% and a favorable weighted average cost of capital at 5.34%, indicating efficient capital use. However, the company faces challenges with low returns on equity (7.79%) and invested capital (2.86%), alongside weak liquidity ratios under 1, and high leverage metrics. The dividend yield is solid at 4.95%, suggesting stable shareholder returns, supported by dividend payments, but caution is warranted due to some unfavorable leverage and asset turnover ratios.
Edison International
Edison International presents slightly weaker profitability with an 8.78% net margin and a return on equity under 10%, both flagged as neutral to unfavorable. The firm’s leverage is higher with a debt-to-equity ratio of 2.43, and liquidity ratios remain below 1, indicating potential short-term financial stress. Its dividend yield stands at 4.17%, reflecting consistent payouts, though coverage and free cash flow concerns suggest moderate risks in sustaining distributions amid operational pressures.
Which one has the best ratios?
Dominion Energy holds a slightly more favorable overall ratio profile with better profitability margins and a lower cost of capital than Edison International. While both companies struggle with liquidity and leverage, Dominion’s stronger net margin and dividend yield improve its standing. Edison International’s higher leverage and weaker interest coverage contribute to a less favorable evaluation, making Dominion Energy comparatively stronger in ratio terms.
Strategic Positioning
This section compares the strategic positioning of Dominion Energy (D) and Edison International (EIX) covering market position, key segments, and exposure to technological disruption:
Dominion Energy, Inc. (D)
- Large market cap at $49.5B with moderate beta 0.70, facing regulated electric competitive pressures.
- Diverse segments: Virginia & South Carolina electricity, gas distribution, and contracted renewable energy assets.
- Exposure to renewable energy development and natural gas infrastructure; ongoing gas storage and LNG operations.
Edison International (EIX)
- Smaller market cap at $23.5B, beta 0.83; operates in regulated electric sector with regional competition.
- Focused on electricity generation and delivery to 15M customers in California, plus energy solutions.
- Reliance on electric utility and competitive power generation; no explicit gas involvement mentioned.
Dominion Energy, Inc. vs Edison International Positioning
Dominion Energy pursues a diversified business model across multiple states and energy types, including gas and renewables, while Edison International concentrates on electric power delivery in California. Dominion’s broader portfolio offers multiple revenue streams; Edison benefits from scale in a large regional market.
Which has the best competitive advantage?
Both companies are rated slightly unfavorable in MOAT evaluation, shedding value but with improving ROIC trends. Neither demonstrates a clear competitive advantage based on current ROIC vs WACC data.
Stock Comparison
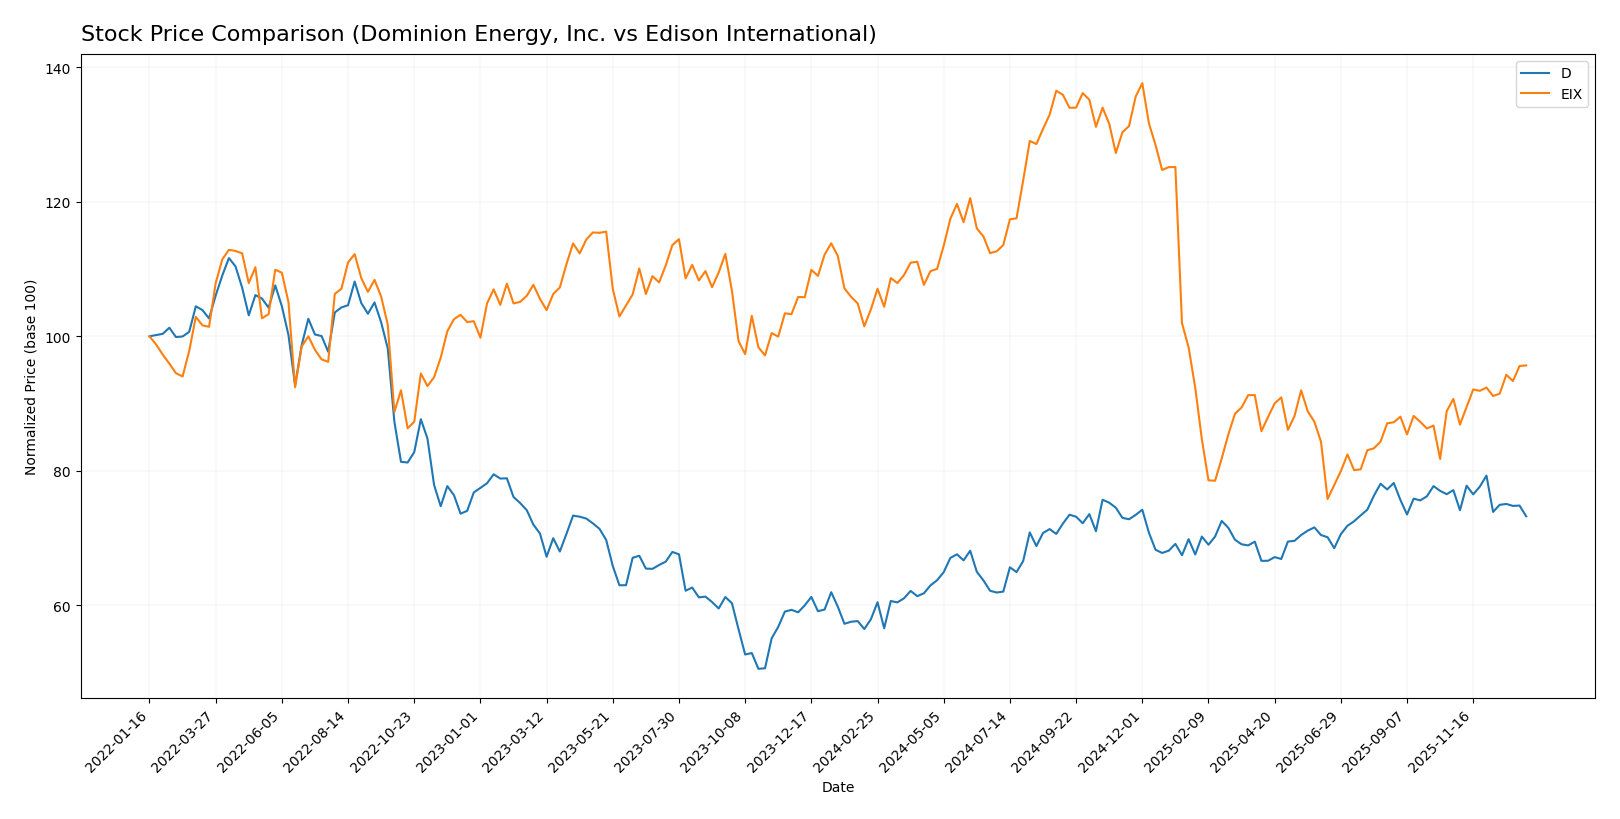
The stock price movements of Dominion Energy, Inc. (D) and Edison International (EIX) over the past 12 months reveal contrasting trends, with Dominion showing a strong overall gain despite recent weakness, while Edison International has experienced a significant decline followed by a recent recovery phase.
Trend Analysis
Dominion Energy, Inc. posted a bullish trend over the last 12 months with a 26.43% price increase, although the momentum has decelerated. The stock ranged between 44.79 and 62.77, with recent weeks showing a mild bearish correction of -5.04%.
Edison International faced a bearish trend with an 8.02% price decrease overall, but its decline has accelerated. The stock exhibited high volatility, with prices between 48.32 and 87.75, and recently reversed to a short-term bullish trend, gaining 5.5%.
Comparing the two, Dominion Energy delivered the highest market performance over the past year, outperforming Edison International despite recent downward pressure.
Target Prices
Analysts provide a cautiously optimistic consensus for these utilities stocks.
| Company | Target High | Target Low | Consensus |
|---|---|---|---|
| Dominion Energy, Inc. | 70 | 63 | 66 |
| Edison International | 70 | 56 | 62 |
The target consensus for Dominion Energy at 66 is above its current price of 57.98, suggesting moderate upside potential. Edison International’s consensus of 62 also exceeds its current price of 60.99, indicating a slightly positive outlook from analysts.
Analyst Opinions Comparison
This section compares analysts’ ratings and grades for Dominion Energy, Inc. (D) and Edison International (EIX):
Rating Comparison
D Rating
- Rating: C+, considered very favorable
- Discounted Cash Flow Score: 4, indicating favorable cash flow valuation
- ROE Score: 3, moderate efficiency in generating profit from equity
- ROA Score: 1, very unfavorable in utilizing assets effectively
- Debt To Equity Score: 3, moderate financial risk
- Overall Score: 2, moderate overall financial standing
EIX Rating
- Rating: B+, considered very favorable
- Discounted Cash Flow Score: 1, considered very unfavorable
- ROE Score: 5, very favorable for profit generation efficiency
- ROA Score: 4, favorable asset utilization
- Debt To Equity Score: 1, very unfavorable due to higher financial risk
- Overall Score: 3, moderate overall financial standing
Which one is the best rated?
Edison International has a better overall rating (B+) and stronger ROE and ROA scores, while Dominion Energy scores higher on discounted cash flow and debt-to-equity metrics. The choice depends on the specific financial aspects valued.
Scores Comparison
Here is a comparison of the key financial scores for Dominion Energy, Inc. and Edison International:
Dominion Energy, Inc. Scores
- Altman Z-Score: Unavailable, no data provided.
- Piotroski Score: 7, classified as strong financial health.
Edison International Scores
- Altman Z-Score: 0.72, in the distress zone, indicating high bankruptcy risk.
- Piotroski Score: 6, indicating average financial strength.
Which company has the best scores?
Dominion Energy has a higher Piotroski Score of 7 compared to Edison International’s 6, suggesting stronger financial health. Edison’s Altman Z-Score indicates financial distress, while Dominion’s Altman score is unavailable.
Grades Comparison
Here is the detailed comparison of grades from reputable financial institutions for both companies:
Dominion Energy, Inc. Grades
This table summarizes recent grades and actions from major grading firms for Dominion Energy, Inc.:
| Grading Company | Action | New Grade | Date |
|---|---|---|---|
| Barclays | Maintain | Overweight | 2025-12-17 |
| JP Morgan | Maintain | Underweight | 2025-12-11 |
| BMO Capital | Maintain | Market Perform | 2025-11-03 |
| Morgan Stanley | Maintain | Equal Weight | 2025-10-22 |
| Barclays | Maintain | Overweight | 2025-10-07 |
| Morgan Stanley | Maintain | Equal Weight | 2025-09-25 |
| JP Morgan | Maintain | Underweight | 2025-08-21 |
| JP Morgan | Maintain | Underweight | 2025-07-15 |
| Morgan Stanley | Maintain | Equal Weight | 2025-06-18 |
| Morgan Stanley | Maintain | Equal Weight | 2025-05-22 |
The overall trend for Dominion Energy shows a mixture of “Underweight” and “Equal Weight” ratings, with several “Overweight” grades from Barclays, indicating a varied analyst outlook but a slight leaning toward neutral to cautious positioning.
Edison International Grades
This table presents the latest grades and actions from recognized grading companies for Edison International:
| Grading Company | Action | New Grade | Date |
|---|---|---|---|
| Morgan Stanley | Maintain | Underweight | 2025-12-17 |
| JP Morgan | Maintain | Neutral | 2025-12-12 |
| UBS | Maintain | Buy | 2025-12-02 |
| Ladenburg Thalmann | Maintain | Neutral | 2025-10-30 |
| Barclays | Maintain | Overweight | 2025-10-29 |
| Jefferies | Maintain | Hold | 2025-10-22 |
| Morgan Stanley | Maintain | Underweight | 2025-10-22 |
| Barclays | Maintain | Overweight | 2025-10-21 |
| Jefferies | Downgrade | Hold | 2025-10-02 |
| JP Morgan | Maintain | Neutral | 2025-09-25 |
Edison International’s grades show a stronger bias toward “Buy” and “Overweight” ratings, with some “Neutral” and “Underweight” stances, reflecting a generally more positive analyst sentiment compared to Dominion Energy.
Which company has the best grades?
Edison International has received relatively better grades overall, with a consensus leaning toward “Buy,” supported by multiple “Overweight” and “Buy” ratings. Dominion Energy’s grades trend more toward “Hold” with mixed views. This divergence may influence investors by suggesting differing levels of confidence and risk perception between the two companies.
Strengths and Weaknesses
Below is a comparative overview of key strengths and weaknesses for Dominion Energy, Inc. (D) and Edison International (EIX) based on their latest financial and operational data.
| Criterion | Dominion Energy, Inc. (D) | Edison International (EIX) |
|---|---|---|
| Diversification | Moderate diversification across energy generation and distribution segments, with significant revenue from Dominion Energy Virginia (10.2B in 2024) and South Carolina (3.3B) | Less diversified; mainly electric utility and competitive power generation |
| Profitability | Net margin 14.7% (favorable), but ROIC 2.9% below WACC causing slight value destruction; growing ROIC indicates improving profitability | Net margin 8.8% (neutral), ROIC 3.6% also below WACC; value destruction ongoing but with strong ROIC growth |
| Innovation | Limited data on innovation; steady investment in contracted energy and infrastructure segments | Innovation focus not prominent; core in traditional electric utility services |
| Global presence | Primarily regional focus in Virginia and South Carolina, limited international exposure | Focused on US markets, no notable global footprint |
| Market Share | Strong regional market share in Virginia energy provision | Strong presence in California electric utility market |
Key takeaways: Both companies currently experience slight value destruction as ROIC remains below WACC despite improving profitability trends. Dominion Energy benefits from greater revenue diversification, while Edison International has a narrower focus with less favorable financial ratios. Caution is warranted with both, favoring those who monitor ROIC trends closely for future investment decisions.
Risk Analysis
Below is a comparative table highlighting key risks for Dominion Energy, Inc. (D) and Edison International (EIX) based on the latest 2024 data and 2026 context:
| Metric | Dominion Energy, Inc. (D) | Edison International (EIX) |
|---|---|---|
| Market Risk | Moderate (Beta 0.70) | Moderate-High (Beta 0.83) |
| Debt level | High (Debt/Equity 1.53; Interest Coverage 2.16) | Very High (Debt/Equity 2.43; Interest Coverage 1.84) |
| Regulatory Risk | Significant (Utilities sector, multi-state operations) | Significant (California-focused utility, stringent regulations) |
| Operational Risk | Moderate (Large asset base, complex operations) | Moderate-High (Extensive grid, wildfire liabilities) |
| Environmental Risk | Elevated (Renewables transition, gas infrastructure) | Elevated (California wildfire risk, clean energy mandates) |
| Geopolitical Risk | Low (US domestic operations) | Low (US domestic operations) |
Dominion Energy faces moderate market risk and a high but manageable debt load, with operational complexity in multiple states. Edison International carries a higher debt burden and faces increased regulatory and environmental risks, notably wildfire liabilities in California, which can severely impact operations and costs. The most impactful risks for both are regulatory pressures and environmental challenges amid the energy transition.
Which Stock to Choose?
Dominion Energy, Inc. (D) shows a slightly unfavorable financial ratios profile with 50% unfavorable metrics, including weak asset turnover and liquidity ratios. Its income statement is favorable, with strong net margin growth and profitability, though debt levels remain moderate. The firm has a slightly unfavorable moat status, indicating value destruction despite rising profitability, and holds a very favorable C+ rating.
Edison International (EIX) presents an overall unfavorable ratios evaluation with 57% unfavorable metrics, particularly due to high debt-to-equity and weak interest coverage. However, its income statement is favorable, showing steady revenue and net income growth. The company also has a slightly unfavorable moat, reflecting value destruction but improving returns, and a very favorable B+ rating despite some distress signals in bankruptcy risk.
For investors seeking growth and improving profitability, Dominion Energy’s favorable income growth and stable rating might appear attractive, whereas those prioritizing higher return on equity and recent operational improvements might see Edison International’s profile as more compelling. Risk-averse investors may note both companies’ value destruction signals and weigh these cautiously according to their investment horizon and risk tolerance.
Disclaimer: Investment carries a risk of loss of initial capital. The past performance is not a reliable indicator of future results. Be sure to understand risks before making an investment decision.
Go Further
I encourage you to read the complete analyses of Dominion Energy, Inc. and Edison International to enhance your investment decisions: