In the evolving energy sector, Duke Energy Corporation (DUK) and Dominion Energy, Inc. (D) stand out as two major regulated electric utilities in the United States. Both companies serve millions of customers with a blend of traditional and renewable energy assets, reflecting their commitment to innovation and sustainability. This comparison will help investors understand which company aligns better with their portfolio goals in a dynamic market. Let’s explore which one offers the most compelling investment opportunity.
Table of contents
Companies Overview
I will begin the comparison between Duke Energy Corporation and Dominion Energy, Inc. by providing an overview of these two companies and their main differences.
Duke Energy Corporation Overview
Duke Energy Corporation operates as a diversified energy company in the U.S., serving about 8.2M customers across six states primarily in the Southeast and Midwest. Its business encompasses electric utilities and infrastructure, gas utilities, and commercial renewables. Duke owns roughly 50,259 MW of generation capacity from coal, hydro, natural gas, oil, renewables, and nuclear sources, with a substantial presence in wind, solar, and battery storage projects.
Dominion Energy, Inc. Overview
Dominion Energy, Inc. produces and distributes energy in the U.S. through four segments covering regulated electricity and gas distribution mainly in Virginia, North Carolina, South Carolina, and other states. It serves millions of customers with a portfolio including 30.2 GW electric capacity, extensive transmission and distribution lines, and nonregulated renewable assets. Dominion also operates gas transportation, LNG import, and storage facilities, emphasizing integrated energy services.
Key similarities and differences
Both companies are major regulated electric utilities in the U.S., with diversified operations spanning electricity generation and natural gas distribution. Duke has a larger customer base and generation capacity, with a notable emphasis on commercial renewables including wind and solar projects. Dominion’s footprint is concentrated in the mid-Atlantic and southeastern states, combining regulated electricity and gas segments with nonregulated renewable and LNG infrastructure, reflecting a broader asset mix.
Income Statement Comparison
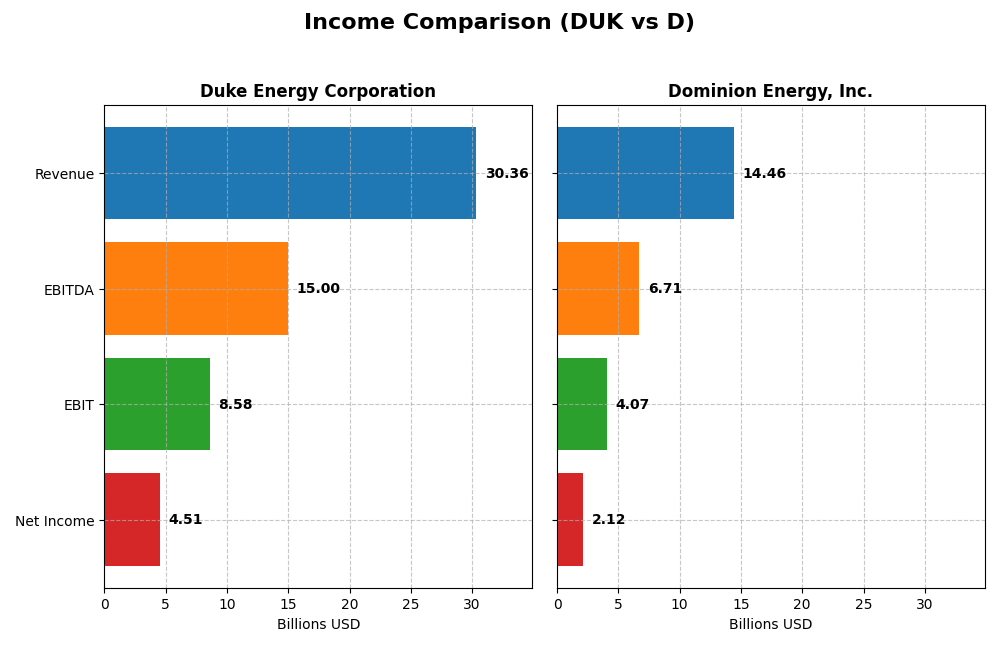
The table below presents the key income statement metrics for the fiscal year 2024 of Duke Energy Corporation and Dominion Energy, Inc., offering a side-by-side financial comparison.
| Metric | Duke Energy Corporation | Dominion Energy, Inc. |
|---|---|---|
| Market Cap | 90.8B | 49.5B |
| Revenue | 30.4B | 14.5B |
| EBITDA | 15.0B | 6.7B |
| EBIT | 8.6B | 4.1B |
| Net Income | 4.5B | 2.1B |
| EPS | 5.71 | 2.44 |
| Fiscal Year | 2024 | 2024 |
Income Statement Interpretations
Duke Energy Corporation
Duke Energy’s revenue increased steadily from $23.4B in 2020 to $30.4B in 2024, with net income rising sharply from $1.38B to $4.51B. Gross and EBIT margins remained favorable and stable around 50% and 28% respectively, while net margin improved to 14.86% in 2024. The latest year showed moderate revenue growth of 4.46% with strong profitability enhancements and a 5.16% EPS growth.
Dominion Energy, Inc.
Dominion Energy’s revenue showed modest growth, rising from $14.2B in 2020 to $14.5B in 2024, while net income improved significantly from a loss of $401M to a gain of $2.12B. Margins were consistently favorable, with gross margin near 47.9% and EBIT margin around 28.1%. However, revenue growth slowed to 0.46% in 2024, accompanied by a slight decline in gross profit but gains in net margin and EPS.
Which one has the stronger fundamentals?
Both companies demonstrate favorable income statement fundamentals with solid margins and growing net income. Duke Energy exhibits stronger revenue growth overall and higher gross margin, but with somewhat higher interest expenses. Dominion shows notable net income and margin improvements despite sluggish revenue growth and higher interest costs. Duke’s broader growth contrasts with Dominion’s margin resilience, reflecting differing fundamental strengths.
Financial Ratios Comparison
Below is a comparison of key financial ratios for Duke Energy Corporation (DUK) and Dominion Energy, Inc. (D) based on their latest full fiscal year data from 2024.
| Ratios | Duke Energy Corporation (DUK) | Dominion Energy, Inc. (D) |
|---|---|---|
| ROE | 8.997% | 7.794% |
| ROIC | 4.02% | 2.86% |
| P/E | 18.44 | 21.28 |
| P/B | 1.66 | 1.66 |
| Current Ratio | 0.67 | 0.71 |
| Quick Ratio | 0.44 | 0.52 |
| D/E | 1.70 | 1.53 |
| Debt-to-Assets | 45.7% | 40.8% |
| Interest Coverage | 2.34 | 1.72 |
| Asset Turnover | 0.16 | 0.14 |
| Fixed Asset Turnover | 0.24 | 0.21 |
| Payout ratio | 71.2% | 105.4% |
| Dividend yield | 3.86% | 4.95% |
Interpretation of the Ratios
Duke Energy Corporation
Duke Energy shows a mixed financial profile with a favorable net margin of 14.86% and dividend yield of 3.86%, but it faces challenges with an unfavorable return on equity at 9.0% and a low current ratio of 0.67, indicating liquidity concerns. The company maintains dividends, but payout sustainability should be monitored given the weak free cash flow yield.
Dominion Energy, Inc.
Dominion Energy posts a favorable net margin near 14.7% and a higher dividend yield of 4.95%, though it grapples with a lower return on equity of 7.79% and a current ratio of 0.71, signaling liquidity constraints. The firm pays dividends supported by stable earnings, but free cash flow yield remains negative, suggesting caution on distribution sustainability.
Which one has the best ratios?
Both companies exhibit similar strengths in profitability and dividend yield, yet face unfavorable returns on equity and liquidity ratios. Duke Energy holds a slightly better return on invested capital, while Dominion Energy offers a higher dividend yield. Overall, neither company demonstrates a definitively superior ratio profile, as both present slightly unfavorable global ratio evaluations.
Strategic Positioning
This section compares the strategic positioning of Duke Energy Corporation and Dominion Energy, Inc. regarding market position, key segments, and exposure to technological disruption:
Duke Energy Corporation
- Large market cap at 90.8B with moderate beta of 0.49; faces typical regulated electric utility competition.
- Diversified segments: Electric Utilities, Gas Utilities, and Commercial Renewables driving revenue.
- Exposure to renewables through Commercial Renewables segment with wind, solar, and battery facilities across 22 states.
Dominion Energy, Inc.
- Market cap at 49.5B with beta 0.70; operates in regulated electric utilities under competitive pressure.
- Concentrated in four segments: Virginia and South Carolina electric utilities, Gas Distribution, and Contracted Assets.
- Operates contracted renewable energy and LNG facilities, indicating some exposure to energy transition technologies.
Duke Energy Corporation vs Dominion Energy, Inc. Positioning
Duke Energy uses a diversified business model spanning electricity, gas, and renewables, offering broad revenue streams but potential complexity. Dominion Energy focuses on regional electric and gas utilities plus contracted renewable assets, which may concentrate operational risks but simplify management.
Which has the best competitive advantage?
Both companies show slightly unfavorable MOAT evaluations due to ROIC below WACC but with growing profitability trends. Duke’s larger scale and diversified segments contrast with Dominion’s regional focus, yet neither currently demonstrates a strong economic moat based on the provided ROIC data.
Stock Comparison
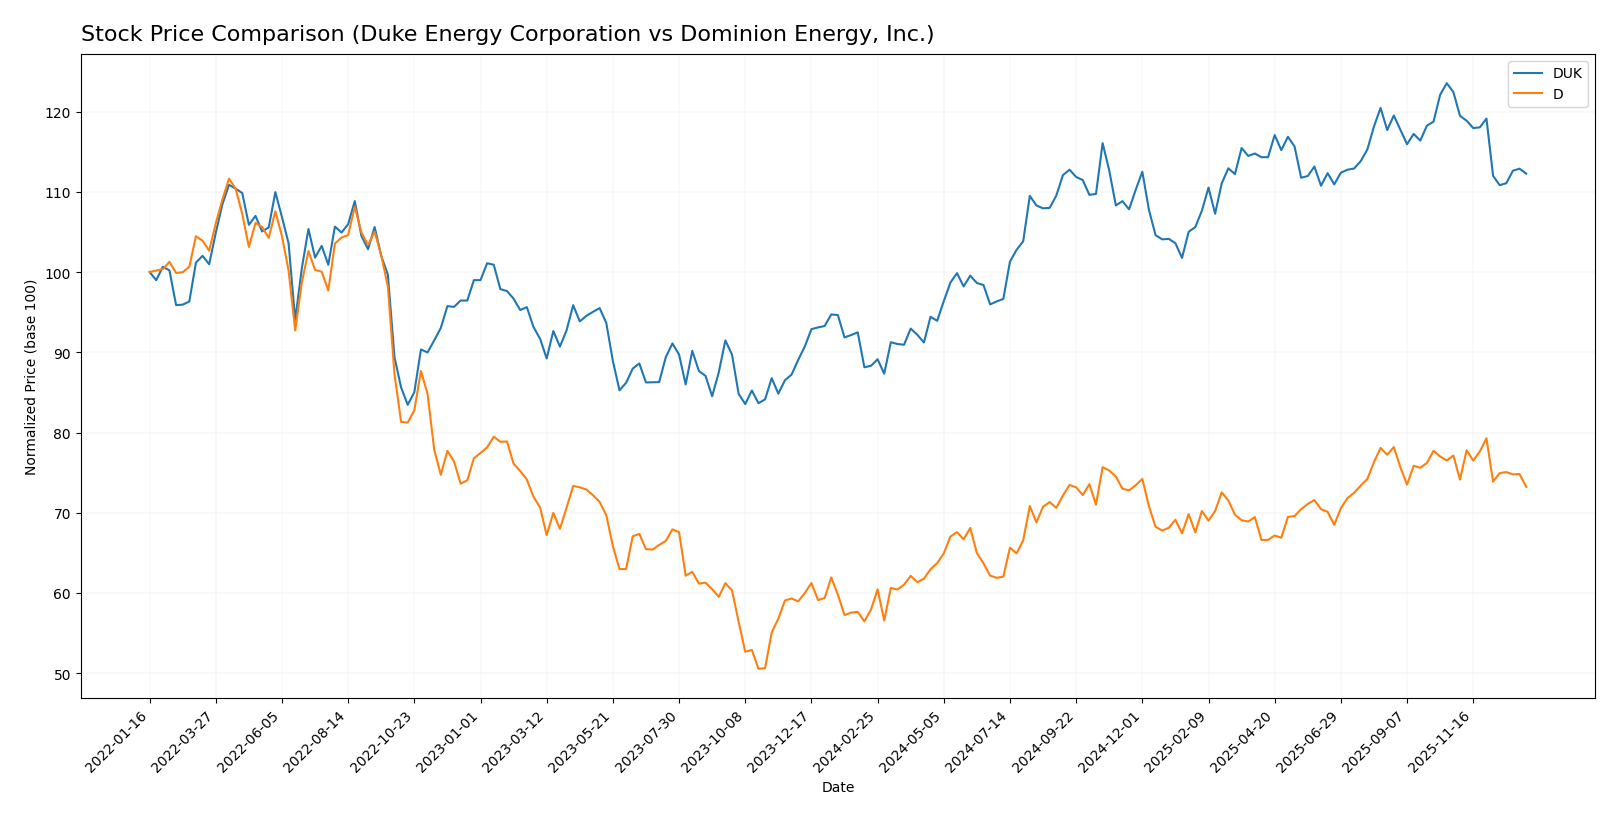
The stock prices of Duke Energy Corporation (DUK) and Dominion Energy, Inc. (D) have shown significant bullish trends over the past 12 months, with both stocks experiencing deceleration in their upward momentum and recent downward adjustments in the last quarter.
Trend Analysis
Duke Energy Corporation’s stock price increased by 27.12% over the past year, indicating a bullish trend with deceleration in momentum. The price ranged from a low of 90.86 to a high of 128.53, with recent weeks showing a negative shift of -8.3%.
Dominion Energy’s stock price rose by 26.43% over the same period, also displaying a bullish trend with deceleration. Its price fluctuated between 44.79 and 62.77, with a smaller recent decline of -5.04%.
Comparing the two, Duke Energy delivered a slightly higher overall market performance with a 27.12% increase versus Dominion Energy’s 26.43%, despite both showing recent downward trends.
Target Prices
The current analyst consensus for Duke Energy Corporation and Dominion Energy, Inc. reflects moderate upside potential.
| Company | Target High | Target Low | Consensus |
|---|---|---|---|
| Duke Energy Corporation | 150 | 126 | 135.91 |
| Dominion Energy, Inc. | 70 | 63 | 66 |
Analysts expect Duke Energy’s price to rise from $116.8 to around $136, indicating a cautious but positive outlook. Dominion Energy’s consensus target of $66 also suggests moderate growth potential above its current $57.98 stock price.
Analyst Opinions Comparison
This section compares analysts’ ratings and grades for Duke Energy Corporation and Dominion Energy, Inc.:
Rating Comparison
DUK Rating
- Rating: C+, considered Very Favorable
- Discounted Cash Flow Score: 1, Very Unfavorable
- ROE Score: 3, Moderate
- ROA Score: 3, Moderate
- Debt To Equity Score: 2, Moderate
- Overall Score: 2, Moderate
D Rating
- Rating: C+, considered Very Favorable
- Discounted Cash Flow Score: 4, Favorable
- ROE Score: 3, Moderate
- ROA Score: 1, Very Unfavorable
- Debt To Equity Score: 3, Moderate
- Overall Score: 2, Moderate
Which one is the best rated?
Both companies share the same overall rating of C+ and moderate overall scores. Duke has better ROA and lower debt-to-equity scores, while Dominion scores higher on discounted cash flow but worse on ROA. The ratings reflect different strengths and weaknesses.
Scores Comparison
Here is a comparison of the financial health scores for Duke Energy Corporation and Dominion Energy, Inc.:
Duke Energy Corporation Scores
- Altman Z-Score: 0.71, indicating financial distress.
- Piotroski Score: 6, reflecting average financial strength.
Dominion Energy, Inc. Scores
- Altman Z-Score: Unavailable for this company.
- Piotroski Score: 7, indicating strong financial health.
Which company has the best scores?
Dominion Energy shows stronger financial health with a Piotroski Score of 7, compared to Duke Energy’s average score of 6. Duke’s Altman Z-Score signals financial distress, while Dominion’s Altman Z-Score is not available.
Grades Comparison
The following sections present the latest grades issued by recognized financial institutions for Duke Energy Corporation and Dominion Energy, Inc.:
Duke Energy Corporation Grades
This table shows recent grades and rating actions from reputable grading companies for Duke Energy Corporation:
| Grading Company | Action | New Grade | Date |
|---|---|---|---|
| UBS | Maintain | Neutral | 2025-12-17 |
| JP Morgan | Maintain | Neutral | 2025-12-11 |
| Mizuho | Maintain | Outperform | 2025-10-27 |
| Morgan Stanley | Maintain | Equal Weight | 2025-10-22 |
| Barclays | Maintain | Overweight | 2025-10-14 |
| UBS | Maintain | Neutral | 2025-10-10 |
| BMO Capital | Maintain | Outperform | 2025-10-10 |
| Scotiabank | Upgrade | Sector Outperform | 2025-10-03 |
| Jefferies | Downgrade | Hold | 2025-09-26 |
| Morgan Stanley | Maintain | Equal Weight | 2025-09-25 |
Duke Energy’s grades mostly range from Neutral to Outperform, with a recent upgrade and one downgrade, indicating a generally stable to slightly positive outlook.
Dominion Energy, Inc. Grades
The following table summarizes the recent grades and rating actions from verified grading companies for Dominion Energy, Inc.:
| Grading Company | Action | New Grade | Date |
|---|---|---|---|
| Barclays | Maintain | Overweight | 2025-12-17 |
| JP Morgan | Maintain | Underweight | 2025-12-11 |
| BMO Capital | Maintain | Market Perform | 2025-11-03 |
| Morgan Stanley | Maintain | Equal Weight | 2025-10-22 |
| Barclays | Maintain | Overweight | 2025-10-07 |
| Morgan Stanley | Maintain | Equal Weight | 2025-09-25 |
| JP Morgan | Maintain | Underweight | 2025-08-21 |
| JP Morgan | Maintain | Underweight | 2025-07-15 |
| Morgan Stanley | Maintain | Equal Weight | 2025-06-18 |
| Morgan Stanley | Maintain | Equal Weight | 2025-05-22 |
Dominion Energy’s ratings fluctuate between Underweight and Overweight, with multiple Maintain actions, reflecting a mixed but cautious sentiment.
Which company has the best grades?
Duke Energy Corporation generally receives more favorable grades, including Outperform and Overweight ratings, compared to Dominion Energy’s mixed Underweight and Equal Weight grades. This suggests that Duke Energy is viewed with a slightly more optimistic outlook by analysts, which could influence investor sentiment regarding potential returns and risk profiles.
Strengths and Weaknesses
Below is a comparison table highlighting the key strengths and weaknesses of Duke Energy Corporation (DUK) and Dominion Energy, Inc. (D) based on the most recent data available:
| Criterion | Duke Energy Corporation (DUK) | Dominion Energy, Inc. (D) |
|---|---|---|
| Diversification | Moderate: Primarily Electric Utilities and Gas Utilities, with some Commercial Renewables (~$26.8B electric, $2.3B gas in 2024) | Moderate: Focused on Dominion Energy Virginia and South Carolina, plus Contracted Energy (~$10.2B Virginia, $3.3B South Carolina in 2024) |
| Profitability | Slightly unfavorable economic moat; ROIC (4.02%) below WACC (4.8%), but profitability improving; net margin 14.86% | Slightly unfavorable economic moat; ROIC (2.86%) below WACC (5.34%), but ROIC growing; net margin 14.69% |
| Innovation | Limited visible innovation; small Commercial Renewables segment (~$476M) | Limited visible innovation; no distinct renewables segment reported |
| Global presence | Primarily US-based operations with no significant international exposure | Primarily US-based operations, concentrated in Virginia and South Carolina |
| Market Share | Large market share in electric utilities in its regions | Strong regional presence, especially in Virginia |
Key takeaways: Both companies show slightly unfavorable economic moats as their returns on invested capital remain below their costs of capital, though both have improving ROIC trends. Duke Energy has a marginally larger electric utilities base and modest renewable operations, while Dominion Energy maintains strong regional market shares. Investors should monitor profitability trends and balance sheet health carefully given the leverage and liquidity concerns.
Risk Analysis
Below is a comparative risk assessment for Duke Energy Corporation (DUK) and Dominion Energy, Inc. (D) based on the most recent financial and operational data from 2024.
| Metric | Duke Energy Corporation (DUK) | Dominion Energy, Inc. (D) |
|---|---|---|
| Market Risk | Low beta (0.49) suggests lower volatility relative to the market | Moderate beta (0.699) indicates moderate market volatility |
| Debt level | High debt-to-equity (1.7, unfavorable) and 45.74% debt-to-assets (neutral) | High debt-to-equity (1.53, unfavorable) and 40.77% debt-to-assets (neutral) |
| Regulatory Risk | Significant due to regulated utility operations in multiple states | Similar regulatory exposure across several states |
| Operational Risk | Diversified generation mix including coal, gas, nuclear, and renewables; operational complexity | Large asset base with gas distribution and electric generation; operational integration risk |
| Environmental Risk | Exposure from coal and natural gas use; growing renewables segment mitigates | Exposure from fossil fuel operations; ongoing renewable investments |
| Geopolitical Risk | Primarily domestic US operations, limited geopolitical risk | Primarily domestic US operations, limited geopolitical risk |
The most impactful risks for both companies are their high debt levels combined with regulatory pressures common in the utility sector. Duke’s lower beta suggests it is less sensitive to market swings, but its Altman Z-Score in the distress zone signals financial vulnerability. Dominion shows strong Piotroski scores but faces operational risks tied to its gas distribution network. Investors should carefully monitor debt management and regulatory developments in these utilities.
Which Stock to Choose?
Duke Energy Corporation (DUK) has shown a favorable income evolution with strong growth in net income and EPS over 2020-2024, supported by a solid gross and EBIT margin. Its financial ratios reveal mixed signals, with a slightly unfavorable global assessment due to moderate profitability and leverage concerns, despite a favorable dividend yield. The company’s debt level is moderately high, and its overall rating is very favorable (C+), though its Altman Z-score indicates financial distress risk.
Dominion Energy, Inc. (D) also presents favorable income statement metrics, especially in net income growth, although revenue growth remains weak. Financial ratios are similarly slightly unfavorable, with lower returns on capital and a high debt load, but it benefits from a favorable dividend yield. Its overall rating matches DUK’s (C+), with a stronger Piotroski score but lacking an available Altman Z-score for bankruptcy risk assessment.
For investors, the slight value destruction indicated by both companies’ ROIC versus WACC, paired with growing profitability and similar overall ratings, suggests that those with a growth-oriented profile might find appeal in either stock’s income trends. Conversely, risk-averse investors could interpret the financial distress signals and leverage levels as reasons to approach with caution or seek alternative options.
Disclaimer: Investment carries a risk of loss of initial capital. The past performance is not a reliable indicator of future results. Be sure to understand risks before making an investment decision.
Go Further
I encourage you to read the complete analyses of Duke Energy Corporation and Dominion Energy, Inc. to enhance your investment decisions: