Target Corporation and Dollar General Corporation are two leading players in the U.S. discount retail sector, each with distinct strategies and market footprints. Target focuses on a broad merchandise mix with an emphasis on in-store experience and digital integration, while Dollar General emphasizes convenience and value across a vast network of smaller stores. This comparison will help investors identify which company offers the most compelling opportunity for their portfolio in 2026.
Table of contents
Companies Overview
I will begin the comparison between Target Corporation and Dollar General Corporation by providing an overview of these two companies and their main differences.
Target Overview
Target Corporation operates as a general merchandise retailer in the US, offering a wide range of products such as food, apparel, electronics, and household essentials. The company also provides in-store amenities like Target Café and Starbucks. Headquartered in Minneapolis, Target runs about 2,000 stores and aims to deliver a broad shopping experience through both physical and digital channels.
Dollar General Overview
Dollar General Corporation is a discount retailer focused on consumable and seasonal products, apparel, and home goods across 18,190 stores in 47 US states. The company targets value-conscious consumers with a diverse product mix that includes food, health and beauty, pet supplies, and household items. Based in Goodlettsville, Tennessee, Dollar General emphasizes convenience and affordability.
Key similarities and differences
Both companies operate in the discount retail industry within the US, focusing on consumer defensive sectors with extensive store networks. Target offers a broader product assortment and in-store services, while Dollar General concentrates on consumables and everyday low prices across more locations. Target’s market cap is larger at $48.2B compared to Dollar General’s $32.8B, reflecting differences in scale and market positioning.
Income Statement Comparison
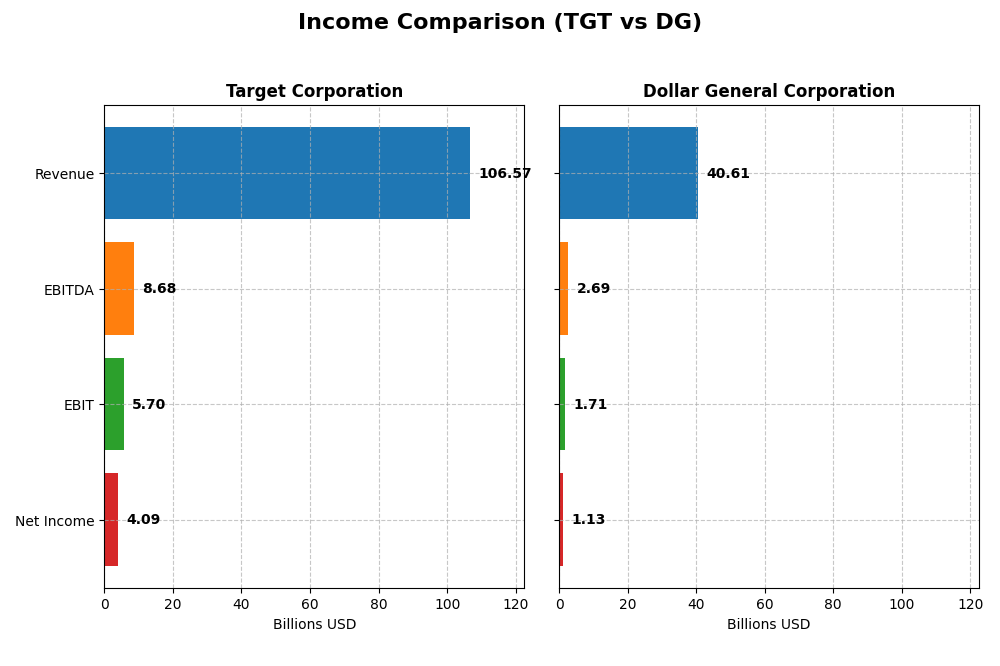
Below is a comparison of the most recent fiscal year income statement metrics for Target Corporation and Dollar General Corporation, providing a snapshot of their financial performance.
| Metric | Target Corporation (TGT) | Dollar General Corporation (DG) |
|---|---|---|
| Market Cap | 48.2B | 32.8B |
| Revenue | 106.6B | 40.6B |
| EBITDA | 8.68B | 2.69B |
| EBIT | 5.70B | 1.71B |
| Net Income | 4.09B | 1.13B |
| EPS | 8.89 | 5.12 |
| Fiscal Year | 2024 | 2024 |
Income Statement Interpretations
Target Corporation
Target’s revenue showed a modest overall growth of 13.9% from 2020 to 2024, despite a slight decline of 0.79% in the most recent year. Net income decreased by 6.34% over the period, with a net margin contraction of 17.77%. The 2024 fiscal year saw a decline in EBIT and EPS, signaling pressure on profitability and margin stability.
Dollar General Corporation
Dollar General recorded a favorable revenue growth of 20.34% over the five-year span, with a 4.96% increase in the latest year. However, net income plunged 57.62% overall, accompanied by a sharp net margin decline of 64.78%. The most recent year’s results indicated significant erosion in EBIT, net margin, and EPS, raising concerns about profitability despite top-line expansion.
Which one has the stronger fundamentals?
Both companies face unfavorable overall income statement evaluations, marked by declining net income and margins. Target demonstrates steadier revenue growth and better margin maintenance, whereas Dollar General’s sharper profitability declines overshadow its higher revenue growth. The balance of these factors suggests Target exhibits relatively stronger fundamentals, but both require cautious analysis given recent earnings pressures.
Financial Ratios Comparison
This table presents the most recent key financial ratios for Target Corporation and Dollar General Corporation, reflecting their performance for fiscal year 2024.
| Ratios | Target Corporation (TGT) | Dollar General Corporation (DG) |
|---|---|---|
| ROE | 27.9% | 15.2% |
| ROIC | 11.2% | 5.1% |
| P/E | 15.5 | 13.9 |
| P/B | 4.33 | 2.11 |
| Current Ratio | 0.94 | 1.19 |
| Quick Ratio | 0.32 | 0.21 |
| D/E (Debt-to-Equity) | 1.36 | 2.36 |
| Debt-to-Assets | 34.4% | 56.1% |
| Interest Coverage | 13.7 | 6.25 |
| Asset Turnover | 1.84 | 1.30 |
| Fixed Asset Turnover | 2.90 | 2.34 |
| Payout Ratio | 50.0% | 46.1% |
| Dividend Yield | 3.22% | 3.32% |
Interpretation of the Ratios
Target Corporation
Target shows a mixed ratio profile with strong returns on equity (27.89%) and invested capital (11.25%), and favorable interest coverage (13.86), indicating solid profitability and debt service capacity. However, liquidity ratios are weak (current ratio 0.94, quick ratio 0.32), and its price-to-book ratio is high at 4.33, raising valuation concerns. The company pays a dividend with a 3.22% yield, supported by stable payouts and free cash flow coverage, though debt levels warrant caution.
Dollar General Corporation
Dollar General presents a balanced ratio set with favorable return on equity (15.18%) and price-to-earnings ratio (13.89), reflecting efficient capital use and reasonable valuation. Liquidity is moderate (current ratio 1.19 neutral), but leverage is high (debt-to-equity 2.36, debt-to-assets 56.09%), which could increase financial risk. The dividend yield stands at 3.32%, supported by consistent payouts despite negative free cash flow to equity, signaling potential reinvestment or debt financing.
Which one has the best ratios?
Both companies have a slightly favorable global ratios opinion with 42.86% favorable metrics. Target exhibits stronger profitability and coverage ratios but weaker liquidity and valuation metrics. Dollar General has better valuation and reasonable liquidity but higher leverage and weaker returns on invested capital. The decision depends on prioritizing profitability versus financial risk and valuation.
Strategic Positioning
This section compares the strategic positioning of Target Corporation and Dollar General Corporation, focusing on Market position, Key segments, and Exposure to technological disruption:
Target Corporation
- Operates ~2,000 stores with broad merchandise in discount retail, facing moderate competition.
- Diverse product segments including food, apparel, beauty, home décor, electronics, and credit card profit sharing.
- Exposure to retail tech and digital channels via Target.com; moderate disruption risk in discount retail.
Dollar General Corporation
- Operates 18,190 stores mainly in southern and midwestern US, targeting discount retail with competitive pressure.
- Focused on consumables, apparel, home products, and seasonal goods, emphasizing value retail.
- Less emphasis on digital channels; traditional discount retail model with limited technological disruption noted.
Target Corporation vs Dollar General Corporation Positioning
Target shows a diversified product portfolio and moderate store footprint, allowing multiple revenue streams. Dollar General has a concentrated focus on consumables and discount retail with a much larger store count but narrower product range.
Which has the best competitive advantage?
Target is creating value with ROIC above WACC despite a declining trend, indicating a slightly favorable moat. Dollar General is shedding value with ROIC below WACC and a sharper decline, reflecting a slightly unfavorable moat.
Stock Comparison
The stock price movements of Target Corporation and Dollar General Corporation over the past year reveal contrasting dynamics, with Target exhibiting a significant overall decline and Dollar General showing steady gains and recent strong momentum.

Trend Analysis
Target Corporation’s stock trend over the past 12 months shows a bearish trajectory with a -29.93% price decline, marked by acceleration and a high volatility level (std deviation 27.68). The stock reached a peak of 177.21 and a low of 85.53.
Dollar General Corporation’s stock trend is bullish over the same period, gaining 6.03% with accelerating momentum and notable volatility (std deviation 25.35). The stock’s range spans from a low of 68.44 to a high of 159.55.
Comparing the two, Dollar General delivered higher market performance with an overall positive trend, whereas Target experienced a substantial price drop despite recent recovery signs.
Target Prices
Analyst consensus target prices suggest moderate upside potential for both Target Corporation and Dollar General Corporation.
| Company | Target High | Target Low | Consensus |
|---|---|---|---|
| Target Corporation | 120 | 80 | 96.14 |
| Dollar General Corporation | 170 | 125 | 140.06 |
Target Corporation’s consensus target of 96.14 is below its current price of 106.15, indicating limited upside or slight overvaluation. Dollar General’s consensus target of 140.06 is below its current price of 148.86, suggesting the stock may be trading above analyst expectations.
Analyst Opinions Comparison
This section compares analysts’ ratings and grades for Target Corporation and Dollar General Corporation:
Rating Comparison
Target Corporation Rating
- Rating: B+, indicating a very favorable overall assessment.
- Discounted Cash Flow Score: 4, a favorable valuation metric.
- ROE Score: 5, very favorable efficiency in generating equity returns.
- ROA Score: 4, favorable asset utilization.
- Debt To Equity Score: 1, very unfavorable due to high leverage.
- Overall Score: 3, a moderate overall financial standing.
Dollar General Corporation Rating
- Rating: B, also indicating a very favorable overall assessment.
- Discounted Cash Flow Score: 4, a favorable valuation metric.
- ROE Score: 4, favorable but lower than Target’s.
- ROA Score: 3, moderate asset utilization.
- Debt To Equity Score: 1, similarly very unfavorable leverage.
- Overall Score: 3, a moderate overall financial standing.
Which one is the best rated?
Based strictly on the provided data, Target holds a slightly better rating (B+) than Dollar General (B), supported by higher ROE and ROA scores, though both share the same moderate overall and debt-to-equity scores.
Scores Comparison
Here is a comparison of the financial scores for Target Corporation and Dollar General Corporation:
Target Corporation Scores
- Altman Z-Score: 2.89, placing Target in the grey zone with moderate bankruptcy risk.
- Piotroski Score: 7, indicating strong financial strength and good investment potential.
Dollar General Corporation Scores
- Altman Z-Score: 2.55, placing Dollar General in the grey zone with moderate bankruptcy risk.
- Piotroski Score: 8, indicating very strong financial strength and excellent investment potential.
Which company has the best scores?
Dollar General has a slightly lower Altman Z-Score but both are in the grey zone, indicating moderate risk. Its Piotroski Score of 8 surpasses Target’s 7, suggesting stronger financial health based on the provided data.
Grades Comparison
Here is an overview of the recent grades provided by reputable grading companies for both Target Corporation and Dollar General Corporation:
Target Corporation Grades
The following table summarizes the latest grades assigned to Target Corporation by recognized grading firms:
| Grading Company | Action | New Grade | Date |
|---|---|---|---|
| Wolfe Research | Maintain | Underperform | 2025-12-30 |
| Evercore ISI Group | Maintain | In Line | 2025-12-09 |
| Argus Research | Maintain | Buy | 2025-12-01 |
| Bernstein | Maintain | Underperform | 2025-11-20 |
| Evercore ISI Group | Maintain | In Line | 2025-11-20 |
| Roth Capital | Maintain | Neutral | 2025-11-20 |
| B of A Securities | Maintain | Underperform | 2025-11-20 |
| Mizuho | Maintain | Neutral | 2025-11-20 |
| Piper Sandler | Maintain | Neutral | 2025-11-20 |
| Citigroup | Maintain | Neutral | 2025-11-20 |
Grades for Target Corporation indicate a mixed to cautious stance, with several firms maintaining underperform or neutral ratings alongside a few buy recommendations.
Dollar General Corporation Grades
Below are the recent grades issued for Dollar General Corporation by credible grading companies:
| Grading Company | Action | New Grade | Date |
|---|---|---|---|
| Barclays | Maintain | Overweight | 2026-01-08 |
| Bernstein | Maintain | Outperform | 2026-01-05 |
| Evercore ISI Group | Maintain | In Line | 2025-12-23 |
| Wells Fargo | Maintain | Equal Weight | 2025-12-19 |
| JP Morgan | Upgrade | Overweight | 2025-12-15 |
| Guggenheim | Maintain | Buy | 2025-12-08 |
| Citigroup | Maintain | Neutral | 2025-12-08 |
| Jefferies | Maintain | Buy | 2025-12-05 |
| Morgan Stanley | Maintain | Equal Weight | 2025-12-05 |
| Evercore ISI Group | Maintain | In Line | 2025-12-05 |
Dollar General’s grades predominantly reflect positive momentum with multiple overweight and buy ratings, including an upgrade from JP Morgan.
Which company has the best grades?
Dollar General has received generally more favorable grades compared to Target, with multiple buy and overweight ratings versus Target’s more neutral to underperform consensus. This could indicate stronger analyst confidence in Dollar General’s near-term performance, potentially influencing investor sentiment towards greater optimism for Dollar General.
Strengths and Weaknesses
Below is a comparative overview of the key strengths and weaknesses of Target Corporation (TGT) and Dollar General Corporation (DG) based on the most recent financial and operational data.
| Criterion | Target Corporation (TGT) | Dollar General Corporation (DG) |
|---|---|---|
| Diversification | Highly diversified product segments including Apparel, Beauty, Food & Beverage, Home Furnishings, and Advertising Revenue, providing resilience. | Less diversified, focused mainly on Consumables and Seasonal products with smaller Apparel and Home Products segments. |
| Profitability | ROIC at 11.25% with ROE at 27.89%, but net margin low at 3.84% and declining ROIC trend; overall slightly favorable. | ROIC at 5.1% with ROE at 15.18%; net margin lower at 2.77% and declining ROIC trend; slightly unfavorable moat status. |
| Innovation | Moderate innovation evidenced by steady advertising revenue and credit card profit sharing; however, ROIC trend declining. | Limited innovation signals; focus remains on low-cost product offerings, with declining profitability trend. |
| Global presence | Primarily US-focused with strong national footprint; no significant global operations noted. | Mainly US-based discount retailer with no notable global presence. |
| Market Share | Significant player in general merchandise with broad product assortment, supporting a strong market share in its segment. | Strong position in discount retail segment, especially in rural and suburban areas, but smaller market coverage than Target. |
Key takeaways: Target shows stronger diversification and higher profitability metrics despite a declining ROIC trend, indicating some caution. Dollar General has a narrower product focus and weaker profitability trends, signaling higher risk despite stable market niche presence. Both companies require careful consideration of declining profitability trends before investment.
Risk Analysis
Below is a comparative table highlighting key risks for Target Corporation (TGT) and Dollar General Corporation (DG) based on their latest financial and market data from 2024–2026.
| Metric | Target Corporation (TGT) | Dollar General Corporation (DG) |
|---|---|---|
| Market Risk | Beta 1.12, moderate volatility due to retail competition and economic cycles | Beta 0.26, lower volatility but sensitive to regional economic shifts |
| Debt Level | Debt-to-Equity 1.36 (unfavorable), Interest coverage 13.86 (favorable) | Debt-to-Equity 2.36 (unfavorable), Interest coverage 6.25 (favorable but tighter) |
| Regulatory Risk | Moderate, retail industry regulations and labor laws in the US | Moderate, similar regulatory environment with focus on discount retail compliance |
| Operational Risk | Large store network (~2,000 stores) creates complexity but diversified | Extensive footprint (18,190 stores), operational scalability and supply chain risks |
| Environmental Risk | Growing focus on sustainability; potential cost pressures for greener operations | Similar environmental scrutiny, emphasis on supply chain sustainability |
| Geopolitical Risk | Primarily US-based, limited direct exposure | Primarily US-based, limited direct exposure |
In synthesis, both companies face moderate market and regulatory risks typical of the discount retail sector. Dollar General carries higher debt levels relative to assets, increasing financial risk despite strong operational scale. Target’s higher beta signals greater sensitivity to market swings. Operational risks are significant for both due to their large store footprints, but Dollar General’s much larger store count amplifies this. Environmental pressures are rising industry-wide and should be monitored closely.
Which Stock to Choose?
Target Corporation (TGT) shows mixed income evolution with a slight revenue decline but favorable ROE (27.9%) and ROIC (11.3%) above WACC, suggesting value creation despite declining profitability. Its debt levels and liquidity ratios remain unfavorable, though its rating is very favorable (B+).
Dollar General Corporation (DG) posts moderate revenue growth but suffers from declining profitability and a low ROIC versus WACC, indicating value erosion. While it has favorable PE and dividend yield ratios, its high debt burden and neutral to unfavorable liquidity metrics weigh on its profile. Its rating is also very favorable (B).
Investors focused on quality and value creation might find Target’s stronger ROE and ROIC profile more aligned with their goals, while those with tolerance for higher leverage and seeking growth could view Dollar General’s recent bullish price trend and dividend yield as potentially attractive; both companies exhibit slightly favorable ratio evaluations amid unfavorable income trends.
Disclaimer: Investment carries a risk of loss of initial capital. The past performance is not a reliable indicator of future results. Be sure to understand risks before making an investment decision.
Go Further
I encourage you to read the complete analyses of Target Corporation and Dollar General Corporation to enhance your investment decisions: