Dollar General Corporation (DG) and Dollar Tree, Inc. (DLTR) are two leading players in the discount retail industry, serving millions of consumers across the United States. Both companies operate extensive store networks and focus on providing value through affordable everyday products, yet they differ in pricing strategies and market positioning. This comparison explores their business models and innovation approaches to help investors identify the most promising opportunity for their portfolio.
Table of contents
Companies Overview
I will begin the comparison between Dollar General Corporation and Dollar Tree, Inc. by providing an overview of these two companies and their main differences.
Dollar General Overview
Dollar General Corporation is a discount retailer focused on providing a wide range of merchandise across the southern, southwestern, Midwestern, and eastern United States. The company’s product offerings include consumables, seasonal items, home products, and apparel, catering to everyday needs. With over 18,000 stores in 47 states, Dollar General holds a strong market presence in the discount retail sector.
Dollar Tree Overview
Dollar Tree, Inc. operates discount variety stores through two segments: Dollar Tree and Family Dollar. Dollar Tree stores sell merchandise at a fixed price of $1.25, including consumables, variety goods, and seasonal products. The Family Dollar segment offers general merchandise, consumables, apparel, and electronics. The company runs more than 16,000 stores across the U.S. and Canada, making it a significant player in the discount retail market.
Key similarities and differences
Both Dollar General and Dollar Tree operate in the discount retail industry, offering consumables and various merchandise to cost-conscious consumers. However, Dollar General has a broader product range and a larger store footprint, while Dollar Tree emphasizes fixed-price offerings and operates two distinct store formats. Dollar General employs nearly three times more staff, reflecting its larger scale and operational complexity compared to Dollar Tree.
Income Statement Comparison
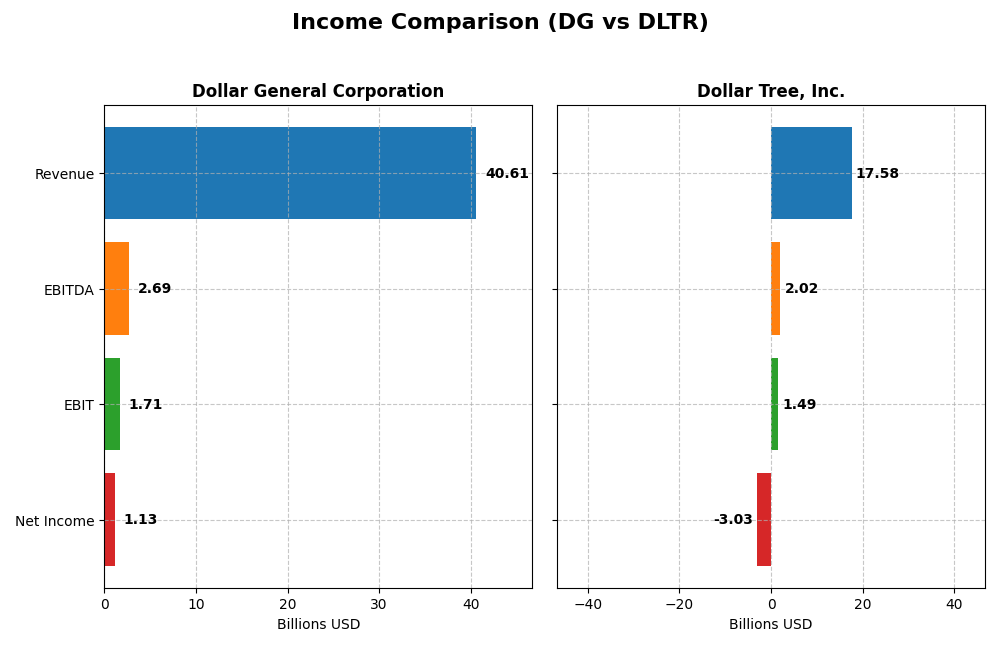
This table presents a side-by-side comparison of key income statement metrics for Dollar General Corporation and Dollar Tree, Inc. for the fiscal year 2024.
| Metric | Dollar General Corporation | Dollar Tree, Inc. |
|---|---|---|
| Market Cap | 32.8B | 28.8B |
| Revenue | 40.6B | 17.6B |
| EBITDA | 2.69B | 2.02B |
| EBIT | 1.71B | 1.49B |
| Net Income | 1.13B | -3.03B |
| EPS | 5.12 | -14.05 |
| Fiscal Year | 2024 | 2024 |
Income Statement Interpretations
Dollar General Corporation
Dollar General’s revenue increased steadily from $33.7B in 2020 to $40.6B in 2024, reflecting a favorable 20.34% growth over five years. However, net income declined significantly by 57.62% during the same period, indicating margin pressure. In 2024, revenue growth slowed to 4.96%, and net income dropped sharply by 32.32%, with operating expenses rising proportionally, signaling margin compression.
Dollar Tree, Inc.
Dollar Tree’s revenue declined by 31.09% from 2020 to 2024, falling from $25.5B to $17.6B, with a modest 4.75% growth in the latest year. Net income showed severe volatility, turning deeply negative in 2024 at -$3.0B, impacted by discontinued operations. Gross margins remained favorable at 35.81%, but net margins stayed negative and worsened, reflecting operational and profitability challenges.
Which one has the stronger fundamentals?
Both companies face unfavorable overall income statement evaluations, with Dollar General showing moderate revenue growth but declining net income and margins. Dollar Tree struggles with shrinking revenue and substantial net losses, primarily from discontinued operations. While Dollar General maintains positive net income, Dollar Tree’s losses and negative net margins weigh heavily on its fundamentals.
Financial Ratios Comparison
The table below presents a side-by-side comparison of key financial ratios for Dollar General Corporation (DG) and Dollar Tree, Inc. (DLTR) based on their most recent fiscal year data for 2024.
| Ratios | Dollar General Corporation (DG) | Dollar Tree, Inc. (DLTR) |
|---|---|---|
| ROE | 15.18% | -76.18% |
| ROIC | 5.10% | 9.17% |
| P/E | 13.89 | -5.22 |
| P/B | 2.11 | 3.98 |
| Current Ratio | 1.19 | 1.06 |
| Quick Ratio | 0.21 | 0.75 |
| D/E | 2.36 | 1.97 |
| Debt-to-Assets | 56.09% | 42.00% |
| Interest Coverage | 6.25 | 13.60 |
| Asset Turnover | 1.30 | 0.94 |
| Fixed Asset Turnover | 2.34 | 2.03 |
| Payout ratio | 46.12% | 0% |
| Dividend yield | 3.32% | 0% |
Interpretation of the Ratios
Dollar General Corporation
Dollar General shows a mix of strong and weak ratios with a slightly favorable overall assessment. Its return on equity is solid at 15.18%, supported by a favorable weighted average cost of capital at 4.29%. However, concerns arise with a high debt-to-assets ratio of 56.09% and a low quick ratio of 0.21. The company offers a 3.32% dividend yield, indicating consistent shareholder returns with a manageable payout supported by free cash flow.
Dollar Tree, Inc.
Dollar Tree’s financial ratios lean more toward unfavorable, reflected in a negative net margin of -17.24% and a steeply negative return on equity at -76.18%. While it maintains a favorable interest coverage ratio of 13.87, its price-to-book ratio at 3.98 and a quick ratio of 0.75 raise concerns. The company does not pay dividends, likely prioritizing reinvestment or managing losses, with no reported share buybacks.
Which one has the best ratios?
Comparing the two, Dollar General exhibits a stronger financial profile with more favorable ratios and dividend payments, indicating better profitability and shareholder returns. Dollar Tree’s ratios reflect operational and profitability challenges, with a greater proportion of unfavorable metrics and no dividend distribution, suggesting a riskier position relative to Dollar General.
Strategic Positioning
This section compares the strategic positioning of Dollar General Corporation (DG) and Dollar Tree, Inc. (DLTR) in terms of market position, key segments, and exposure to technological disruption:
Dollar General Corporation (DG)
- Leading discount retailer in southern and eastern US with strong market presence and low beta.
- Diverse product range includes consumables, apparel, home products, and seasonal items driving revenue.
- Exposure to disruption not explicitly stated; operates primarily in traditional brick-and-mortar retail.
Dollar Tree, Inc. (DLTR)
- Operates Dollar Tree and Family Dollar segments with moderate beta and significant market cap.
- Two main segments: fixed-price Dollar Tree and Family Dollar discount variety stores.
- No explicit mention of exposure to technological disruption; focuses on discount variety retail.
Dollar General Corporation vs Dollar Tree, Inc. Positioning
DG shows a diversified product portfolio spread across consumables, apparel, home, and seasonal goods, while DLTR focuses on two retail segments with fixed and variable pricing. DG’s broader merchandise scope contrasts with DLTR’s concentrated segment approach, reflecting different strategic focuses.
Which has the best competitive advantage?
Based on MOAT evaluation, DLTR demonstrates a very favorable competitive advantage with growing ROIC exceeding WACC, indicating durable profitability. DG shows a slightly unfavorable position with declining ROIC below WACC, suggesting weakening value creation.
Stock Comparison
The stock price movements of Dollar General Corporation (DG) and Dollar Tree, Inc. (DLTR) over the past 12 months reveal contrasting trends, with DG showing a bullish trajectory and DLTR exhibiting a bearish pattern despite recent recovery attempts.

Trend Analysis
Dollar General’s stock price increased by 6.03% over the past year, indicating a bullish trend with accelerating momentum. The price ranged from a low of 68.44 to a high of 159.55, supported by a notable recent surge of 50.88%.
Dollar Tree’s stock price declined by 5.92% in the same period, reflecting a bearish trend despite acceleration. Its price fluctuated between 61.41 and 148.44, with a recent recovery of 38.46% showing positive slope but insufficient to reverse the yearly downtrend.
Comparing both, Dollar General delivered the highest market performance with a positive 6.03% gain, while Dollar Tree’s overall decline of 5.92% marks a weaker yearly return.
Target Prices
Analysts present a clear target price consensus for Dollar General Corporation and Dollar Tree, Inc., reflecting cautious optimism.
| Company | Target High | Target Low | Consensus |
|---|---|---|---|
| Dollar General Corporation | 170 | 125 | 140.06 |
| Dollar Tree, Inc. | 150 | 75 | 125.33 |
The target consensus for Dollar General at 140.06 is slightly below its current price of 148.86, suggesting limited upside. Dollar Tree’s consensus of 125.33 is below its current price of 137.24, indicating some analyst caution despite recent gains.
Analyst Opinions Comparison
This section compares analysts’ ratings and grades for Dollar General Corporation and Dollar Tree, Inc.:
Rating Comparison
DG Rating
- Rated B, indicating a very favorable overall rating.
- Discounted Cash Flow Score is 4, reflecting a favorable assessment of future cash flows.
- Return on Equity Score is 4, showing favorable efficiency in generating profit from equity.
- Return on Assets Score is 3, representing a moderate ability to utilize assets effectively.
- Debt To Equity Score is 1, reflecting a very unfavorable financial risk due to high leverage.
- Overall Score is 3, a moderate summary of financial standing.
DLTR Rating
- Rated D+, indicating a very unfavorable overall rating.
- Discounted Cash Flow Score is 2, suggesting a moderate outlook on future cash flows.
- Return on Equity Score is 1, indicating very unfavorable efficiency in profit generation.
- Return on Assets Score is 1, showing very unfavorable asset utilization.
- Debt To Equity Score is 1, also indicating very unfavorable financial risk from leverage.
- Overall Score is 1, showing a very unfavorable summary of financial standing.
Which one is the best rated?
Based strictly on the provided data, Dollar General has a superior rating with a B grade and higher scores in discounted cash flow, ROE, ROA, and overall score. Dollar Tree shows very unfavorable ratings across most categories.
Scores Comparison
Here is a comparison of the Altman Z-Score and Piotroski Score for Dollar General Corporation (DG) and Dollar Tree, Inc. (DLTR):
DG Scores
- Altman Z-Score: 2.55, indicating moderate bankruptcy risk in the grey zone.
- Piotroski Score: 8, reflecting very strong financial health.
DLTR Scores
- Altman Z-Score: 3.49, indicating low bankruptcy risk in the safe zone.
- Piotroski Score: 4, reflecting average financial health.
Which company has the best scores?
Based on the provided scores, DLTR shows a stronger Altman Z-Score in the safe zone, while DG has a significantly higher Piotroski Score indicating stronger financial health. Each company excels in different score categories.
Grades Comparison
The following tables present the latest reliable grades for Dollar General Corporation and Dollar Tree, Inc.:
Dollar General Corporation Grades
This table summarizes recent grades and rating actions from reputable grading companies for Dollar General Corporation.
| Grading Company | Action | New Grade | Date |
|---|---|---|---|
| Barclays | Maintain | Overweight | 2026-01-08 |
| Bernstein | Maintain | Outperform | 2026-01-05 |
| Evercore ISI Group | Maintain | In Line | 2025-12-23 |
| Wells Fargo | Maintain | Equal Weight | 2025-12-19 |
| JP Morgan | Upgrade | Overweight | 2025-12-15 |
| Guggenheim | Maintain | Buy | 2025-12-08 |
| Citigroup | Maintain | Neutral | 2025-12-08 |
| Jefferies | Maintain | Buy | 2025-12-05 |
| Morgan Stanley | Maintain | Equal Weight | 2025-12-05 |
| Evercore ISI Group | Maintain | In Line | 2025-12-05 |
Overall, Dollar General’s grades predominantly indicate a positive outlook, with several buy and overweight ratings and a notable upgrade by JP Morgan.
Dollar Tree, Inc. Grades
This table displays recent grades and rating actions from established grading companies for Dollar Tree, Inc.
| Grading Company | Action | New Grade | Date |
|---|---|---|---|
| Barclays | Maintain | Overweight | 2026-01-08 |
| Bernstein | Maintain | Market Perform | 2026-01-05 |
| Wells Fargo | Maintain | Overweight | 2025-12-19 |
| Barclays | Maintain | Overweight | 2025-12-09 |
| Morgan Stanley | Maintain | Equal Weight | 2025-12-08 |
| Evercore ISI Group | Maintain | In Line | 2025-12-04 |
| Telsey Advisory Group | Maintain | Outperform | 2025-12-04 |
| B of A Securities | Maintain | Underperform | 2025-12-04 |
| Guggenheim | Maintain | Buy | 2025-12-04 |
| Wells Fargo | Maintain | Overweight | 2025-12-04 |
Dollar Tree’s grades show a mix of overweight and outperform ratings but also include an underperform rating, reflecting a more varied assessment.
Which company has the best grades?
Dollar General has received more consistent positive grades, including multiple buy and overweight ratings with an upgrade from JP Morgan, suggesting stronger analyst confidence. Dollar Tree, while also rated mostly positively, exhibits greater rating dispersion, including an underperform grade, indicating more mixed investor sentiment. This difference could impact investor confidence and portfolio risk perceptions.
Strengths and Weaknesses
Below is a comparison table highlighting the key strengths and weaknesses of Dollar General Corporation (DG) and Dollar Tree, Inc. (DLTR) based on the latest available data.
| Criterion | Dollar General (DG) | Dollar Tree (DLTR) |
|---|---|---|
| Diversification | Broad product mix with strong consumables focus (33.4B USD in 2024); multiple categories including apparel and home products | Primarily two segments: Dollar Tree and Family Dollar; less diversified product categories |
| Profitability | Moderate net margin (2.77%), favorable ROE (15.18%), slightly favorable overall financial ratios | Negative net margin (-17.24%), negative ROE (-76.18%), overall slightly unfavorable financial ratios |
| Innovation | Neutral ROIC (5.1%), declining ROIC trend indicating challenges in sustaining profitability | Neutral ROIC (9.17%), but growing ROIC trend reflecting improved operational efficiency |
| Global presence | Primarily US-focused with strong domestic footprint | Also US-focused; operates two well-known discount chains nationally |
| Market Share | Leading market share in discount retail segment with significant revenue scale (approx. 40B USD total) | Substantial market share but smaller total revenue (~31B USD combined Dollar Tree and Family Dollar) |
Key takeaways: Dollar General offers greater diversification and a solid domestic footprint with slightly favorable profitability metrics, though it faces declining returns on capital. Dollar Tree shows improving capital returns but struggles with profitability and financial stability, reflecting higher investment risks. Investors should weigh profitability trends and market positioning carefully when choosing between these retailers.
Risk Analysis
The following table summarizes key risks for Dollar General Corporation (DG) and Dollar Tree, Inc. (DLTR) based on the latest available data from 2024.
| Metric | Dollar General Corporation (DG) | Dollar Tree, Inc. (DLTR) |
|---|---|---|
| Market Risk | Low beta of 0.262, indicating lower volatility relative to the market | Moderate beta of 0.749, showing higher sensitivity to market swings |
| Debt level | High debt-to-equity ratio of 2.36 and debt-to-assets of 56.1% (unfavorable) | Elevated debt-to-equity ratio of 1.97, but moderate debt-to-assets at 42% (neutral) |
| Regulatory Risk | Moderate, typical retail regulatory environment in the US | Moderate, similar retail regulations with added complexity due to Canada operations |
| Operational Risk | Large scale with 194K employees and 18,190 stores, complexity manageable but sizable | Smaller scale with 64K employees and ~16,000 stores, operational risks from integration of Family Dollar segment |
| Environmental Risk | Standard retail sector exposure, no significant recent issues | Same as DG, with standard retail environmental compliance risks |
| Geopolitical Risk | Low, primarily US-focused operations | Moderate, exposure to US and Canadian markets with potential cross-border trade implications |
In summary, Dollar General’s most impactful risks stem from its high leverage and operational scale, while Dollar Tree faces more pronounced market sensitivity and weaker profitability metrics, despite safer bankruptcy risk levels. Monitoring debt levels and market conditions is essential for managing investment risk in both companies.
Which Stock to Choose?
Dollar General Corporation (DG) shows a mixed income evolution with a 20.34% revenue growth over 2020-2024 but a 57.62% net income decline. Its financial ratios are slightly favorable overall, with a strong ROE of 15.18% and a moderate debt level. Profitability remains challenged, and its rating is very favorable with a B grade.
Dollar Tree, Inc. (DLTR) presents an unfavorable income statement trend, marked by a 31.09% revenue decline and a significant net income drop of 325.81%. Its financial ratios lean slightly unfavorable, with negative ROE and net margin, yet it maintains a very favorable rating of D+. The company is creating value with a very favorable MOAT status.
For investors, Dollar General’s stable rating and moderate financial ratios might appear more suitable for those seeking quality and moderate risk, while Dollar Tree’s value creation and improving MOAT could be interpreted as appealing to more risk-tolerant or growth-focused investors. The choice could depend on individual risk appetite and investment strategy.
Disclaimer: Investment carries a risk of loss of initial capital. The past performance is not a reliable indicator of future results. Be sure to understand risks before making an investment decision.
Go Further
I encourage you to read the complete analyses of Dollar General Corporation and Dollar Tree, Inc. to enhance your investment decisions: