In the dynamic software application industry, Workday, Inc. and DocuSign, Inc. stand out as influential players revolutionizing enterprise solutions. Workday specializes in comprehensive cloud-based financial and human capital management, while DocuSign leads in digital agreement technologies with innovative e-signature and contract lifecycle management tools. Both companies target overlapping markets with a strong focus on innovation. This article will help you decide which of these promising stocks deserves a place in your investment portfolio.
Table of contents
Companies Overview
I will begin the comparison between Workday and DocuSign by providing an overview of these two companies and their main differences.
Workday Overview
Workday, Inc. specializes in enterprise cloud applications designed to help organizations manage business operations and financial processes. Its offerings include financial management, human capital management, planning, and analytics applications. Workday serves diverse sectors such as financial services, healthcare, education, and retail, positioning itself as a comprehensive cloud solutions provider with a market cap near $50B.
DocuSign Overview
DocuSign, Inc. focuses on electronic signature software and contract lifecycle management solutions worldwide. Its products automate agreement workflows and incorporate AI for insights and compliance, targeting enterprises and small businesses. DocuSign also offers industry-specific cloud solutions and compliance tools, with a market cap around $11B, emphasizing digital transaction management.
Key similarities and differences
Both Workday and DocuSign operate in the software application industry with cloud-based solutions targeting enterprise customers. While Workday’s model centers on broad business management including finance and HR, DocuSign specializes in digital signatures and agreement automation. Workday’s offerings cover multiple operational areas, whereas DocuSign focuses on streamlining contract processes and compliance. Their market caps and workforce sizes also differ significantly.
Income Statement Comparison
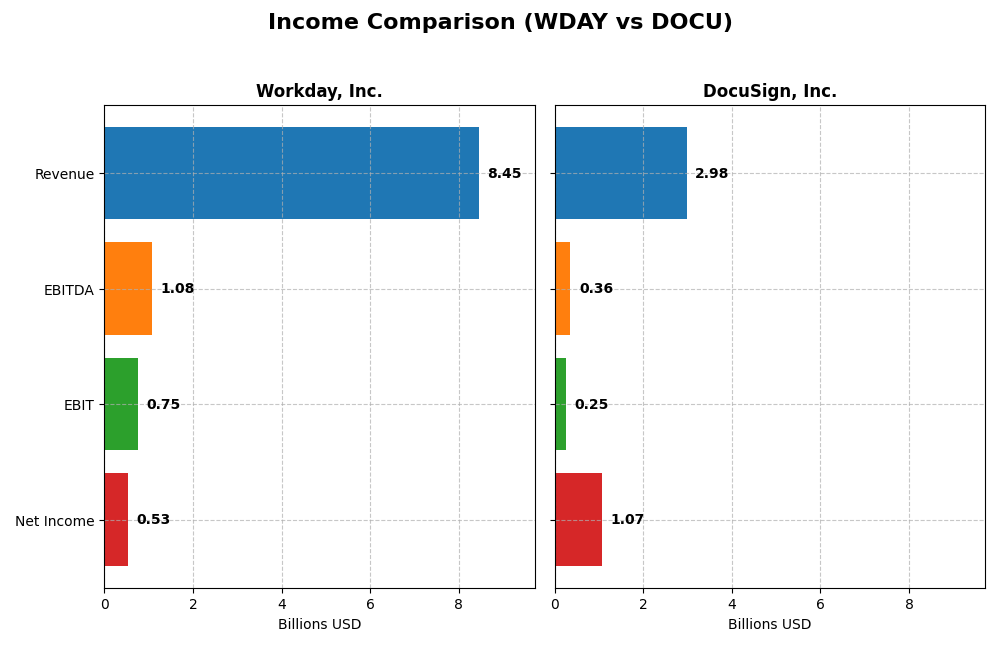
The table below presents a side-by-side comparison of key income statement metrics for Workday, Inc. and DocuSign, Inc. for the fiscal year 2025.
| Metric | Workday, Inc. (WDAY) | DocuSign, Inc. (DOCU) |
|---|---|---|
| Market Cap | 49.9B | 11.4B |
| Revenue | 8.45B | 3.0B |
| EBITDA | 1.08B | 357M |
| EBIT | 752M | 249M |
| Net Income | 526M | 1.07B |
| EPS | 1.98 | 5.23 |
| Fiscal Year | 2025 | 2025 |
Income Statement Interpretations
Workday, Inc.
Workday’s revenue increased steadily from $4.3B in 2021 to $8.4B in 2025, nearly doubling over five years. Net income showed volatility, including losses in 2021 and 2023 but rebounded to $526M in 2025. Gross margin remained strong at 75.5%, while net margin declined in the latest year. The 2025 performance shows revenue growth of 16.35% but a net margin drop of 67.26%.
DocuSign, Inc.
DocuSign’s revenue grew from $1.45B in 2021 to $3.0B in 2025, more than doubling in five years. Net income turned positive in 2024 and sharply increased to $1.07B in 2025. Gross margin was robust at 79.1%, with net margin at 35.9%. The latest year showed moderate revenue growth of 7.78% and strong net margin and EPS growth exceeding 1,200%, reflecting improving profitability.
Which one has the stronger fundamentals?
Both companies display favorable revenue growth and strong gross margins, yet DocuSign exhibits superior net margin stability and rapid net income expansion, highlighted by a 35.9% net margin in 2025 versus Workday’s 6.2%. Workday’s income statement reveals more volatility, particularly in net margin and EPS growth. Overall, DocuSign’s fundamentals appear more consistently favorable based on recent profitability metrics.
Financial Ratios Comparison
The table below compares key financial ratios for Workday, Inc. and DocuSign, Inc. based on their most recent fiscal year data (2025), providing a snapshot of their profitability, liquidity, leverage, and efficiency.
| Ratios | Workday, Inc. (WDAY) | DocuSign, Inc. (DOCU) |
|---|---|---|
| ROE | 5.82% | 53.32% |
| ROIC | 2.73% | 9.09% |
| P/E | 132.15 | 18.51 |
| P/B | 7.69 | 9.87 |
| Current Ratio | 1.85 | 0.81 |
| Quick Ratio | 1.85 | 0.81 |
| D/E (Debt to Equity) | 0.37 | 0.06 |
| Debt-to-Assets | 18.70% | 3.10% |
| Interest Coverage | 3.64 | 128.99 |
| Asset Turnover | 0.47 | 0.74 |
| Fixed Asset Turnover | 5.36 | 7.28 |
| Payout ratio | 0 | 0 |
| Dividend yield | 0 | 0 |
Interpretation of the Ratios
Workday, Inc.
Workday’s ratios present a mixed picture: while liquidity and leverage metrics such as current ratio (1.85) and debt-to-equity (0.37) are favorable, profitability ratios like return on equity (5.82%) and return on invested capital (2.73%) are unfavorable. Asset turnover is also weak at 0.47. The company does not pay dividends, likely reflecting a reinvestment strategy focused on growth and innovation rather than shareholder payouts.
DocuSign, Inc.
DocuSign shows strong profitability with a high net margin of 35.87% and return on equity at 53.32%, both favorable. Its leverage remains low with debt-to-assets at 3.1% and a solid interest coverage ratio of 160.96. However, liquidity ratios are less robust, with a current ratio of 0.81 marked unfavorable. DocuSign also does not pay dividends, possibly prioritizing growth and product development over distributions.
Which one has the best ratios?
DocuSign’s ratios are generally more favorable, particularly in profitability and debt management, while Workday demonstrates better liquidity but weaker returns on equity and invested capital. Both companies share a zero dividend yield, but DocuSign’s stronger earnings and interest coverage ratios suggest a more efficient capital structure, resulting in a slightly favorable overall ratio assessment compared to Workday’s neutral evaluation.
Strategic Positioning
This section compares the strategic positioning of Workday, Inc. and DocuSign, Inc. across Market position, Key segments, and Exposure to technological disruption:
Workday, Inc.
- Large market cap of 49.9B with diversified competitive pressure in enterprise cloud applications.
- Key segments include subscription services (~7.7B) and professional services (~728M) mainly in financial management and HCM.
- Exposure includes augmented analytics, machine learning, and cloud spend management, indicating moderate technological disruption.
DocuSign, Inc.
- Smaller market cap of 11.4B focused on digital signature software facing niche competitive pressure.
- Key segments comprise subscription and circulation (~2.9B) plus professional services (~75M) mainly in e-signature and contract lifecycle management.
- Uses AI-driven contract management, remote online notary, and advanced analytics, showing high exposure to tech innovation.
Workday, Inc. vs DocuSign, Inc. Positioning
Workday’s strategy is diversified across financial, HR, and analytics applications, serving broad industries. DocuSign concentrates on digital agreement solutions with AI enhancements, offering focused innovation but narrower market scope.
Which has the best competitive advantage?
DocuSign shows a slightly favorable moat with growing profitability but no strong competitive advantage yet. Workday is slightly unfavorable, destroying value despite increasing ROIC, indicating weaker current competitive advantage.
Stock Comparison
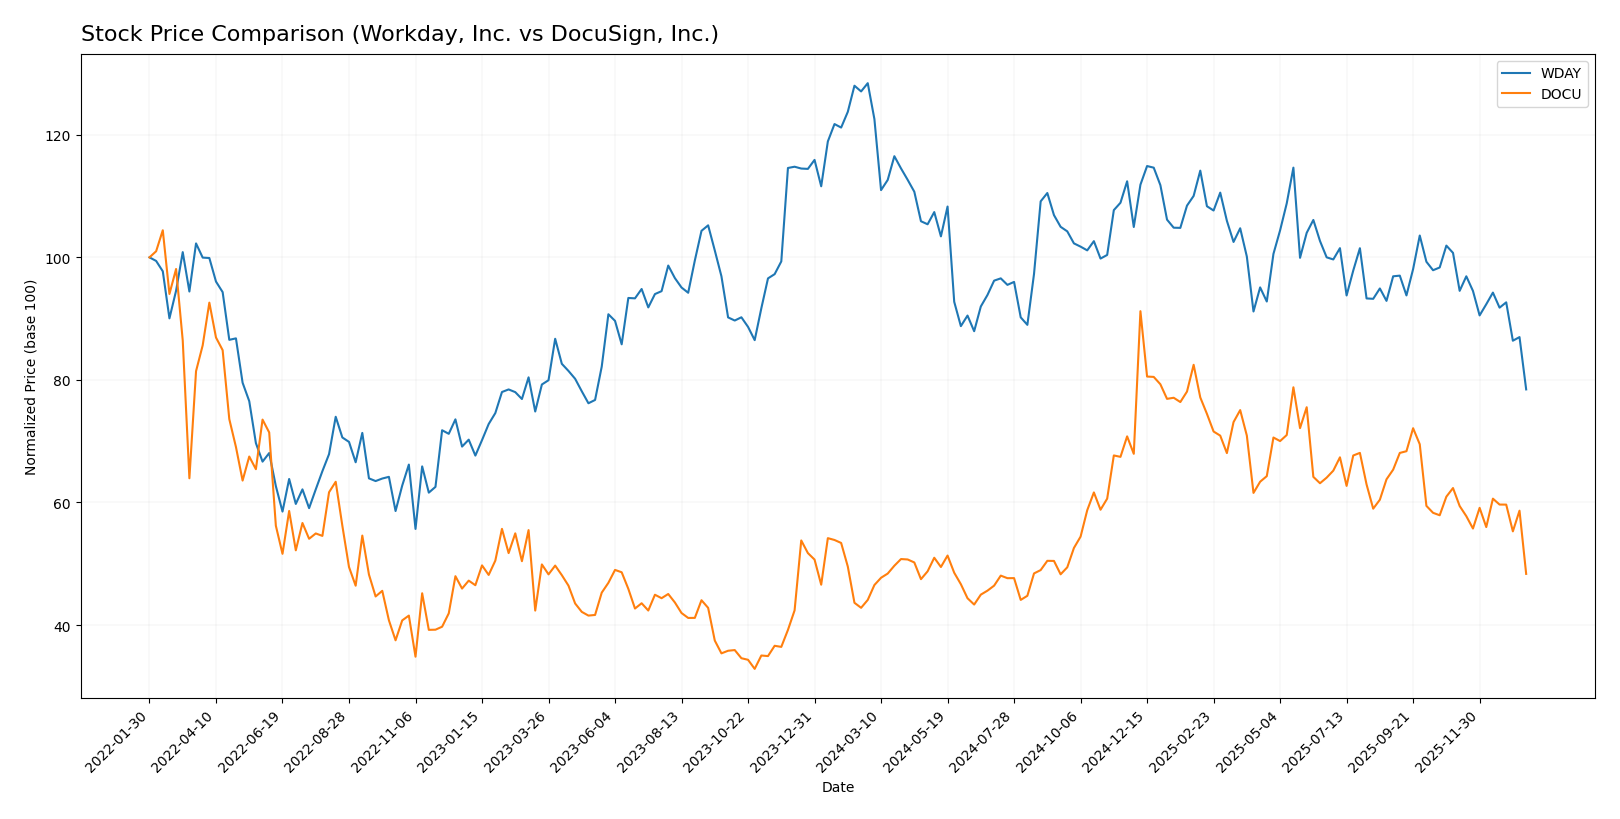
The stock prices of Workday, Inc. (WDAY) and DocuSign, Inc. (DOCU) over the past year reveal contrasting dynamics, with WDAY experiencing a significant decline while DOCU shows moderate gains, both facing recent weakening trends.
Trend Analysis
Workday, Inc. (WDAY) shows a bearish trend with a -38.91% price change over the past 12 months, marked by deceleration and high volatility (std deviation 20.22). The stock peaked at 305.88 and bottomed at 186.86.
DocuSign, Inc. (DOCU) experienced a bullish trend with a 9.63% gain over the same period, although the acceleration is slowing. Volatility is moderate (std deviation 12.98), with highs at 106.99 and lows at 50.84.
Comparing both, DOCU delivered the highest market performance with a positive annual return, while WDAY showed a steep decline and stronger recent selling pressure.
Target Prices
Analysts present a clear target price consensus for Workday, Inc. and DocuSign, Inc., reflecting moderate upside potential.
| Company | Target High | Target Low | Consensus |
|---|---|---|---|
| Workday, Inc. | 320 | 235 | 274.47 |
| DocuSign, Inc. | 88 | 70 | 76.86 |
For Workday, the consensus target price of 274.47 is significantly above the current price of 186.86, suggesting potential appreciation. DocuSign’s target consensus of 76.86 also indicates upside, compared to its current price near 56.71.
Analyst Opinions Comparison
This section compares the analysts’ ratings and financial scores for Workday, Inc. (WDAY) and DocuSign, Inc. (DOCU):
Rating Comparison
WDAY Rating
- Rating: B-, classified as Very Favorable
- Discounted Cash Flow Score: 4, indicating a Favorable valuation outlook
- ROE Score: 3, reflecting Moderate efficiency in generating profit from equity
- ROA Score: 3, a Moderate rating for asset utilization efficiency
- Debt To Equity Score: 2, Moderate financial risk with some reliance on debt
- Overall Score: 2, Moderate overall financial standing
DOCU Rating
- Rating: B+, classified as Very Favorable
- Discounted Cash Flow Score: 5, indicating a Very Favorable valuation outlook
- ROE Score: 4, showing Favorable profit generation from shareholders’ equity
- ROA Score: 4, Favorable use of assets to generate earnings
- Debt To Equity Score: 3, Moderate financial risk with a stronger balance sheet
- Overall Score: 3, Moderate overall financial standing
Which one is the best rated?
Based strictly on the provided data, DOCU holds higher ratings and scores across discounted cash flow, ROE, ROA, and overall financial standing compared to WDAY, reflecting a better analyst evaluation.
Scores Comparison
The comparison of Workday and DocuSign scores highlights their financial stability and strength assessments:
WDAY Scores
- Altman Z-Score: 4.41, indicating a safe zone with low bankruptcy risk.
- Piotroski Score: 6, categorized as average financial strength.
DOCU Scores
- Altman Z-Score: 4.43, indicating a safe zone with low bankruptcy risk.
- Piotroski Score: 5, categorized as average financial strength.
Which company has the best scores?
Both Workday and DocuSign have Altman Z-Scores in the safe zone, showing low bankruptcy risk. Workday’s Piotroski Score is slightly higher at 6 compared to DocuSign’s 5, indicating marginally stronger financial health based on the given data.
Grades Comparison
Here is a detailed comparison of the latest grades assigned to Workday, Inc. and DocuSign, Inc.:
Workday, Inc. Grades
The table below shows recent grades from reputable financial institutions for Workday, Inc.:
| Grading Company | Action | New Grade | Date |
|---|---|---|---|
| Barclays | Maintain | Overweight | 2026-01-12 |
| RBC Capital | Maintain | Outperform | 2026-01-05 |
| TD Cowen | Maintain | Buy | 2025-11-26 |
| DA Davidson | Maintain | Neutral | 2025-11-26 |
| Wells Fargo | Maintain | Overweight | 2025-11-26 |
| Barclays | Maintain | Overweight | 2025-11-26 |
| Keybanc | Maintain | Overweight | 2025-11-26 |
| Citigroup | Maintain | Neutral | 2025-11-26 |
| JP Morgan | Maintain | Overweight | 2025-11-26 |
| UBS | Maintain | Neutral | 2025-11-26 |
Workday’s grades predominantly indicate a positive outlook with multiple “Overweight” and “Buy” recommendations, reflecting confidence among analysts.
DocuSign, Inc. Grades
The table below displays recent grades from reputable financial institutions for DocuSign, Inc.:
| Grading Company | Action | New Grade | Date |
|---|---|---|---|
| RBC Capital | Maintain | Sector Perform | 2026-01-05 |
| Evercore ISI Group | Maintain | In Line | 2025-12-05 |
| UBS | Maintain | Neutral | 2025-12-05 |
| Wells Fargo | Maintain | Equal Weight | 2025-12-05 |
| Piper Sandler | Maintain | Neutral | 2025-12-05 |
| RBC Capital | Maintain | Sector Perform | 2025-12-05 |
| JP Morgan | Maintain | Neutral | 2025-12-05 |
| B of A Securities | Maintain | Neutral | 2025-12-05 |
| Needham | Maintain | Hold | 2025-12-05 |
| Baird | Maintain | Neutral | 2025-12-05 |
DocuSign’s grades mostly range from “Neutral” to “Hold” and “Sector Perform,” suggesting a more cautious or balanced stance from analysts.
Which company has the best grades?
Workday, Inc. holds stronger grades overall, with a significant number of “Buy” and “Overweight” ratings compared to DocuSign’s mostly “Hold” and “Neutral” grades. This difference could signal greater analyst confidence in Workday’s growth prospects, potentially influencing investor sentiment accordingly.
Strengths and Weaknesses
Below is a comparative overview of the strengths and weaknesses of Workday, Inc. (WDAY) and DocuSign, Inc. (DOCU) based on their recent financial and strategic data.
| Criterion | Workday, Inc. (WDAY) | DocuSign, Inc. (DOCU) |
|---|---|---|
| Diversification | Moderate – revenue mainly from subscription services (7.7B in 2025) with smaller professional services segment (728M) | Moderate – strong focus on subscription but less professional services (2.9B subscription, 75M professional services) |
| Profitability | Neutral net margin (6.23%), unfavorable ROIC (2.73%) below WACC (8.86%) | High net margin (35.87%), neutral ROIC (9.09%) slightly above WACC (8.46%) |
| Innovation | Growing ROIC trend (162%) but overall shedding value; high P/E (132) suggests market expects innovation | Growing ROIC trend (168%) with slight value creation; more reasonable P/E (18.5) |
| Global presence | Strong global footprint with high subscription revenue growth over years | Expanding global presence with consistent subscription revenue growth |
| Market Share | Leading in HCM and enterprise cloud software, but faces intense competition | Leading in e-signature and digital transaction management with niche dominance |
Key takeaways: Workday shows strong growth in subscription revenue and improving profitability trends but currently destroys value due to high costs and valuation. DocuSign demonstrates better profitability and a slightly favorable economic moat, making it a more balanced choice for investors seeking growth with improving returns.
Risk Analysis
Below is a comparative overview of key risks for Workday, Inc. (WDAY) and DocuSign, Inc. (DOCU) based on the most recent data from 2025.
| Metric | Workday, Inc. (WDAY) | DocuSign, Inc. (DOCU) |
|---|---|---|
| Market Risk | Beta 1.14, moderate volatility due to sector competition | Beta 0.99, slightly less volatile, stable demand for e-signature |
| Debt Level | Debt-to-Equity 0.37, moderate leverage, manageable risk | Debt-to-Equity 0.06, low leverage, strong balance sheet |
| Regulatory Risk | Moderate, exposure to data privacy and cloud regulations | Moderate, compliance with electronic signature laws and data security |
| Operational Risk | Medium, complexity of cloud service integration and scaling | Medium, reliance on platform stability and security updates |
| Environmental Risk | Low, minimal direct impact from environmental factors | Low, limited environmental footprint |
| Geopolitical Risk | Moderate, global operations exposed to trade tensions | Moderate, international market exposure but less diversified |
Workday faces moderate market and regulatory risks with a higher debt level but benefits from favorable liquidity ratios. DocuSign’s low debt and strong profitability reduce financial risk but operational and regulatory challenges remain. Market volatility and regulatory changes are the most impactful risks for both.
Which Stock to Choose?
Workday, Inc. (WDAY) shows a favorable income trend with 16.35% revenue growth in 2025 and a solid gross margin of 75.5%. Despite moderate profitability ratios and favorable liquidity, its ROE and ROIC remain unfavorable, with a slightly unfavorable MOAT indicating value destruction but improving profitability. The overall rating is very favorable with a B- grade.
DocuSign, Inc. (DOCU) presents a favorable income statement with strong net margin at 35.87% and a positive net margin growth of 1239.29% in 2025. Financial ratios are slightly favorable, especially ROE at 53.32%, and debt levels are low. Its MOAT is slightly favorable, reflecting growing profitability despite no clear competitive moat, and it holds a B+ rating, also very favorable.
Investors with a growth focus might find DocuSign’s strong profitability and improving income statement more appealing, while those prioritizing financial stability and liquidity could view Workday’s balanced ratios and solid rating as more suitable. The choice may depend on the investor’s risk tolerance and strategic preferences.
Disclaimer: Investment carries a risk of loss of initial capital. The past performance is not a reliable indicator of future results. Be sure to understand risks before making an investment decision.
Go Further
I encourage you to read the complete analyses of Workday, Inc. and DocuSign, Inc. to enhance your investment decisions: