In today’s fast-evolving tech landscape, Uber Technologies, Inc. and DocuSign, Inc. stand out as innovative leaders within the software application industry. Both companies, headquartered in San Francisco, leverage cutting-edge technology to transform traditional markets—Uber in mobility and delivery services, DocuSign in digital agreements and contract management. Their overlapping focus on platform-based solutions makes this comparison essential for discerning investors. Let’s explore which company offers the most compelling investment opportunity in 2026.
Table of contents
Companies Overview
I will begin the comparison between Uber Technologies, Inc. and DocuSign, Inc. by providing an overview of these two companies and their main differences.
Uber Overview
Uber Technologies, Inc. operates proprietary technology platforms connecting consumers with independent providers of ride services and delivery options across multiple continents. Its business is divided into three segments: Mobility, Delivery, and Freight, covering various transport modes and logistics solutions. Founded in 2009 and headquartered in San Francisco, Uber positions itself as a leader in on-demand mobility and delivery services with a market cap of $176.3B.
DocuSign Overview
DocuSign, Inc. specializes in electronic signature software and digital agreement management solutions globally. It offers a comprehensive suite of products including AI-driven contract lifecycle management, workflow automation, and industry-specific cloud offerings. Since its incorporation in 2003, DocuSign has focused on enabling businesses to prepare, sign, and manage agreements digitally. The company is also based in San Francisco, with a market cap of $11.4B.
Key similarities and differences
Both Uber and DocuSign operate in the software application industry, focusing on digital platforms that enhance business efficiency. While Uber’s model centers on connecting service providers and consumers in transportation and delivery, DocuSign’s platform targets digital transaction management and contract workflows. Uber’s scale and market cap significantly exceed DocuSign’s, reflecting differing market scopes and business focuses within the technology sector.
Income Statement Comparison
The table below presents a side-by-side comparison of key income statement metrics for Uber Technologies, Inc. and DocuSign, Inc. for their most recent fiscal years.
| Metric | Uber Technologies, Inc. | DocuSign, Inc. |
|---|---|---|
| Market Cap | 176.3B | 11.4B |
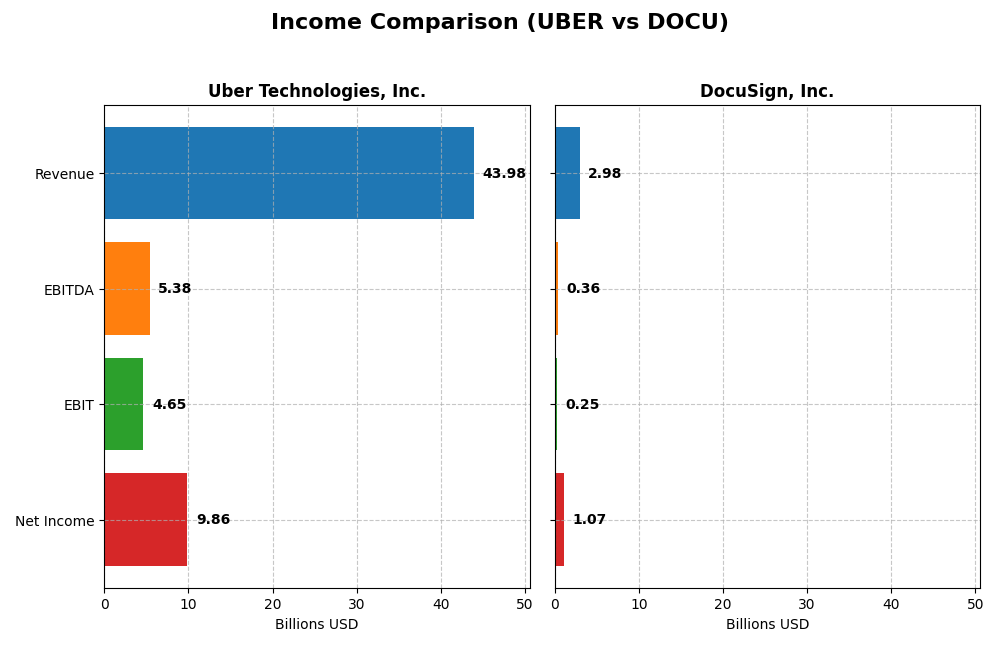
| Revenue | 43.98B | 2.98B |
| EBITDA | 5.39B | 357M |
| EBIT | 4.65B | 249M |
| Net Income | 9.86B | 1.07B |
| EPS | 4.71 | 5.23 |
| Fiscal Year | 2024 | 2025 |
Income Statement Interpretations
Uber Technologies, Inc.
Uber’s revenue has shown strong growth from 2020 to 2024, increasing from $11.1B to $44B, with net income turning significantly positive in 2024 at $9.85B after years of losses. Margins improved notably, with a gross margin of 39.4% and net margin of 22.4% in 2024. The latest year reflects accelerated growth, with revenue up 18% and net margin expanding substantially.
DocuSign, Inc.
DocuSign’s revenue grew steadily from $1.45B in 2021 to nearly $3B in 2025, alongside a turnaround to a positive net income of $1.07B in 2025. Its gross margin is high at 79.1%, with a net margin improving to 35.9%, though EBIT margin remains moderate at 8.4%. Recent growth slowed to 7.8% revenue increase, but net margin and EPS surged sharply in the last year.
Which one has the stronger fundamentals?
Uber demonstrates remarkable scale and rapid margin expansion with consistent profitable growth over five years, supported by favorable growth rates across key metrics. DocuSign maintains superior gross and net margins with strong profitability improvements but at a smaller scale and slower revenue growth recently. Both show favorable income statements, yet Uber’s larger growth and margin gains contrast with DocuSign’s higher margin quality and steadier expansion.
Financial Ratios Comparison
The table below presents key financial ratios for Uber Technologies, Inc. and DocuSign, Inc., reflecting the most recent fiscal year data available to assist in comparative analysis.
| Ratios | Uber Technologies, Inc. (2024) | DocuSign, Inc. (2025) |
|---|---|---|
| ROE | 45.7% | 53.3% |
| ROIC | 6.8% | 9.1% |
| P/E | 12.8 | 18.5 |
| P/B | 5.9 | 9.9 |
| Current Ratio | 1.07 | 0.81 |
| Quick Ratio | 1.07 | 0.81 |
| D/E | 0.53 | 0.06 |
| Debt-to-Assets | 22.3% | 3.1% |
| Interest Coverage | 5.35 | 129.0 |
| Asset Turnover | 0.86 | 0.74 |
| Fixed Asset Turnover | 14.1 | 7.3 |
| Payout Ratio | 0% | 0% |
| Dividend Yield | 0% | 0% |
Interpretation of the Ratios
Uber Technologies, Inc.
Uber’s financial ratios indicate a generally favorable performance, with strong net margin at 22.41% and return on equity at 45.72%, though its price-to-book ratio of 5.86 is unfavorable. The company shows solid interest coverage of 8.89 and a quick ratio of 1.07, signaling adequate liquidity. Uber does not pay dividends, likely reinvesting in growth and technology, prioritizing expansion over shareholder payouts.
DocuSign, Inc.
DocuSign exhibits strong profitability, with a net margin of 35.87% and an impressive return on equity of 53.32%. Its debt levels are low, reflected in a debt-to-equity ratio of 0.06 and debt to assets at 3.1%, both favorable. However, the current ratio of 0.81 is unfavorable, indicating potential liquidity concerns. DocuSign also does not pay dividends, focusing on reinvestment and growth initiatives.
Which one has the best ratios?
Both Uber and DocuSign present slightly favorable overall ratios, balancing strengths in profitability and debt management with some liquidity and valuation concerns. Uber shows stronger liquidity and interest coverage, while DocuSign leads in net margin and equity returns but has weaker current liquidity. Neither company currently offers dividend income to investors.
Strategic Positioning
This section compares the strategic positioning of Uber and DocuSign, including market position, key segments, and exposure to technological disruption:
Uber Technologies, Inc.
- Large market cap of $176B with strong global presence; faces competitive pressure in ride-sharing and delivery markets.
- Diversified revenue streams: Mobility ($25B), Delivery ($13.7B), Freight ($5.1B) drive growth across segments.
- Exposure to technological disruption through proprietary platforms linking consumers and service providers worldwide.
DocuSign, Inc.
- Smaller market cap of $11.4B, focused on e-signature software; faces competition in digital agreement management.
- Concentrated business model focused on subscription and professional services for digital agreements and contract lifecycle management.
- Incorporates AI and cloud technologies for contract automation and workflow, addressing evolving legal-tech demands.
Uber vs DocuSign Positioning
Uber pursues a diversified approach across mobility, delivery, and freight with a large global footprint, offering resilience but also complexity. DocuSign’s concentrated focus on digital agreements enables specialization but limits its market breadth compared to Uber’s multi-segment exposure.
Which has the best competitive advantage?
DocuSign shows a slightly favorable moat with growing profitability, indicating improving competitive strength. Uber, despite growing ROIC, remains slightly unfavorable, reflecting value destruction but increasing returns. DocuSign currently holds a marginally better competitive advantage.
Stock Comparison
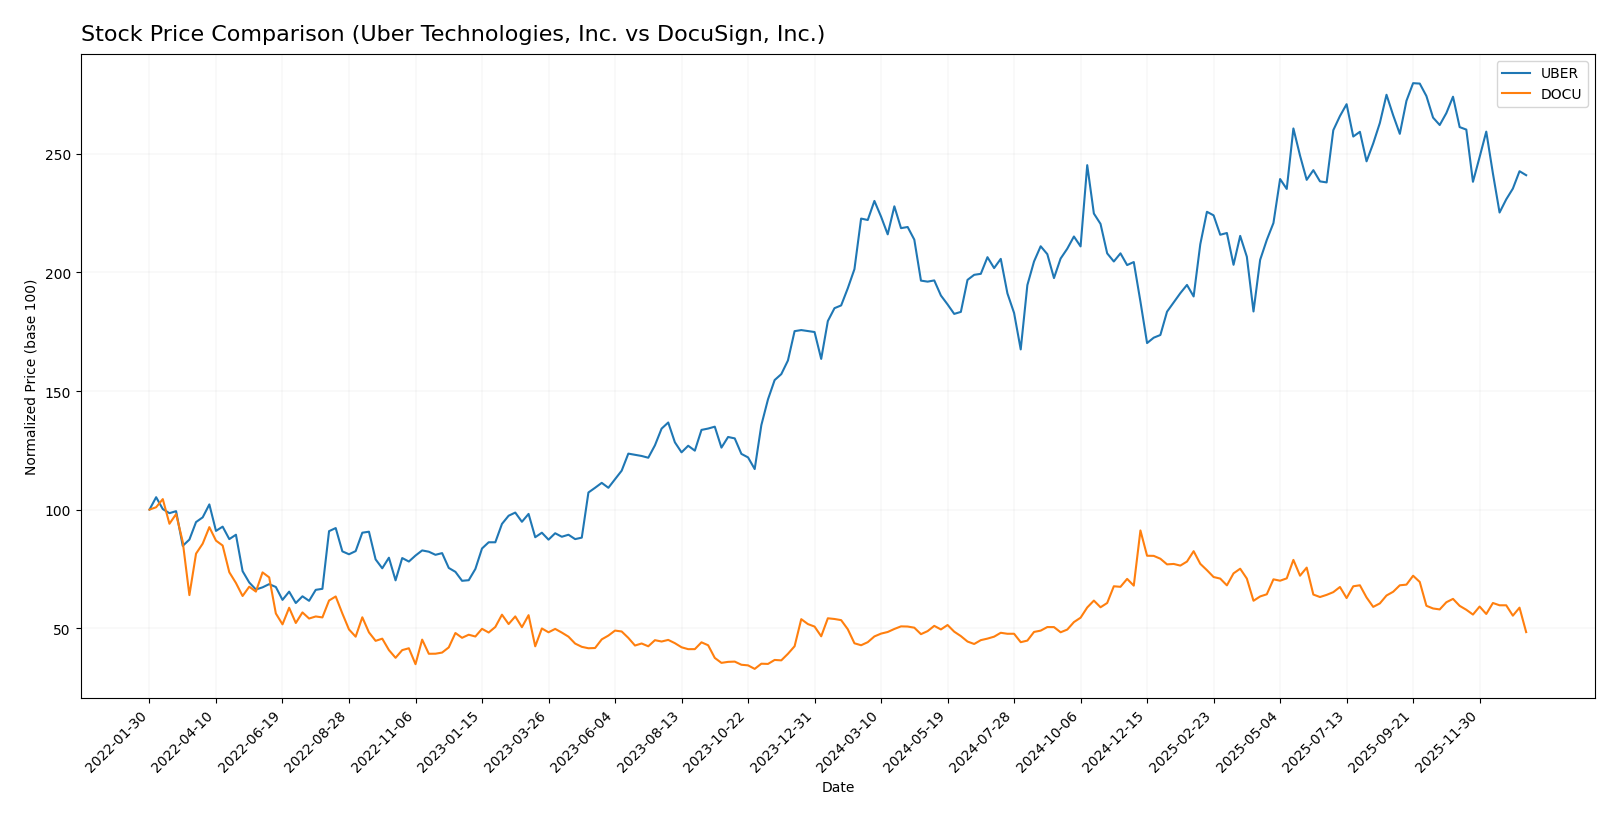
The past year has seen Uber Technologies, Inc. and DocuSign, Inc. experience notable bullish trends with decelerating momentum, alongside recent pronounced declines in their stock prices, reflecting shifts in trading dynamics.
Trend Analysis
Uber Technologies, Inc. showed an 8.5% price increase over the past 12 months, indicating a bullish trend with deceleration and a high volatility level of 10.29. The stock reached a high of 98.51 and a low of 58.99.
DocuSign, Inc. posted a 9.63% gain over the same period, also bullish with deceleration, and exhibited slightly higher volatility at 12.98. The highest and lowest prices were 106.99 and 50.84 respectively.
Comparing both, DocuSign delivered a higher overall market performance with a 9.63% increase versus Uber’s 8.5%, despite both facing recent downward trends and seller dominance in volume.
Target Prices
The analyst consensus for target prices reflects positive outlooks for both Uber Technologies, Inc. and DocuSign, Inc.
| Company | Target High | Target Low | Consensus |
|---|---|---|---|
| Uber Technologies, Inc. | 140 | 73 | 111.26 |
| DocuSign, Inc. | 88 | 70 | 76.86 |
Analysts expect Uber’s stock to appreciate significantly from its current price of $84.85, while DocuSign’s consensus target of $76.86 suggests a moderate upside from its current $56.71 price.
Analyst Opinions Comparison
This section compares analysts’ ratings and grades for Uber Technologies, Inc. and DocuSign, Inc.:
Rating Comparison
Uber Rating
- Rating: B, considered Very Favorable.
- Discounted Cash Flow Score: 1, Very Unfavorable.
- ROE Score: 5, Very Favorable, indicating high profit efficiency.
- ROA Score: 5, Very Favorable, strong asset utilization.
- Debt To Equity Score: 2, Moderate financial risk.
- Overall Score: 3, Moderate overall financial standing.
Docu Rating
- Rating: B+, considered Very Favorable.
- Discounted Cash Flow Score: 5, Very Favorable.
- ROE Score: 4, Favorable, indicating good profit efficiency.
- ROA Score: 4, Favorable, good asset utilization.
- Debt To Equity Score: 3, Moderate financial risk.
- Overall Score: 3, Moderate overall financial standing.
Which one is the best rated?
DocuSign holds a slightly higher rating of B+ versus Uber’s B, mainly due to its superior discounted cash flow score. However, Uber scores better in profitability metrics like ROE and ROA. Both have moderate overall scores.
Scores Comparison
Here is a comparison of the financial scores for Uber and DocuSign:
Uber Scores
- Altman Z-Score: 4.44, indicating a safe zone status
- Piotroski Score: 6, reflecting average financial strength
DocuSign Scores
- Altman Z-Score: 4.43, indicating a safe zone status
- Piotroski Score: 5, reflecting average financial strength
Which company has the best scores?
Both Uber and DocuSign are in the safe zone according to their Altman Z-Scores, with Uber slightly higher. Uber also has a marginally better Piotroski Score, suggesting slightly stronger financial health based strictly on the provided data.
Grades Comparison
The grades issued by reputable financial institutions for Uber Technologies, Inc. and DocuSign, Inc. are as follows:
Uber Technologies, Inc. Grades
This table summarizes recent grades given by leading grading companies for Uber Technologies, Inc.:
| Grading Company | Action | New Grade | Date |
|---|---|---|---|
| BTIG | Maintain | Buy | 2026-01-15 |
| Wells Fargo | Maintain | Overweight | 2026-01-08 |
| Cantor Fitzgerald | Maintain | Overweight | 2026-01-08 |
| Wolfe Research | Maintain | Outperform | 2026-01-06 |
| Wedbush | Maintain | Neutral | 2025-12-19 |
| Morgan Stanley | Maintain | Overweight | 2025-12-08 |
| Arete Research | Upgrade | Buy | 2025-12-03 |
| Wells Fargo | Maintain | Overweight | 2025-11-05 |
| Guggenheim | Maintain | Buy | 2025-11-05 |
| DA Davidson | Maintain | Buy | 2025-11-05 |
Overall, Uber’s grades show a strong positive bias with the majority of ratings being Buy or Overweight, indicating favorable analyst sentiment.
DocuSign, Inc. Grades
This table summarizes recent grades given by leading grading companies for DocuSign, Inc.:
| Grading Company | Action | New Grade | Date |
|---|---|---|---|
| RBC Capital | Maintain | Sector Perform | 2026-01-05 |
| Evercore ISI Group | Maintain | In Line | 2025-12-05 |
| UBS | Maintain | Neutral | 2025-12-05 |
| Wells Fargo | Maintain | Equal Weight | 2025-12-05 |
| Piper Sandler | Maintain | Neutral | 2025-12-05 |
| RBC Capital | Maintain | Sector Perform | 2025-12-05 |
| JP Morgan | Maintain | Neutral | 2025-12-05 |
| B of A Securities | Maintain | Neutral | 2025-12-05 |
| Needham | Maintain | Hold | 2025-12-05 |
| Baird | Maintain | Neutral | 2025-12-05 |
DocuSign’s grades consistently indicate a neutral to hold stance, reflecting a more cautious analyst outlook.
Which company has the best grades?
Uber Technologies, Inc. has received significantly stronger grades compared to DocuSign, Inc., with a consensus of Buy versus Hold for DocuSign. This contrast suggests Uber is viewed more favorably by analysts, potentially influencing investor confidence and portfolio allocation decisions.
Strengths and Weaknesses
Below is a comparison of key strengths and weaknesses for Uber Technologies, Inc. and DocuSign, Inc., based on the most recent financial and operational data.
| Criterion | Uber Technologies, Inc. | DocuSign, Inc. |
|---|---|---|
| Diversification | High: Revenue from Mobility ($25B), Delivery ($13.75B), Freight ($5.14B) | Moderate: Primarily Subscription ($2.9B) with minor Professional Services |
| Profitability | Strong net margin (22.41%) and ROE (45.72%), but ROIC below WACC; value destroying currently | Higher net margin (35.87%) and ROE (53.32%), ROIC slightly above WACC; slightly favorable profitability trend |
| Innovation | Growing ROIC trend shows improving efficiency despite current value loss | Growing ROIC trend supports improving profitability and competitive positioning |
| Global presence | Extensive global operations in mobility and delivery sectors | Global SaaS presence but less diversified geographically |
| Market Share | Leading in ride-sharing and delivery markets worldwide | Leading in e-signature software with strong subscription base |
In summary, Uber demonstrates impressive diversification and strong profitability metrics but currently destroys value due to ROIC below WACC, though improving. DocuSign shows slightly favorable profitability with growing ROIC and a focused subscription model, though less diversified. Both companies present growth potential, with differing risk profiles to consider.
Risk Analysis
Below is a comparative table of key risks for Uber Technologies, Inc. and DocuSign, Inc. based on the latest data from 2025-2026.
| Metric | Uber Technologies, Inc. | DocuSign, Inc. |
|---|---|---|
| Market Risk | Moderate (Beta 1.20) | Moderate (Beta 0.99) |
| Debt level | Moderate (D/E 0.53) | Low (D/E 0.06) |
| Regulatory Risk | High (Ridesharing & delivery regulations globally) | Moderate (Data privacy and e-signature laws) |
| Operational Risk | Moderate (Complex logistics and multiple segments) | Moderate (Platform reliability and integration) |
| Environmental Risk | Moderate (Fleet emissions and delivery footprint) | Low (Primarily software-based) |
| Geopolitical Risk | Moderate (Global operations with exposure to regional instability) | Low (Primarily U.S. and tech-oriented) |
The most impactful risks are regulatory for Uber, given the global challenges in ridesharing and delivery compliance, and market valuation pressures for DocuSign, reflected in its high price-to-book ratio and recent stock volatility. Debt levels remain manageable for both, but Uber faces higher operational complexity and environmental scrutiny. Both companies maintain strong financial health with safe Altman Z-Scores, suggesting resilience despite these risks.
Which Stock to Choose?
Uber Technologies, Inc. has shown strong income growth with a 295% revenue increase over five years and consistently favorable profitability metrics, including a 22.4% net margin and 45.7% ROE. Its debt levels are moderate with a 0.53 debt-to-equity ratio, and its credit rating is very favorable.
DocuSign, Inc. also demonstrates solid income growth, with a 105% revenue increase over five years and a higher net margin of 35.9%. Its ROE stands at 53.3%, supported by low debt levels (0.06 debt-to-equity) and a very favorable credit rating, although some liquidity ratios are less favorable.
For investors prioritizing growth and high profitability, DocuSign’s stronger margins and low debt might appear more attractive, while Uber’s improving profitability and moderate leverage could appeal to those seeking a balance between growth and financial stability. The slightly favorable ratings and improving income profiles suggest both companies have potential, depending on risk tolerance and investment strategy.
Disclaimer: Investment carries a risk of loss of initial capital. The past performance is not a reliable indicator of future results. Be sure to understand risks before making an investment decision.
Go Further
I encourage you to read the complete analyses of Uber Technologies, Inc. and DocuSign, Inc. to enhance your investment decisions: