In the dynamic world of software applications, Tyler Technologies, Inc. (TYL) and DocuSign, Inc. (DOCU) stand out as leaders with distinct yet overlapping market footprints. Tyler focuses on integrated public sector management solutions, while DocuSign revolutionizes digital agreement processes with cutting-edge e-signature and AI tools. Both companies innovate aggressively, making them compelling contenders to watch. In this article, I will help you decide which is the more attractive investment opportunity for your portfolio.
Table of contents
Companies Overview
I will begin the comparison between Tyler Technologies and DocuSign by providing an overview of these two companies and their main differences.
Tyler Technologies Overview
Tyler Technologies, Inc. specializes in integrated information management solutions and services tailored for the public sector. Its offerings span enterprise software, appraisal and tax, and NIC segments, providing tools for government agencies and educational institutions. The company supports various public functions such as financial management, judicial systems, public safety, and property assessment, with a strategic cloud hosting partnership with Amazon Web Services. Tyler is headquartered in Plano, Texas, and has a market cap of $18.9B.
DocuSign Overview
DocuSign, Inc. delivers electronic signature and agreement cloud software globally, enabling businesses to prepare, sign, and manage contracts digitally. Its product suite includes AI-driven contract lifecycle management, interactive forms, signer identification, and industry-specific cloud offerings for real estate, mortgage, and federal agencies. Headquartered in San Francisco, California, DocuSign serves enterprise to small businesses through direct and partner channels, holding a market cap of $11.4B.
Key similarities and differences
Both Tyler Technologies and DocuSign operate within the technology sector focusing on software applications, yet their markets differ significantly. Tyler targets public sector clients with comprehensive management solutions, while DocuSign concentrates on digital agreement workflows across various industries. Both companies emphasize cloud-based services, but Tyler’s offerings are broader in public administration, whereas DocuSign specializes in electronic signatures and contract management. Their employee counts are comparable, with Tyler at 7,462 and DocuSign at 6,838.
Income Statement Comparison
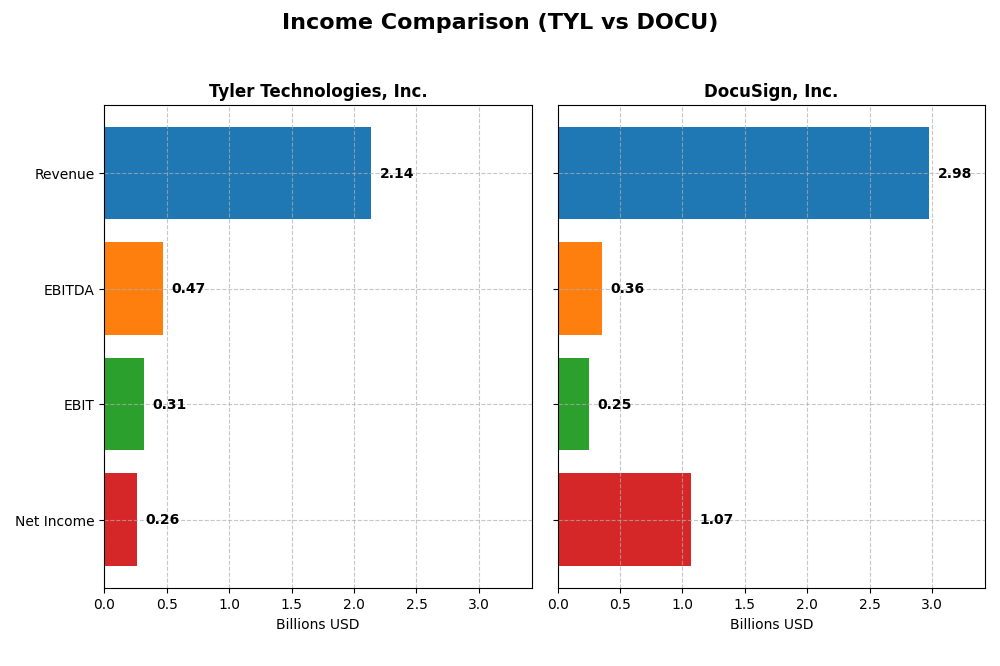
The table below presents a side-by-side comparison of key income statement metrics for Tyler Technologies, Inc. and DocuSign, Inc. based on their most recent fiscal years.
| Metric | Tyler Technologies, Inc. | DocuSign, Inc. |
|---|---|---|
| Market Cap | 18.9B | 11.4B |
| Revenue | 2.14B | 2.98B |
| EBITDA | 466M | 357M |
| EBIT | 314M | 249M |
| Net Income | 263M | 1.07B |
| EPS | 6.17 | 5.23 |
| Fiscal Year | 2024 | 2025 |
Income Statement Interpretations
Tyler Technologies, Inc.
Tyler Technologies showed steady revenue growth from $1.12B in 2020 to $2.14B in 2024, with net income rising from $195M to $263M in the same period. Gross and EBIT margins remained favorable around 41% and 15%, respectively, although net margin declined slightly overall. The latest year saw a 9.5% revenue increase with a strong 44.7% net margin improvement.
DocuSign, Inc.
DocuSign’s revenue doubled from $1.45B in 2021 to nearly $3.0B in 2025, with net income surging from a loss of $243M to a profit of $1.07B. Gross margin stayed high near 79%, while EBIT margin was moderate at 8.4%. The most recent year featured solid revenue growth of 7.8% and exceptional net margin expansion exceeding 1200%.
Which one has the stronger fundamentals?
Both companies exhibit favorable income statement trends, with Tyler showing consistent profitability and margin stability, while DocuSign demonstrates explosive net income and margin growth after initial losses. Tyler’s higher EBIT margin contrasts with DocuSign’s superior net margin and growth rates. Overall, each company’s fundamentals appeal differently based on margin quality versus growth dynamics.
Financial Ratios Comparison
The table below presents the most recent financial ratios for Tyler Technologies, Inc. and DocuSign, Inc., providing a side-by-side view of key performance and financial health metrics as of their latest fiscal years.
| Ratios | Tyler Technologies, Inc. (TYL) 2024 | DocuSign, Inc. (DOCU) 2025 |
|---|---|---|
| ROE | 7.76% | 53.32% |
| ROIC | 6.20% | 9.09% |
| P/E | 93.42 | 18.51 |
| P/B | 7.25 | 9.87 |
| Current Ratio | 1.35 | 0.81 |
| Quick Ratio | 1.35 | 0.81 |
| D/E (Debt-to-Equity) | 0.19 | 0.06 |
| Debt-to-Assets | 12.32% | 3.10% |
| Interest Coverage | 50.50 | 128.99 |
| Asset Turnover | 0.41 | 0.74 |
| Fixed Asset Turnover | 10.95 | 7.28 |
| Payout ratio | 0 | 0 |
| Dividend yield | 0 | 0 |
Interpretation of the Ratios
Tyler Technologies, Inc.
Tyler Technologies shows a mixed ratio profile for 2024 with strong debt management and interest coverage, but weaker profitability indicators such as ROE and asset turnover. The PE and PB ratios also suggest valuation concerns. The company does not pay dividends, likely focusing on reinvestment and growth, with no current shareholder returns through dividends or buybacks.
DocuSign, Inc.
DocuSign presents generally favorable profitability ratios, including a high net margin and ROE, alongside strong interest coverage and low debt levels. However, liquidity ratios are weaker, reflecting potential short-term financial constraints. Like Tyler, DocuSign does not pay dividends, possibly prioritizing growth and R&D investments over shareholder payouts.
Which one has the best ratios?
Both companies exhibit slightly favorable overall ratio profiles, but DocuSign’s superior profitability and lower debt burden contrast with Tyler’s stronger liquidity and debt metrics. Valuation and liquidity concerns exist in both, but DocuSign’s higher returns suggest a more efficient use of capital despite some neutral and unfavorable liquidity ratios.
Strategic Positioning
This section compares the strategic positioning of Tyler Technologies, Inc. and DocuSign, Inc., focusing on market position, key segments, and exposure to technological disruption:
Tyler Technologies, Inc.
- Market leader in public sector software, facing moderate competition in niche government services.
- Diverse segments including enterprise software, tax appraisal, SaaS, professional services, and transaction fees.
- Strategic AWS collaboration for cloud hosting; moderate disruption risk in public sector software.
DocuSign, Inc.
- Leading provider in electronic signature software, competing in broad SaaS agreement management.
- Concentrated on subscription-based e-signature solutions and professional services in digital agreements.
- High exposure to AI-driven contract lifecycle management and digital workflow automation.
Tyler Technologies, Inc. vs DocuSign, Inc. Positioning
Tyler Technologies adopts a diversified approach across multiple public sector software segments, while DocuSign focuses on a concentrated SaaS model centered on digital agreements. Tyler’s broad public sector reach contrasts with DocuSign’s innovation in AI and workflow automation.
Which has the best competitive advantage?
DocuSign shows a slightly favorable moat with growing profitability and increasing ROIC, indicating improving competitive positioning. Tyler Technologies has a very unfavorable moat with declining ROIC, reflecting value destruction and weaker competitive advantage.
Stock Comparison
The stock price movements of Tyler Technologies, Inc. (TYL) and DocuSign, Inc. (DOCU) over the past year exhibit distinct bullish trends with varying degrees of acceleration, alongside recent downward pressures reflecting shifts in trading dynamics.
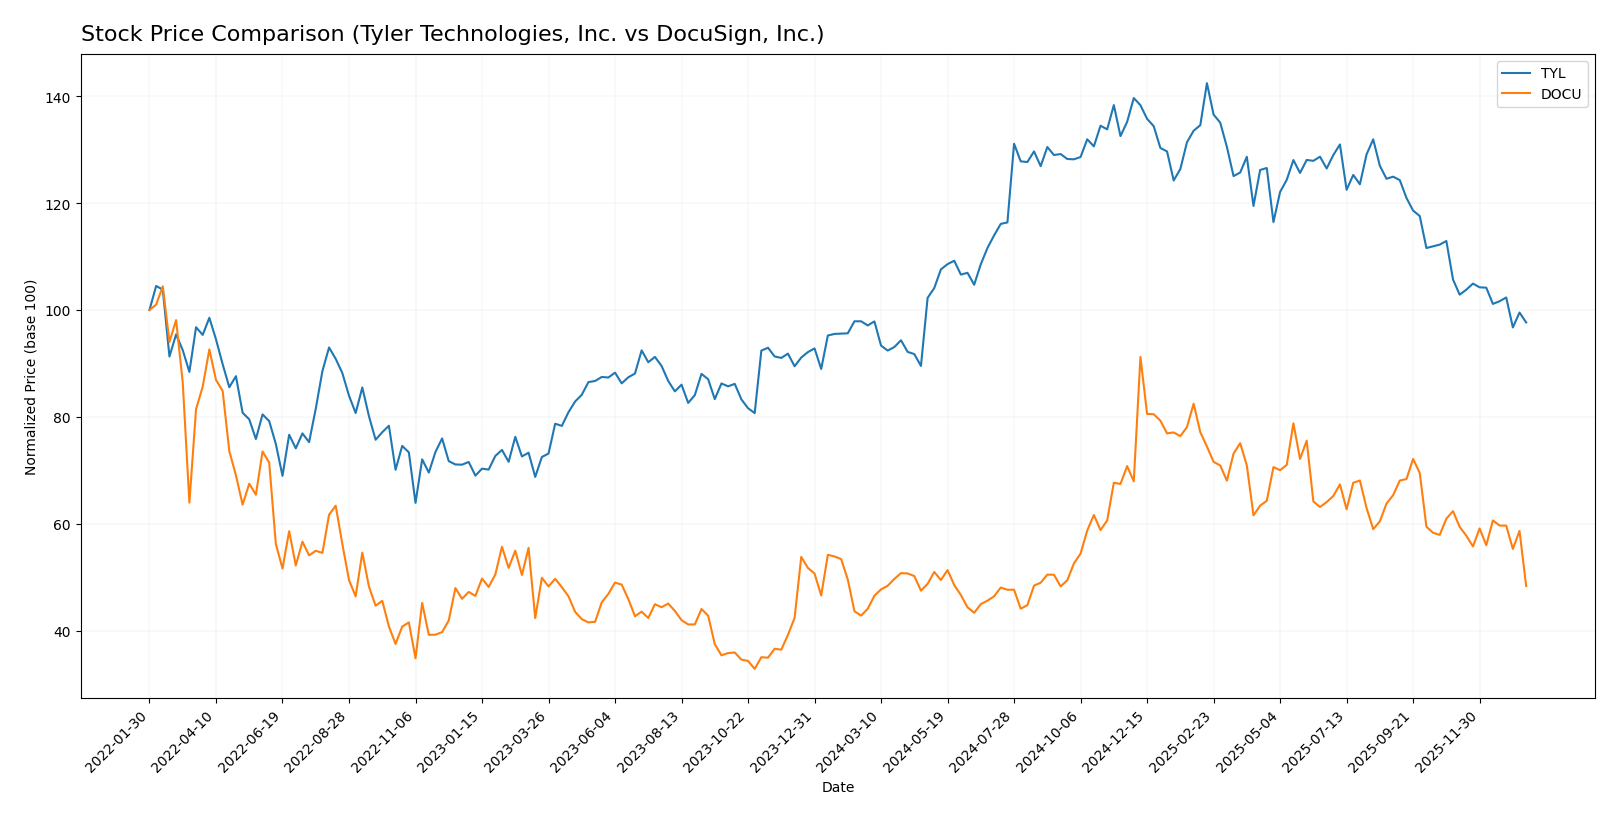
Trend Analysis
Tyler Technologies, Inc. (TYL) showed a modest bullish trend over the past 12 months with a +0.58% price change and decelerating momentum. The price ranged between 403.35 and 641.7, with a recent downward correction of -7.61%.
DocuSign, Inc. (DOCU) experienced a stronger bullish trend with a +9.63% increase over 12 months but also a deceleration in trend acceleration. The stock fluctuated from 50.84 to 106.99 with a sharper recent decline of -22.46%.
Comparatively, DOCU delivered the highest market performance over the past year, outperforming TYL by a wide margin despite both stocks showing recent bearish pressure.
Target Prices
Analysts present a positive target consensus for both Tyler Technologies, Inc. and DocuSign, Inc.
| Company | Target High | Target Low | Consensus |
|---|---|---|---|
| Tyler Technologies, Inc. | 675 | 470 | 584 |
| DocuSign, Inc. | 88 | 70 | 76.86 |
The consensus targets suggest substantial upside potential compared to current prices: Tyler Technologies trades around 440, well below its 584 consensus, while DocuSign at 56.71 also has an upside to the 76.86 consensus target.
Analyst Opinions Comparison
This section compares analysts’ ratings and grades for Tyler Technologies, Inc. and DocuSign, Inc.:
Rating Comparison
TYL Rating
- Rating: B, considered very favorable overall by analysts.
- Discounted Cash Flow Score: 4, indicating a favorable outlook on cash flows.
- ROE Score: 3, showing moderate efficiency in generating profit from equity.
- ROA Score: 4, a favorable score on asset utilization for earnings.
- Debt To Equity Score: 3, moderate financial risk based on debt versus equity.
- Overall Score: 3, representing a moderate overall financial standing.
DOCU Rating
- Rating: B+, also considered very favorable overall by analysts.
- Discounted Cash Flow Score: 5, reflecting a very favorable cash flow forecast.
- ROE Score: 4, indicating favorable profit generation from shareholders’ equity.
- ROA Score: 4, also favorable in asset utilization to generate earnings.
- Debt To Equity Score: 3, the same moderate risk level from debt to equity.
- Overall Score: 3, also reflecting a moderate overall financial standing.
Which one is the best rated?
DocuSign holds a slightly better rating of B+ compared to Tyler’s B and scores higher in discounted cash flow and return on equity. Both have equal overall and debt-to-equity scores, making DocuSign marginally better rated based on this data.
Scores Comparison
Here is a comparison of the Altman Z-Score and Piotroski Score for Tyler Technologies and DocuSign:
Tyler Technologies Scores
- Altman Z-Score: 7.42, indicating a safe zone with low bankruptcy risk.
- Piotroski Score: 6, reflecting average financial strength.
DocuSign Scores
- Altman Z-Score: 4.43, indicating a safe zone with low bankruptcy risk.
- Piotroski Score: 5, reflecting average financial strength.
Which company has the best scores?
Tyler Technologies exhibits a higher Altman Z-Score and Piotroski Score compared to DocuSign, indicating relatively stronger financial stability and average financial strength based on the provided metrics.
Grades Comparison
Here is a detailed comparison of the recent grades assigned to Tyler Technologies, Inc. and DocuSign, Inc.:
Tyler Technologies, Inc. Grades
This table shows the latest grades from recognized grading companies for Tyler Technologies, Inc.:
| Grading Company | Action | New Grade | Date |
|---|---|---|---|
| Piper Sandler | Maintain | Overweight | 2026-01-13 |
| Wells Fargo | Maintain | Equal Weight | 2026-01-08 |
| DA Davidson | Maintain | Neutral | 2025-12-09 |
| Evercore ISI Group | Maintain | In Line | 2025-10-31 |
| DA Davidson | Maintain | Neutral | 2025-10-31 |
| DA Davidson | Maintain | Neutral | 2025-10-10 |
| DA Davidson | Maintain | Neutral | 2025-08-05 |
| Barclays | Maintain | Overweight | 2025-07-31 |
| Needham | Maintain | Buy | 2025-05-13 |
| Barclays | Maintain | Overweight | 2025-04-25 |
The grades for Tyler Technologies show a consistent pattern of neutral to positive ratings, with multiple firms maintaining Overweight and Buy recommendations.
DocuSign, Inc. Grades
This table presents the latest grades from recognized grading companies for DocuSign, Inc.:
| Grading Company | Action | New Grade | Date |
|---|---|---|---|
| RBC Capital | Maintain | Sector Perform | 2026-01-05 |
| Evercore ISI Group | Maintain | In Line | 2025-12-05 |
| UBS | Maintain | Neutral | 2025-12-05 |
| Wells Fargo | Maintain | Equal Weight | 2025-12-05 |
| Piper Sandler | Maintain | Neutral | 2025-12-05 |
| RBC Capital | Maintain | Sector Perform | 2025-12-05 |
| JP Morgan | Maintain | Neutral | 2025-12-05 |
| B of A Securities | Maintain | Neutral | 2025-12-05 |
| Needham | Maintain | Hold | 2025-12-05 |
| Baird | Maintain | Neutral | 2025-12-05 |
DocuSign’s grades predominantly show hold or neutral ratings, indicating a more cautious stance by analysts.
Which company has the best grades?
Tyler Technologies, Inc. has received predominantly buy and overweight grades, while DocuSign, Inc. mostly holds neutral and hold ratings. This suggests Tyler is viewed more favorably by analysts, potentially attracting investors seeking growth.
Strengths and Weaknesses
Below is a comparative overview of key strengths and weaknesses for Tyler Technologies, Inc. (TYL) and DocuSign, Inc. (DOCU) based on the latest financial and strategic data available.
| Criterion | Tyler Technologies, Inc. (TYL) | DocuSign, Inc. (DOCU) |
|---|---|---|
| Diversification | Moderate: Revenue spread across software, professional services, maintenance, SaaS, and transaction fees | Moderate: Mainly subscription and professional services with growing diversification |
| Profitability | Moderate net margin (12.3%), declining ROIC, value destroying | High net margin (35.9%), growing ROIC, slightly favorable value creation |
| Innovation | Limited evidence of strong innovation; declining economic moat | Strong innovation focus with growing profitability and competitive positioning |
| Global presence | Primarily US-focused local government software | Broader global SaaS footprint with increasing adoption worldwide |
| Market Share | Leading in public sector software niche | Leading in digital transaction management market |
Key takeaways: Tyler Technologies shows solid revenue streams but struggles with declining profitability and value destruction, raising caution. DocuSign demonstrates strong profitability growth and innovation, indicating better competitive positioning but still lacks a durable economic moat. Investors should weigh risk tolerance and growth potential accordingly.
Risk Analysis
Below is a comparison table of key risks for Tyler Technologies, Inc. (TYL) and DocuSign, Inc. (DOCU) based on the most recent data from 2024 and 2025:
| Metric | Tyler Technologies, Inc. (TYL) | DocuSign, Inc. (DOCU) |
|---|---|---|
| Market Risk | Moderate beta 0.916; tech sector volatility | Moderate beta 0.994; NASDAQ exposure |
| Debt level | Low debt-to-equity 0.19; favorable leverage | Very low debt-to-equity 0.06; very favorable leverage |
| Regulatory Risk | Moderate, public sector compliance required | Moderate, data privacy and e-signature regulations |
| Operational Risk | Moderate, reliance on public sector contracts | Moderate, dependency on SaaS platform stability |
| Environmental Risk | Low, limited direct impact | Low, minimal direct environmental footprint |
| Geopolitical Risk | Moderate, US-focused operations | Moderate, international exposure with US base |
The most impactful risks are market volatility for both companies given their technology focus and moderate regulatory challenges. Tyler faces additional operational risks tied to government contracts, while DocuSign’s exposure to data privacy laws is critical. Both have strong balance sheets with low debt, reducing financial risk.
Which Stock to Choose?
Tyler Technologies, Inc. (TYL) shows a favorable income evolution with 9.53% revenue growth in 2024 and strong profitability metrics, including a 12.3% net margin. Its financial ratios are slightly favorable overall, with low debt levels and a solid current ratio of 1.35, though ROE and valuation multiples appear less attractive. The company holds a very favorable rating of B but demonstrates a very unfavorable moat with declining ROIC below WACC, indicating value destruction.
DocuSign, Inc. (DOCU) exhibits favorable income growth, including a 7.78% revenue increase in 2025 and a robust 35.87% net margin. Financial ratios are slightly favorable with strong return on equity and low debt, despite a weaker current ratio of 0.81. Its rating is very favorable at B+, supported by a slightly favorable moat showing improving ROIC trends, though ROIC remains below WACC, suggesting profitability is increasing but the competitive advantage is not yet strong.
For investors focused on growth and strong profitability, DocuSign’s improving ROIC and higher net margin might appear more favorable, while those prioritizing financial stability and a proven rating could interpret Tyler Technologies’ consistent income growth and low debt as attractive. The choice could depend on the investor’s risk tolerance and preference for either evolving profitability or established financial metrics.
Disclaimer: Investment carries a risk of loss of initial capital. The past performance is not a reliable indicator of future results. Be sure to understand risks before making an investment decision.
Go Further
I encourage you to read the complete analyses of Tyler Technologies, Inc. and DocuSign, Inc. to enhance your investment decisions: