Home > Comparison > Technology > MSTR vs DOCU
The strategic rivalry between Strategy Inc and DocuSign, Inc. shapes the evolution of the software application sector. Strategy Inc, a bitcoin treasury and AI analytics pioneer, contrasts with DocuSign’s market-leading digital agreement platform. This face-off highlights a contest between innovative asset integration and cloud-based workflow automation. This analysis aims to identify which company’s strategic path offers superior risk-adjusted returns for a diversified portfolio navigating technology’s dynamic landscape.

Table of contents
Companies Overview
Strategy Inc and DocuSign, Inc. stand as pivotal players in the evolving software application landscape, each commanding unique market niches.
Strategy Inc: Bitcoin Treasury and AI Analytics Pioneer
Strategy Inc operates primarily as a bitcoin treasury company, offering investors exposure through a mix of securities. Its core revenue stems from these financial instruments and AI-powered enterprise analytics software, such as Strategy One and Strategy Mosaic. In 2025, the company sharpened its focus on integrating AI-driven insights across data sources for enhanced decision-making.
DocuSign, Inc.: Leader in Digital Agreement Solutions
DocuSign dominates the electronic signature software market, providing tools that digitize agreements and automate contract workflows. Its revenue engine includes e-signatures, AI-powered contract lifecycle management, and specialized cloud offerings for industries like real estate and life sciences. The firm’s 2026 strategy centers on expanding AI capabilities and industry-specific cloud services.
Strategic Collision: Similarities & Divergences
Both companies leverage AI to enhance user experience but diverge sharply in focus—Strategy Inc embraces a bitcoin treasury model paired with enterprise analytics, while DocuSign champions a comprehensive digital agreements ecosystem. Their primary battleground lies in delivering AI-driven solutions, yet their investment profiles differ: Strategy Inc is a high-beta, crypto-exposed growth story, whereas DocuSign presents a steadier, enterprise SaaS growth trajectory.
Income Statement Comparison
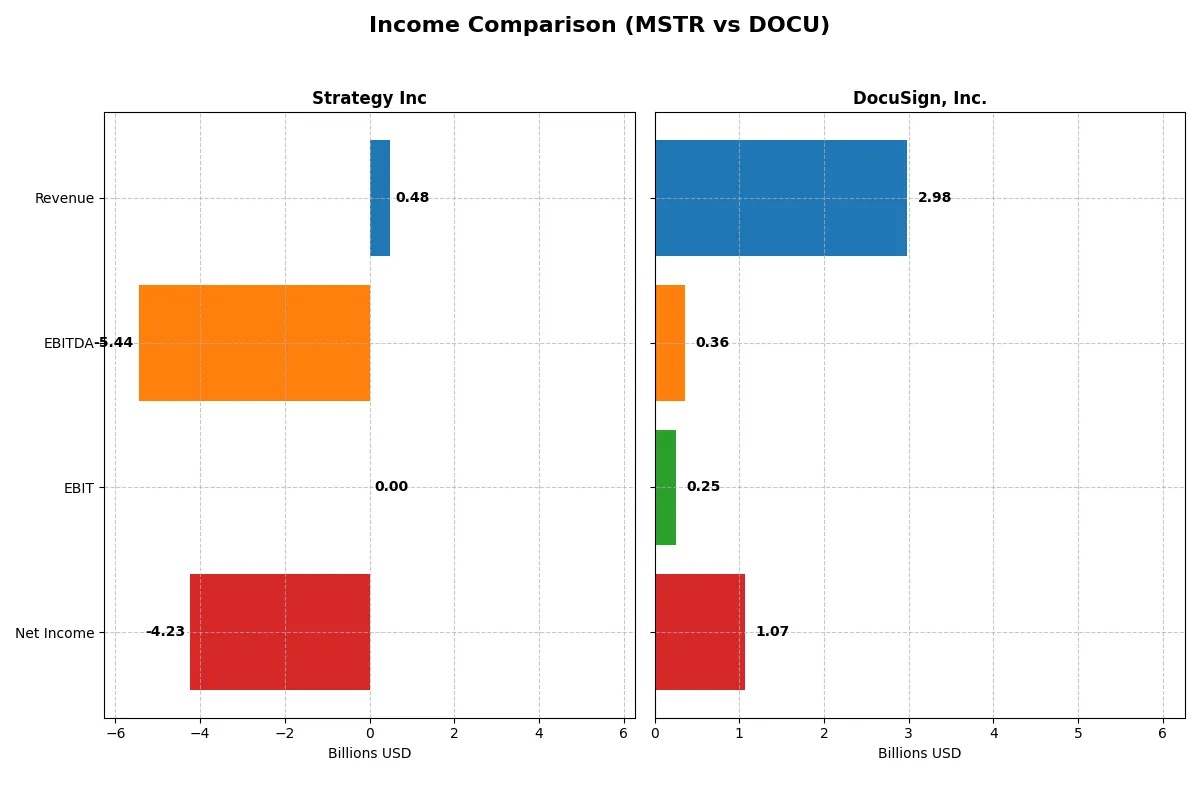
The following data dissects the core profitability and scalability of both corporate engines to reveal who dominates the bottom line:
| Metric | Strategy Inc (MSTR) | DocuSign, Inc. (DOCU) |
|---|---|---|
| Revenue | 477M | 2.98B |
| Cost of Revenue | 149M | 622M |
| Operating Expenses | 5.62B | 2.16B |
| Gross Profit | 328M | 2.36B |
| EBITDA | -5.44B | 357M |
| EBIT | 0 | 249M |
| Interest Expense | 65M | 2M |
| Net Income | -4.23B | 1.07B |
| EPS | -15.23 | 5.23 |
| Fiscal Year | 2025 | 2025 |
Income Statement Analysis: The Bottom-Line Duel
This income statement comparison exposes each company’s operational efficiency and profitability across recent years.
Strategy Inc Analysis
Strategy Inc’s revenue shows a modest decline from $510M in 2021 to $477M in 2025. Gross margin remains strong at nearly 69%, but net margin plummets to -886%, reflecting heavy losses. The latest year highlights a dramatic net loss of -$4.2B, signaling severe inefficiency and negative momentum despite steady revenue.
DocuSign, Inc. Analysis
DocuSign’s revenue climbs robustly from $1.45B in 2021 to $3B in 2025, with gross margin holding firm above 79%. Net margin turns positive to 36%, signaling improved profitability. In 2025, net income surges to $1.07B, demonstrating operational leverage and strong momentum in scaling profitably.
Margin Resilience vs. Growth and Profitability
DocuSign outperforms Strategy Inc on all fronts: revenue growth, margin expansion, and net income gains. Strategy Inc struggles with sustained losses despite stable revenue and favorable gross margins. DocuSign’s profile is more attractive for investors seeking growth coupled with improving profitability and margin resilience.
Financial Ratios Comparison
These vital ratios act as a diagnostic tool to expose the underlying fiscal health, valuation premiums, and capital efficiency of the companies compared below:
| Ratios | Strategy Inc (MSTR) | DocuSign, Inc. (DOCU) |
|---|---|---|
| ROE | -6.40% (2024) | 53.32% (2025) |
| ROIC | -4.38% (2024) | 9.09% (2025) |
| P/E | -47.8 (2024) | 18.5 (2025) |
| P/B | 3.06 (2024) | 9.87 (2025) |
| Current Ratio | 0.71 (2024) | 0.81 (2025) |
| Quick Ratio | 0.71 (2024) | 0.81 (2025) |
| D/E | 0.40 (2024) | 0.06 (2025) |
| Debt-to-Assets | 28.1% (2024) | 3.10% (2025) |
| Interest Coverage | -29.9 (2024) | 129.0 (2025) |
| Asset Turnover | 0.02 (2024) | 0.74 (2025) |
| Fixed Asset Turnover | 5.73 (2024) | 7.28 (2025) |
| Payout Ratio | 0% (2024) | 0% (2025) |
| Dividend Yield | 0% (2024) | 0% (2025) |
| Fiscal Year | 2024 | 2025 |
Efficiency & Valuation Duel: The Vital Signs
Financial ratios serve as the company’s DNA, exposing hidden risks and highlighting operational strength. They reveal how efficiently a firm generates returns and how the market prices its future prospects.
Strategy Inc
Strategy Inc’s profitability metrics signal deep challenges. Its negative ROE (-6.4%) and net margin (-251.7%) highlight operational losses and weak capital returns. Despite a low P/E of -47.8 suggesting undervaluation, the stock’s valuation feels stretched given poor fundamentals. The absence of dividends points to reinvestment in R&D, but liquidity issues persist with a current ratio of 0.71.
DocuSign, Inc.
DocuSign exhibits robust profitability with a 53.3% ROE and a positive 35.9% net margin, reflecting strong operational efficiency. Its P/E ratio of 18.5 indicates a fair valuation relative to earnings, though a high P/B of 9.87 raises concerns about stock premium. DocuSign maintains disciplined debt levels and reinvests cash flow to fuel growth, without paying dividends.
Balanced Strength vs. Distressed Value
DocuSign offers a healthier operational profile with solid returns and reasonable earnings valuation. Strategy Inc’s metrics warn of financial strain despite its seemingly cheap P/E. Investors prioritizing stable profitability and moderate valuation may lean toward DocuSign, while those seeking turnaround opportunities face higher risk with Strategy Inc.
Which one offers the Superior Shareholder Reward?
Strategy Inc (MSTR) pays no dividends and sustains negative free cash flow (-115/share in 2024), limiting distribution capacity. Its buyback activity is unclear, raising sustainability concerns amid weak operating margins. DocuSign, Inc. (DOCU) also pays no dividends but generates robust free cash flow (4.5/share in 2025) and consistently executes buybacks. DOCU’s model combines sustainable cash generation and active buybacks, supporting long-term shareholder value. I conclude DOCU offers a superior total return profile for 2026 investors.
Comparative Score Analysis: The Strategic Profile
The radar chart reveals the fundamental DNA and strategic trade-offs of Strategy Inc and DocuSign, Inc.:
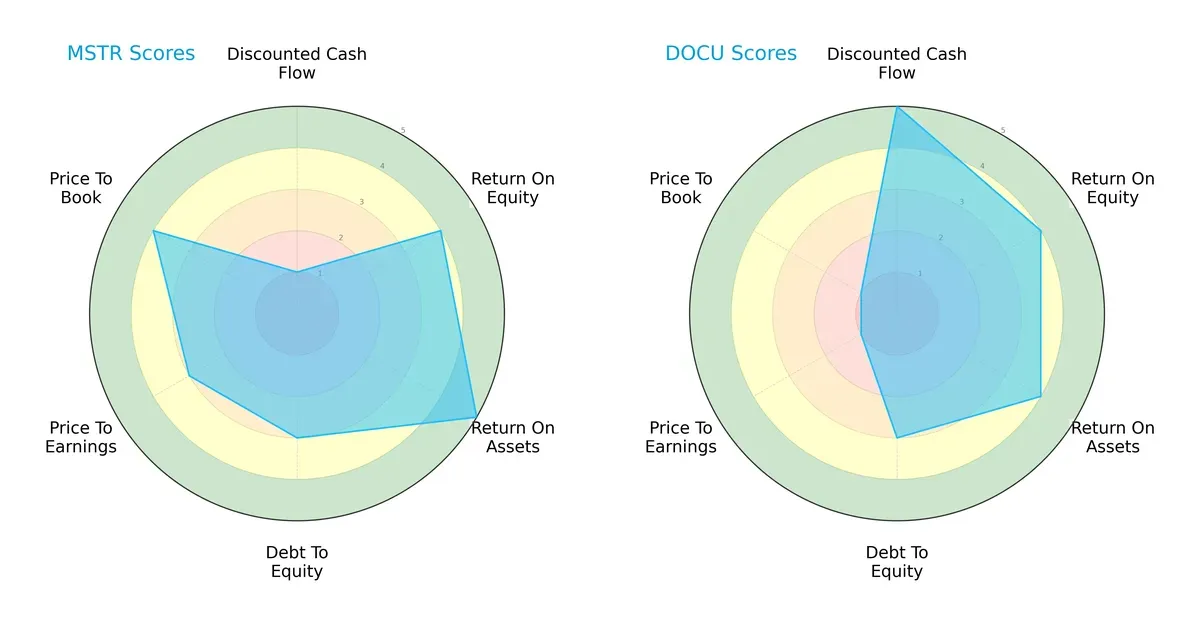
Strategy Inc leans on strong asset efficiency (ROA 5) and solid equity returns (ROE 4), yet suffers from a weak discounted cash flow score (1). DocuSign excels in DCF (5), suggesting growth optimism, but its valuation metrics lag significantly (P/E and P/B at 1). Strategy Inc offers a more balanced financial profile, while DocuSign relies heavily on future cash flow potential despite expensive valuation.
Bankruptcy Risk: Solvency Showdown
DocuSign’s Altman Z-Score of 3.09 places it in the safe zone, outperforming Strategy Inc’s 2.30 in the grey zone:
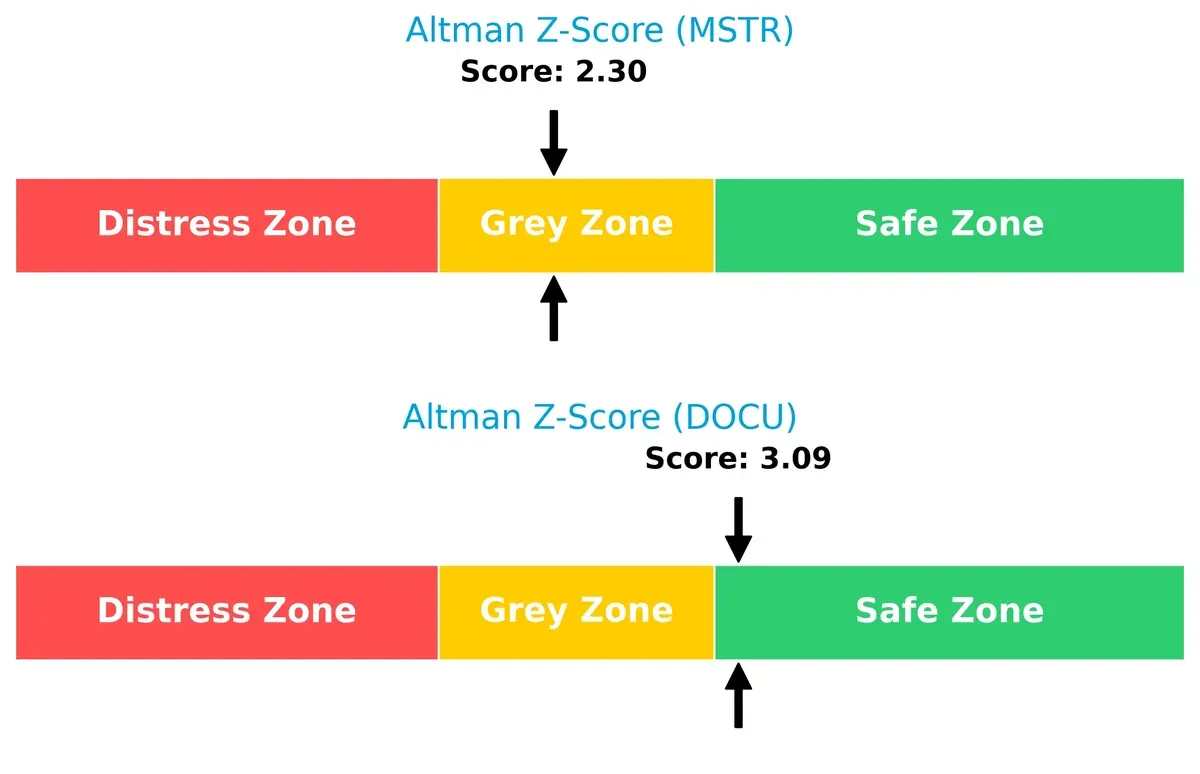
DocuSign exhibits stronger long-term solvency, implying lower bankruptcy risk amid current market cycles. Strategy Inc’s moderate score signals caution, reflecting potential liquidity or leverage concerns investors must monitor closely.
Financial Health: Quality of Operations
DocuSign scores a 5 in Piotroski F-Score, slightly edging Strategy Inc’s 4, both indicating average financial health:
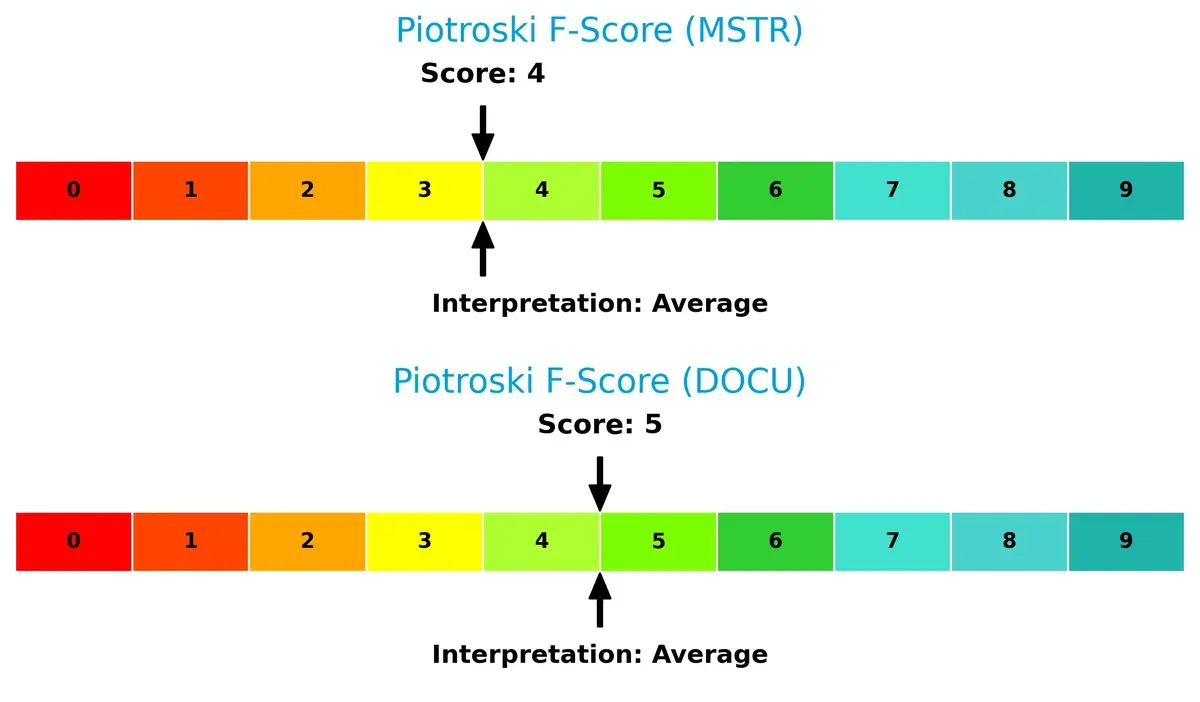
While neither company shows strong internal red flags, DocuSign’s marginally higher score suggests better operational quality and internal financial controls. Strategy Inc’s score calls for vigilance on profitability and efficiency metrics.
How are the two companies positioned?
This section dissects the operational DNA of Strategy Inc and DocuSign by comparing their revenue distribution and internal dynamics. The goal is to confront their economic moats and identify which model offers the most resilient competitive advantage today.
Revenue Segmentation: The Strategic Mix
This visual comparison dissects how Strategy Inc and DocuSign, Inc. diversify their income streams and reveals where their primary sector bets lie:
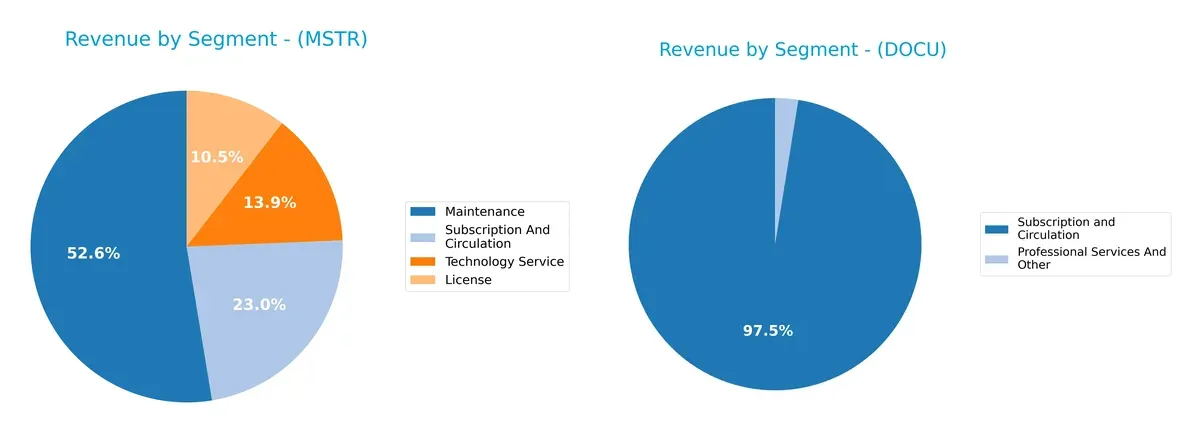
Strategy Inc anchors its revenue heavily on Maintenance at $244M (2024), with meaningful contributions from Subscription ($107M) and Technology Service ($64M). DocuSign, Inc. pivots almost entirely on Subscription and Circulation, generating $2.9B in 2025, dwarfing its Professional Services at $75M. Strategy Inc’s diversified model reduces concentration risk, while DocuSign’s dominance in subscription locks in customers but increases exposure to single-segment volatility.
Strengths and Weaknesses Comparison
This table compares the Strengths and Weaknesses of Strategy Inc and DocuSign, Inc.:
Strategy Inc Strengths
- Diversified revenue across License, Maintenance, Subscription, and Technology Services
- Moderate debt-to-assets at 28% supports financial stability
- Strong fixed asset turnover at 5.73 indicates efficient asset use
DocuSign, Inc. Strengths
- High net margin at 36% demonstrates strong profitability
- Robust ROE at 53% reflects effective capital use
- Low debt-to-assets ratio at 3.1% minimizes financial risk
- Very high interest coverage at 161 shows strong earnings to cover debt
- Strong fixed asset turnover at 7.28 signals operational efficiency
Strategy Inc Weaknesses
- Negative net margin (-252%) and ROE (-6.4%) indicate poor profitability
- Low current and quick ratios (0.71) suggest liquidity concerns
- Negative interest coverage risks financial distress
- High price-to-book at 3.06 hints at overvaluation
- Asset turnover extremely low at 0.02 reflects weak revenue generation
DocuSign, Inc. Weaknesses
- Elevated price-to-book at 9.87 signals potential overvaluation
- Current ratio below 1 (0.81) raises short-term liquidity questions
- Zero dividend yield may deter income-focused investors
Strategy Inc’s strengths lie in diversified revenue and moderate leverage but suffer from poor profitability and liquidity. DocuSign shows strong profitability and low leverage but faces valuation and liquidity challenges. Both companies must address their financial weaknesses to support sustainable growth.
The Moat Duel: Analyzing Competitive Defensibility
A structural moat protects long-term profits from relentless competition and market disruption. Let’s analyze the competitive barriers for these two tech firms:
Strategy Inc: Intangible Assets and Bitcoin Exposure
Strategy Inc’s moat hinges on unique intangible assets, notably its AI analytics and bitcoin treasury positioning. Despite negative net margins, its high gross margin (69%) shows product strength. The 2026 outlook is mixed as bitcoin volatility could deepen or erode this advantage.
DocuSign, Inc.: Network Effects and Workflow Integration
DocuSign leverages strong network effects and deep workflow integration across legal and sales functions. Its robust margin profile (79% gross, 36% net) and accelerating revenue growth underscore improving profitability. Expansion in AI-driven contract lifecycle management promises to extend its moat.
Moat Battle: Intangible Assets vs. Network Effects
DocuSign exhibits a deeper, more sustainable moat with improving ROIC trends and margin expansion. Strategy Inc faces a fragile moat, pressured by declining returns and bitcoin exposure. DocuSign is better positioned to defend and grow its market share in 2026.
Which stock offers better returns?
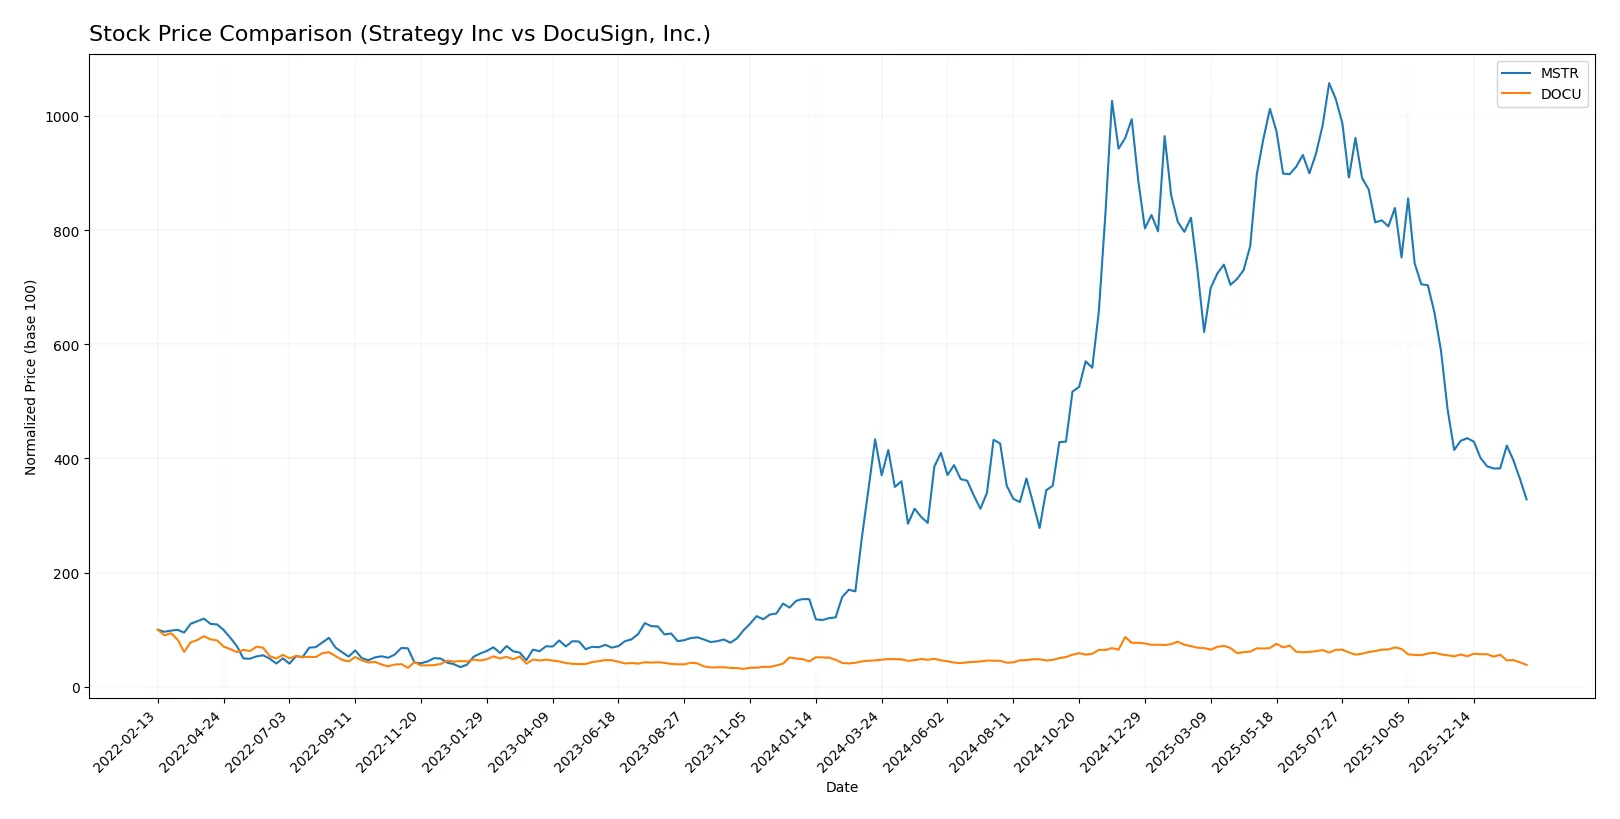
Over the past 12 months, both Strategy Inc and DocuSign, Inc. experienced notable price declines, with distinct trading volume shifts and decelerating bearish trends.
Trend Comparison
Strategy Inc’s stock price fell 24.3% over the last year, marking a bearish trend with decelerating momentum. Its high volatility is reflected in a 101.34 standard deviation and a wide price range from 114.3 to 434.58.
DocuSign, Inc. dropped 16.98% during the same period, also bearish with deceleration. Volatility is far lower than Strategy Inc, with a 13.07 standard deviation and prices ranging from 47.13 to 106.99.
Strategy Inc’s larger decline and higher volatility contrast with DocuSign’s milder loss. DocuSign delivered better market performance, despite both stocks trending downward.
Target Prices
Analysts present a wide but insightful range of target prices, reflecting varying growth expectations and risk assessments.
| Company | Target Low | Target High | Consensus |
|---|---|---|---|
| Strategy Inc | 175 | 705 | 374.5 |
| DocuSign, Inc. | 70 | 88 | 76.86 |
Strategy Inc’s consensus target of 374.5 significantly exceeds its current 135 price, signaling strong upside potential. DocuSign’s target consensus near 77 also suggests room for appreciation from the current 47 level.

Don’t Let Luck Decide Your Entry Point
Optimize your entry points with our advanced ProRealTime indicators. You’ll get efficient buy signals with precise price targets for maximum performance. Start outperforming now!
How do institutions grade them?
Strategy Inc Grades
The following table summarizes recent grade actions by reliable grading firms for Strategy Inc:
| Grading Company | Action | New Grade | Date |
|---|---|---|---|
| BTIG | Maintain | Buy | 2026-02-06 |
| Canaccord Genuity | Maintain | Buy | 2026-02-04 |
| Mizuho | Maintain | Outperform | 2026-01-16 |
| TD Cowen | Maintain | Buy | 2026-01-15 |
| Citigroup | Maintain | Buy | 2025-12-22 |
| Bernstein | Maintain | Outperform | 2025-12-08 |
| Monness, Crespi, Hardt | Upgrade | Neutral | 2025-11-10 |
| Canaccord Genuity | Maintain | Buy | 2025-11-03 |
| HC Wainwright & Co. | Maintain | Buy | 2025-11-03 |
| TD Cowen | Maintain | Buy | 2025-10-31 |
DocuSign, Inc. Grades
The following table summarizes recent grade actions by reliable grading firms for DocuSign, Inc.:
| Grading Company | Action | New Grade | Date |
|---|---|---|---|
| RBC Capital | Maintain | Sector Perform | 2026-01-05 |
| Piper Sandler | Maintain | Neutral | 2025-12-05 |
| RBC Capital | Maintain | Sector Perform | 2025-12-05 |
| B of A Securities | Maintain | Neutral | 2025-12-05 |
| Needham | Maintain | Hold | 2025-12-05 |
| Wedbush | Maintain | Neutral | 2025-12-05 |
| Evercore ISI Group | Maintain | In Line | 2025-12-05 |
| UBS | Maintain | Neutral | 2025-12-05 |
| JP Morgan | Maintain | Neutral | 2025-12-05 |
| Wells Fargo | Maintain | Equal Weight | 2025-12-05 |
Which company has the best grades?
Strategy Inc consistently earns Buy and Outperform ratings from respected firms, indicating stronger institutional confidence. DocuSign, Inc. holds mostly Neutral and Hold grades, suggesting more cautious sentiment. Investors may interpret Strategy Inc’s higher grades as a sign of superior growth or stability prospects.
Risks specific to each company
The following categories identify the critical pressure points and systemic threats facing both firms in the 2026 market environment:
1. Market & Competition
Strategy Inc
- Operates in bitcoin treasury and enterprise analytics, facing volatile crypto market and fintech competition.
DocuSign, Inc.
- Competes in electronic signature software with established rivals and evolving cloud solutions.
2. Capital Structure & Debt
Strategy Inc
- Moderate debt-to-assets at 28%, but weak interest coverage signals risk servicing debt.
DocuSign, Inc.
- Low debt-to-assets at 3.1%, robust interest coverage of 161x ensures strong financial flexibility.
3. Stock Volatility
Strategy Inc
- High beta of 3.54 indicates elevated volatility and sensitivity to market swings.
DocuSign, Inc.
- Beta near 1.01 suggests moderate volatility aligned with overall market movements.
4. Regulatory & Legal
Strategy Inc
- Bitcoin exposure risks regulatory scrutiny and evolving crypto laws internationally.
DocuSign, Inc.
- Faces privacy and compliance regulations in digital signatures but benefits from FedRAMP authorization.
5. Supply Chain & Operations
Strategy Inc
- Relies on data infrastructure and AI software delivery; crypto market instability may disrupt operations.
DocuSign, Inc.
- Operates cloud-based SaaS with scalable infrastructure; operational risks tied to platform security and uptime.
6. ESG & Climate Transition
Strategy Inc
- Crypto operations often criticized for high energy use; ESG pressures could increase costs.
DocuSign, Inc.
- SaaS model is less carbon-intensive; increasing focus on sustainable cloud practices.
7. Geopolitical Exposure
Strategy Inc
- Global bitcoin exposure subjects it to geopolitical shifts affecting crypto regulations.
DocuSign, Inc.
- International operations face data sovereignty laws and geopolitical tensions impacting digital agreements.
Which company shows a better risk-adjusted profile?
Strategy Inc’s greatest risk lies in its volatile crypto market exposure and weak interest coverage, raising financial distress concerns. DocuSign faces valuation risk with high P/B ratios but benefits from stable cash flows and strong debt metrics. Overall, DocuSign exhibits a superior risk-adjusted profile, supported by a safe-zone Altman Z-Score of 3.09 versus Strategy Inc’s grey-zone 2.30. This underscores DocuSign’s stronger financial resilience amid market uncertainties in 2026.
Final Verdict: Which stock to choose?
Strategy Inc’s superpower lies in its resilience through volatile cycles, backed by strong fixed asset turnover. Yet, its declining profitability and liquidity pose a point of vigilance. This stock might suit aggressive growth portfolios willing to weather operational risks for potential turnaround gains.
DocuSign, Inc. benefits from a clear strategic moat in recurring revenue and steadily improving profitability. Its financial stability outshines Strategy Inc’s, with superior cash flow and capital efficiency. This makes it appealing for investors seeking GARP—growth at a reasonable price with better downside protection.
If you prioritize high-risk, high-reward plays with a focus on operational efficiency, Strategy Inc could be compelling despite its financial headwinds. However, if you seek stability coupled with growth and a more favorable risk profile, DocuSign offers better consistency and a gradually strengthening moat. Both require close monitoring of their evolving fundamentals.
Disclaimer: Investment carries a risk of loss of initial capital. The past performance is not a reliable indicator of future results. Be sure to understand risks before making an investment decision.
Go Further
I encourage you to read the complete analyses of Strategy Inc and DocuSign, Inc. to enhance your investment decisions: