In the fast-evolving software industry, PTC Inc. and DocuSign, Inc. stand out as leaders driving digital transformation and workflow innovation. Both companies operate in the application software space with strong market presence and cutting-edge solutions—PTC with its industrial digital platforms and DocuSign with its electronic signature and agreement cloud services. This article will analyze their strategies and financials to help you decide which company may be a smarter investment choice in 2026.
Table of contents
Companies Overview
I will begin the comparison between PTC Inc. and DocuSign, Inc. by providing an overview of these two companies and their main differences.
PTC Inc. Overview
PTC Inc. is a technology company specializing in software and services for digital transformation across the Americas, Europe, and Asia Pacific. It offers platforms like ThingWorx for IoT, Vuforia for augmented reality, and Onshape for product development, alongside product lifecycle management and application lifecycle management solutions. Founded in 1985 and based in Boston, PTC serves enterprises with scalable and innovative digital tools.
DocuSign, Inc. Overview
DocuSign, Inc. provides electronic signature software and agreement cloud solutions worldwide, enabling businesses to digitally prepare, sign, and manage contracts. Its offerings include AI-driven contract lifecycle management, guided forms, remote online notarization, and industry-specific cloud products. Incorporated in 2003 and headquartered in San Francisco, DocuSign serves enterprises, commercial, and small businesses through direct and partner-assisted sales.
Key similarities and differences
Both PTC and DocuSign operate in the software application industry, focusing on digital transformation and automation for enterprises. PTC emphasizes product design, lifecycle management, and augmented reality, while DocuSign specializes in digital agreements and contract management with AI integration. PTC’s solutions cater more to product development processes, whereas DocuSign targets workflow automation in legal and business agreements.
Income Statement Comparison
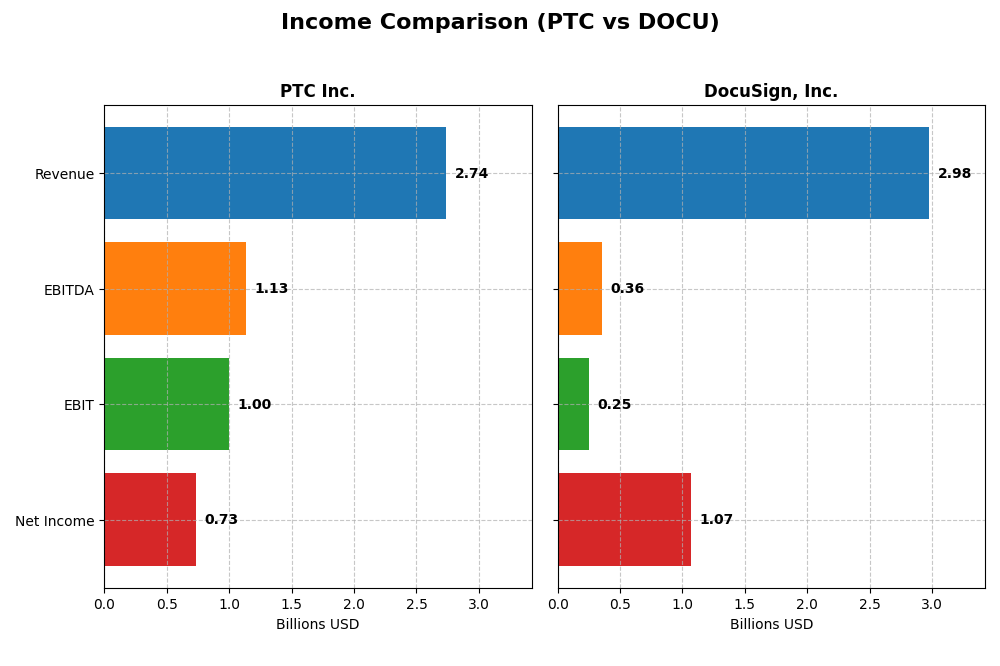
The table below compares the most recent fiscal year income statement metrics for PTC Inc. and DocuSign, Inc., highlighting key financial figures to facilitate a clear comparison.
| Metric | PTC Inc. | DocuSign, Inc. |
|---|---|---|
| Market Cap | 19.9B | 11.4B |
| Revenue | 2.74B | 3.0B |
| EBITDA | 1.13B | 357M |
| EBIT | 997M | 249M |
| Net Income | 734M | 1.07B |
| EPS | 6.18 | 5.23 |
| Fiscal Year | 2025 | 2025 |
Income Statement Interpretations
PTC Inc.
PTC Inc. shows strong revenue growth from $1.81B in 2021 to $2.74B in 2025, with net income increasing from $477M to $734M. Margins remain robust, with a gross margin of 83.76% and a net margin of 26.8% in 2025, reflecting stable profitability. The latest year saw a 19.18% revenue growth and nearly doubled EPS, indicating accelerating earnings and margin improvement.
DocuSign, Inc.
DocuSign’s revenue rose significantly from $1.45B in 2021 to $2.98B in 2025, while net income swung from a loss of $243M to a $1.07B profit. Gross margin is solid at 79.12%, though EBIT margin is moderate at 8.38%. The most recent year showed moderate revenue growth of 7.78%, but net margin and EPS surged dramatically, signaling strong operational leverage and profitability gains.
Which one has the stronger fundamentals?
Both companies demonstrate favorable income statement trends with solid revenue and profit growth. PTC maintains higher and more stable margins, reflecting consistent profitability. DocuSign exhibits stronger overall revenue and net income growth rates, especially in net margin and EPS, despite lower EBIT margin. The choice depends on prioritizing margin stability versus growth acceleration.
Financial Ratios Comparison
The table below presents a side-by-side comparison of key financial ratios for PTC Inc. and DocuSign, Inc., based on their most recent full fiscal year data.
| Ratios | PTC Inc. (2025) | DocuSign, Inc. (2025) |
|---|---|---|
| ROE | 19.18% | 53.32% |
| ROIC | 14.43% | 9.09% |
| P/E | 33.19 | 18.51 |
| P/B | 6.37 | 9.87 |
| Current Ratio | 1.12 | 0.81 |
| Quick Ratio | 1.12 | 0.81 |
| D/E (Debt to Equity) | 0.36 | 0.06 |
| Debt-to-Assets | 20.70% | 3.10% |
| Interest Coverage | 12.76 | 128.99 |
| Asset Turnover | 0.41 | 0.74 |
| Fixed Asset Turnover | 15.58 | 7.28 |
| Payout ratio | 0 | 0 |
| Dividend yield | 0% | 0% |
Interpretation of the Ratios
PTC Inc.
PTC displays a generally favorable financial profile with strong net margin (26.8%), ROE (19.18%), and ROIC (14.43%). However, its high P/E (33.19) and P/B (6.37) ratios suggest the stock is relatively expensive. The company shows healthy balance sheet metrics such as a low debt-to-equity ratio (0.36) and solid interest coverage (12.95). PTC does not pay dividends, indicating a focus on reinvestment and growth rather than shareholder payouts.
DocuSign, Inc.
DocuSign exhibits high profitability with a net margin of 35.87% and an exceptional ROE of 53.32%. Its ROIC is neutral at 9.09%, and the company maintains very low leverage (debt-to-assets 3.1%). The current ratio is weaker at 0.81, signaling lower short-term liquidity. DocuSign also does not pay dividends, likely prioritizing growth and R&D investments over immediate shareholder returns.
Which one has the best ratios?
PTC holds a more balanced ratio profile with a majority of favorable ratings and moderate leverage, though its valuation multiples are high. DocuSign shows stronger profitability metrics and lower debt but weaker liquidity and higher valuation concerns. Overall, PTC’s ratios are assessed as favorable, while DocuSign’s are slightly favorable, reflecting different financial strengths and risks.
Strategic Positioning
This section compares the strategic positioning of PTC Inc. and DocuSign, Inc. in terms of Market position, Key segments, and Exposure to technological disruption:
PTC Inc.
- Larger market cap (~$19.9B) with diversified software products and services; faces competition in software application sector.
- Key segments include software licenses, support and cloud services, and technology services driving growth and diversification.
- Invests in digital transformation platforms, augmented reality, and SaaS products, maintaining relevance amid technological changes.
DocuSign, Inc.
- Smaller market cap (~$11.4B) focused on electronic signature software; competitive in digital agreement management.
- Revenue mainly from subscription and circulation services, supported by professional services and industry-specific offerings.
- Provides AI-driven contract lifecycle management and cloud-based digital signature solutions, adapting to evolving tech trends.
PTC Inc. vs DocuSign, Inc. Positioning
PTC exhibits a diversified business model across multiple software and service segments, offering scalability and innovation in digital transformation. DocuSign concentrates on electronic signature and contract management, focusing on subscription-based revenues with AI enhancements. Diversification versus specialization defines their strategic contrast.
Which has the best competitive advantage?
PTC shows a very favorable moat with consistent value creation and growing ROIC, indicating a durable competitive advantage. DocuSign’s moat is slightly favorable; it has growing profitability but currently sheds value, signaling a less established competitive edge.
Stock Comparison
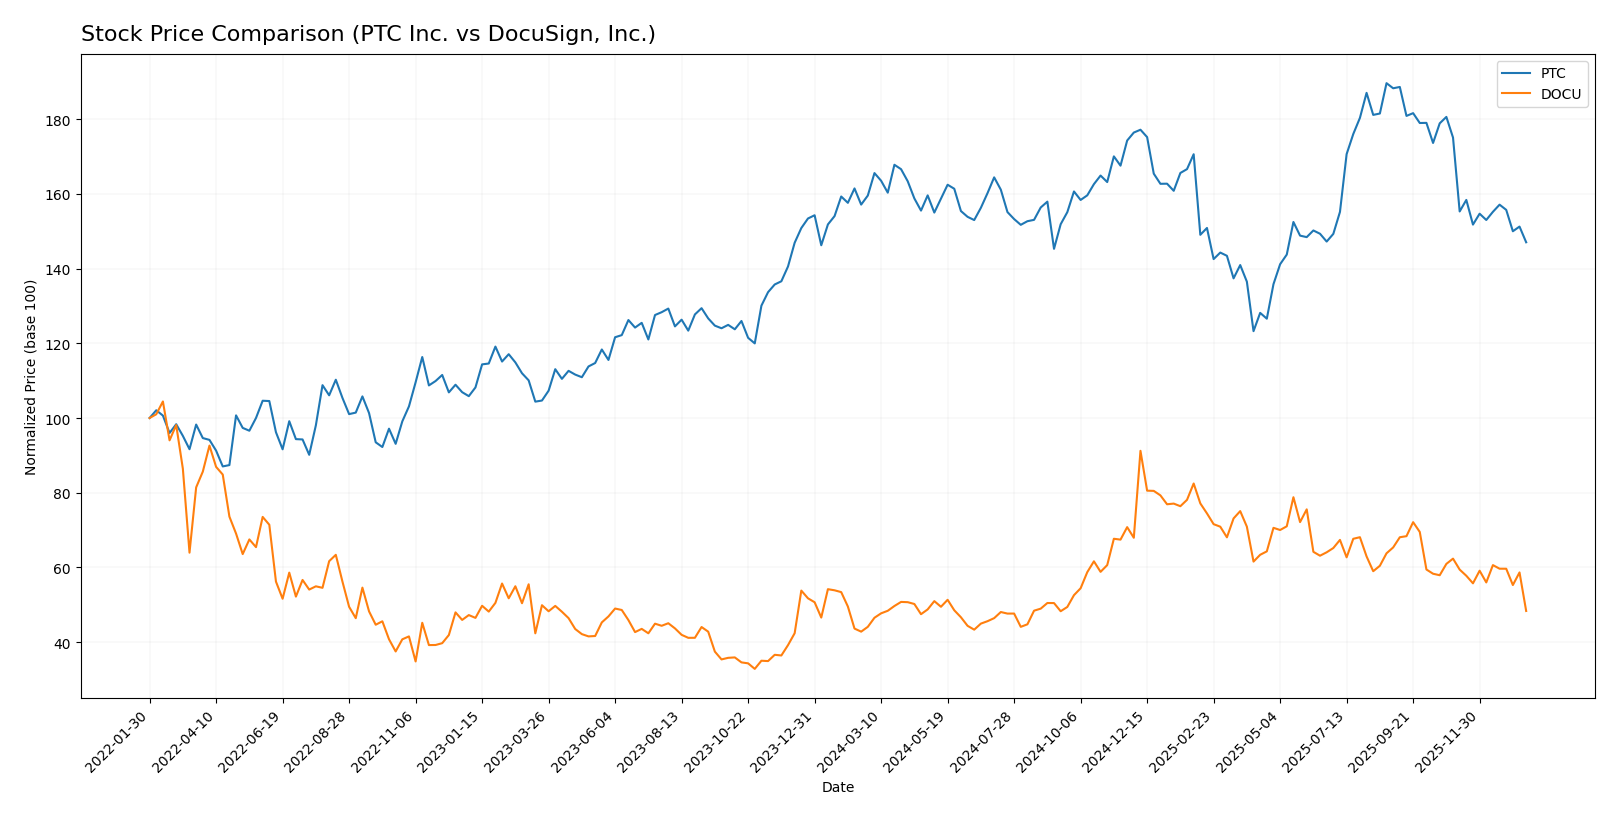
The stock price movements of PTC Inc. and DocuSign, Inc. over the past 12 months reveal contrasting trends, marked by PTC’s bearish trajectory and DocuSign’s overall bullish momentum, with both experiencing recent downturns in trading dynamics.
Trend Analysis
PTC Inc. showed a bearish trend with a -7.84% price change over the past year, accompanied by high volatility (std deviation 15.47), a deceleration in trend, and a recent sharper decline of -16.01%.
DocuSign, Inc. experienced a bullish trend over the past year with a 9.63% price increase, moderate volatility (std deviation 12.98), and decelerating momentum. However, its recent trend also turned negative with a -22.46% drop.
Comparing both stocks, DocuSign delivered the highest market performance over the full year despite recent weakness, while PTC recorded a consistent decline with greater volatility.
Target Prices
Analysts present a positive target consensus for PTC Inc. and DocuSign, Inc., indicating potential upside from current levels.
| Company | Target High | Target Low | Consensus |
|---|---|---|---|
| PTC Inc. | 255 | 120 | 213.25 |
| DocuSign, Inc. | 88 | 70 | 76.86 |
The consensus target for PTC Inc. at 213.25 USD suggests upside versus its current price of 166.75 USD. DocuSign’s consensus target of 76.86 USD also indicates potential growth from its present price of 56.71 USD. Both stocks show analyst optimism despite some price volatility.
Analyst Opinions Comparison
This section compares analysts’ ratings and grades for PTC Inc. and DocuSign, Inc.:
Rating Comparison
PTC Rating
- Rating: B+, considered very favorable by analysts.
- Discounted Cash Flow Score: 4, showing favorable valuation based on cash flow.
- ROE Score: 4, favorable efficiency in generating profit from equity.
- ROA Score: 5, very favorable use of assets to generate earnings.
- Debt To Equity Score: 2, moderate financial risk with higher leverage.
DOCU Rating
- Rating: B+, considered very favorable by analysts.
- Discounted Cash Flow Score: 5, indicating a very favorable valuation.
- ROE Score: 4, favorable efficiency in generating profit from equity.
- ROA Score: 4, favorable use of assets to generate earnings.
- Debt To Equity Score: 3, moderate financial risk but less leverage than PTC.
Which one is the best rated?
Both companies share the same overall rating of B+ and overall score of 3, reflecting moderate standing. DocuSign leads in discounted cash flow valuation and has a better debt-to-equity score, while PTC excels in asset utilization.
Scores Comparison
Here is a comparison of the Altman Z-Score and Piotroski Score for PTC and DocuSign:
PTC Scores
- Altman Z-Score: 5.67, indicating a safe zone with low bankruptcy risk.
- Piotroski Score: 8, classified as very strong, indicating solid financial health.
DocuSign Scores
- Altman Z-Score: 4.43, also in the safe zone, showing financial stability.
- Piotroski Score: 5, an average rating reflecting moderate financial strength.
Which company has the best scores?
PTC has higher scores in both Altman Z-Score and Piotroski Score, placing it in a safer financial position with stronger financial health compared to DocuSign, based on the provided data.
Grades Comparison
Here is a comparison of the recent grades assigned to PTC Inc. and DocuSign, Inc.:
PTC Inc. Grades
The following table summarizes recent grades awarded to PTC Inc. by reputable grading companies.
| Grading Company | Action | New Grade | Date |
|---|---|---|---|
| Piper Sandler | Maintain | Neutral | 2025-11-07 |
| Rosenblatt | Maintain | Buy | 2025-11-06 |
| Rosenblatt | Maintain | Buy | 2025-10-30 |
| Oppenheimer | Maintain | Outperform | 2025-07-31 |
| Rosenblatt | Maintain | Buy | 2025-07-31 |
| Barclays | Maintain | Overweight | 2025-07-31 |
| Stifel | Maintain | Buy | 2025-07-31 |
| Keybanc | Maintain | Overweight | 2025-07-31 |
| RBC Capital | Maintain | Outperform | 2025-07-31 |
| Piper Sandler | Maintain | Neutral | 2025-07-31 |
PTC Inc. shows a strong consensus of buy and outperform ratings from multiple respected firms, reflecting a generally positive view.
DocuSign, Inc. Grades
Below is a summary of recent grades assigned to DocuSign, Inc. by established grading firms.
| Grading Company | Action | New Grade | Date |
|---|---|---|---|
| RBC Capital | Maintain | Sector Perform | 2026-01-05 |
| Evercore ISI Group | Maintain | In Line | 2025-12-05 |
| UBS | Maintain | Neutral | 2025-12-05 |
| Wells Fargo | Maintain | Equal Weight | 2025-12-05 |
| Piper Sandler | Maintain | Neutral | 2025-12-05 |
| RBC Capital | Maintain | Sector Perform | 2025-12-05 |
| JP Morgan | Maintain | Neutral | 2025-12-05 |
| B of A Securities | Maintain | Neutral | 2025-12-05 |
| Needham | Maintain | Hold | 2025-12-05 |
| Baird | Maintain | Neutral | 2025-12-05 |
DocuSign’s grades largely cluster around hold, neutral, and sector perform, indicating a more cautious outlook.
Which company has the best grades?
PTC Inc. has received notably stronger grades, with a consensus of “Buy” supported by numerous buy, outperform, and overweight ratings. DocuSign, by contrast, holds a consensus of “Hold” with mostly neutral and sector perform grades. This differential suggests that investors might view PTC as having better growth or value potential, whereas DocuSign appears to present a more conservative risk-return profile.
Strengths and Weaknesses
Below is a comparative overview of key strengths and weaknesses for PTC Inc. and DocuSign, Inc. based on the most recent financial and operational data.
| Criterion | PTC Inc. | DocuSign, Inc. |
|---|---|---|
| Diversification | Strong product mix: License, Technology Services, Support and Cloud Services with steady growth | Primarily subscription-based with professional services; less diversified |
| Profitability | High net margin (26.8%) and ROE (19.18%); creating value with ROIC > WACC | Very high net margin (35.87%) and ROE (53.32%), but ROIC near WACC indicating slight value erosion |
| Innovation | Durable competitive advantage with growing ROIC (42% increase over 5 years) | Improving profitability with rapidly growing ROIC (168%), but still slightly unfavorable moat |
| Global presence | Established global footprint through diversified tech services | Strong global SaaS presence, but less product variety limits reach |
| Market Share | Solid in industrial software with expanding cloud services | Leading in e-signature market with subscription dominance |
Key takeaways: PTC demonstrates a more balanced and durable competitive advantage with strong profitability and diversification, making it a safer value creator. DocuSign shows impressive growth and profitability but remains slightly vulnerable due to limited diversification and a less established economic moat.
Risk Analysis
The table below summarizes key risks for PTC Inc. and DocuSign, Inc. based on the most recent data from 2025-2026.
| Metric | PTC Inc. | DocuSign, Inc. |
|---|---|---|
| Market Risk | Moderate beta at 1.014; software sector volatility | Beta near 1.0; highly competitive SaaS market |
| Debt Level | Low debt-to-equity (0.36), favorable leverage | Very low debt-to-equity (0.06), minimal financial risk |
| Regulatory Risk | Moderate; software compliance and global operations | Moderate; privacy and data security regulations impact |
| Operational Risk | Dependence on innovation and cloud services | Reliance on continuous platform reliability and scalability |
| Environmental Risk | Low; primarily software business with limited physical footprint | Low; digital services reduce direct environmental impact |
| Geopolitical Risk | Exposure to Americas, Europe, Asia-Pacific markets | Primarily US-based but with international clients |
PTC’s key risks stem from moderate market volatility and reliance on innovation, though its solid balance sheet and strong profitability mitigate financial risks. DocuSign faces regulatory pressure related to data security and must maintain platform reliability amid intense competition. Both companies maintain low debt levels, reducing financial distress risks.
Which Stock to Choose?
PTC Inc. shows a favorable income evolution with strong revenue and net income growth over 2021–2025. Its financial ratios reveal solid profitability, manageable debt levels, and a very favorable overall rating of B+. The company demonstrates a durable competitive advantage with a very favorable MOAT status.
DocuSign, Inc. also displays favorable income growth, particularly in net margin and EPS, though revenue growth is more moderate. Its financial ratios are slightly less favorable, with some neutrality and a B+ rating as well. The MOAT evaluation is slightly favorable, indicating growing profitability but no clear competitive moat yet.
Investors seeking a durable competitive advantage and stable profitability might find PTC’s profile more aligned with quality investing. Conversely, those interested in rapid income growth with improving profitability could see DocuSign as appealing for growth-oriented strategies. The choice may depend on the investor’s risk tolerance and focus on competitive moat strength.
Disclaimer: Investment carries a risk of loss of initial capital. The past performance is not a reliable indicator of future results. Be sure to understand risks before making an investment decision.
Go Further
I encourage you to read the complete analyses of PTC Inc. and DocuSign, Inc. to enhance your investment decisions: