In the rapidly evolving software application sector, DocuSign, Inc. and Paycom Software, Inc. stand out as leaders with distinct yet overlapping market appeals. DocuSign specializes in digital agreement management, while Paycom delivers comprehensive cloud-based human capital management solutions. Both companies emphasize innovation and customer-centric technology, making them compelling candidates for investors seeking growth in enterprise software. This article will help you determine which company offers the most attractive investment opportunity in 2026.
Table of contents
Companies Overview
I will begin the comparison between DocuSign and Paycom by providing an overview of these two companies and their main differences.
DocuSign Overview
DocuSign, Inc. specializes in electronic signature software, enabling businesses to digitally prepare, sign, and manage agreements globally. Its product suite includes AI-driven contract lifecycle management and industry-specific cloud offerings, serving enterprise, commercial, and small businesses. Founded in 2003 and headquartered in San Francisco, DocuSign has a market capitalization of approximately 11.4B USD and employs around 6,838 people.
Paycom Overview
Paycom Software, Inc. provides cloud-based human capital management (HCM) solutions as software-as-a-service to small and mid-sized U.S. companies. Its platform manages the employment lifecycle from recruitment through retirement, offering payroll, talent acquisition, time management, and benefits administration tools. Founded in 1998 and based in Oklahoma City, Paycom has a market capitalization near 8.3B USD and employs roughly 7,306 staff.
Key similarities and differences
Both DocuSign and Paycom operate in the software application industry and offer cloud-based solutions targeting business process automation. DocuSign focuses on digital agreement management and electronic signatures, while Paycom specializes in comprehensive HCM solutions. DocuSign serves a broader range of business sizes and industries, whereas Paycom targets primarily small to mid-sized firms within the U.S. market. Their differing product focuses reflect distinct customer needs within the enterprise software sector.
Income Statement Comparison
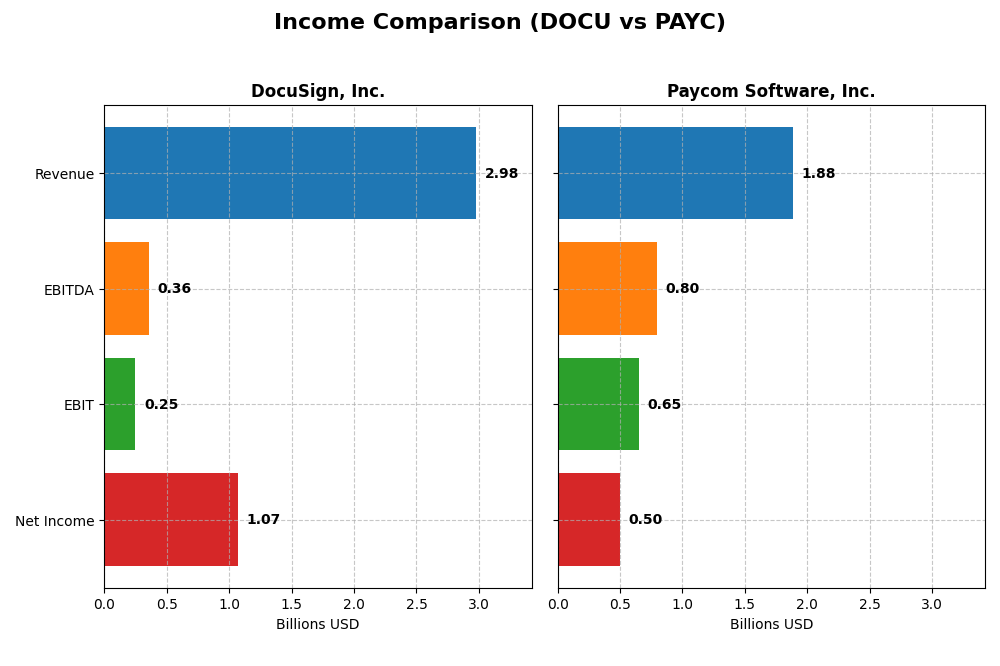
The table below presents a side-by-side comparison of key income statement metrics for DocuSign, Inc. and Paycom Software, Inc. for their most recent fiscal years.
| Metric | DocuSign, Inc. (DOCU) | Paycom Software, Inc. (PAYC) |
|---|---|---|
| Market Cap | 11.4B | 8.3B |
| Revenue | 2.98B | 1.88B |
| EBITDA | 357M | 798M |
| EBIT | 249M | 652M |
| Net Income | 1.07B | 502M |
| EPS | 5.23 | 8.93 |
| Fiscal Year | 2025 | 2024 |
Income Statement Interpretations
DocuSign, Inc.
DocuSign’s revenue grew steadily from $1.45B in 2021 to nearly $3B in 2025, with net income swinging from a loss of $243M in 2021 to a gain of $1.07B in 2025. Gross margin remains strong around 79%, while EBIT margin stayed neutral but improved significantly in the latest year. The 2025 performance showed slower revenue growth but marked improvements in profitability and margins.
Paycom Software, Inc.
Paycom’s revenue rose consistently from $841M in 2020 to $1.88B in 2024, with net income increasing from $143M to $502M in the same period. Margins are robust, with gross margin above 82% and EBIT margin at 34.6%, both favorable. In 2024, Paycom experienced solid revenue growth and margin expansion, reflecting efficient cost management and strong operational performance.
Which one has the stronger fundamentals?
Both companies demonstrate favorable income statement trends and margin stability, but Paycom exhibits higher and more consistent EBIT and net margins, alongside 100% favorable income evaluations. DocuSign shows remarkable net income growth and margin recovery but with more variability. Overall, Paycom’s fundamentals appear steadier, while DocuSign reflects strong turnaround potential.
Financial Ratios Comparison
The table below presents a side-by-side comparison of key financial ratios for DocuSign, Inc. and Paycom Software, Inc. based on their most recent fiscal year data.
| Ratios | DocuSign, Inc. (DOCU) FY 2025 | Paycom Software, Inc. (PAYC) FY 2024 |
|---|---|---|
| ROE | 53.3% | 31.9% |
| ROIC | 9.1% | 24.9% |
| P/E | 18.5 | 22.9 |
| P/B | 9.87 | 7.31 |
| Current Ratio | 0.81 | 1.10 |
| Quick Ratio | 0.81 | 1.10 |
| D/E | 0.06 | 0.05 |
| Debt-to-Assets | 3.1% | 1.4% |
| Interest Coverage | 129 | 187 |
| Asset Turnover | 0.74 | 0.32 |
| Fixed Asset Turnover | 7.28 | 2.93 |
| Payout Ratio | 0 | 16.9% |
| Dividend Yield | 0 | 0.74% |
Interpretation of the Ratios
DocuSign, Inc.
DocuSign shows a mix of strong and weak financial ratios. Its net margin and return on equity are favorable at 35.87% and 53.32%, respectively, indicating profitability and efficient equity use. However, the low current ratio of 0.81 and a high price-to-book ratio of 9.87 raise liquidity and valuation concerns. DocuSign does not pay dividends, likely reflecting a reinvestment strategy or growth focus.
Paycom Software, Inc.
Paycom exhibits predominantly favorable ratios, with a net margin of 26.66% and return on equity at 31.85%, signaling solid profitability and shareholder value. Its current and quick ratios near 1.1 suggest reasonable liquidity, though asset turnover at 0.32 is weak. The company pays dividends with a 0.74% yield, supported by a prudent payout ratio and sustainable cash flow coverage.
Which one has the best ratios?
Comparing both, Paycom demonstrates a more favorable overall ratio profile, with 57.14% favorable metrics against DocuSign’s 42.86%. Paycom’s stronger liquidity, consistent profitability, and dividend payments contrast with DocuSign’s weaker liquidity and lack of dividends. Yet, DocuSign excels in return on equity, showing strong capital efficiency despite some liquidity challenges.
Strategic Positioning
This section compares the strategic positioning of DocuSign, Inc. and Paycom Software, Inc., focusing on market position, key segments, and exposure to technological disruption:
DocuSign, Inc.
- Leading in e-signature software with significant competitive pressure in digital agreement management.
- Key business drivers are subscription services for digital agreements and professional services.
- Uses AI-driven contract lifecycle management and digital verification technologies to mitigate disruption.
Paycom Software, Inc.
- Focused on cloud-based HCM software with moderate competition in small to mid-sized US companies.
- Revenue mainly from recurring cloud-based HCM solutions with additional implementation services.
- Integrates advanced analytics and proprietary Bluetooth technology within workforce management solutions.
DocuSign vs Paycom Positioning
DocuSign has a diversified digital agreement platform covering various industries, while Paycom concentrates on human capital management for SMBs. DocuSign’s broad suite offers scale benefits; Paycom’s focused approach delivers specialized workforce solutions, each with distinct market dynamics and growth drivers.
Which has the best competitive advantage?
Paycom demonstrates a very favorable moat with ROIC significantly above WACC and growing profitability, indicating a durable competitive advantage. DocuSign shows a slightly favorable moat with increasing ROIC but currently sheds value relative to its cost of capital.
Stock Comparison
The stock prices of DocuSign, Inc. (DOCU) and Paycom Software, Inc. (PAYC) over the past 12 months reveal contrasting trajectories, with DOCU showing overall gains despite recent declines, while PAYC has faced sustained losses and higher volatility.

Trend Analysis
DocuSign’s stock exhibited a bullish trend over the past year with a 9.63% price increase, though the momentum decelerated. The stock ranged between 50.84 and 106.99, with recent weeks showing a sharp 22.46% decline.
Paycom’s stock followed a bearish trend with a 19.64% decrease over the year and decelerating losses. It experienced higher volatility, ranging from 141.96 to 265.71, and a recent 20.67% drop indicating persistent downward pressure.
Comparing both, DocuSign delivered the highest market performance with a positive yearly return, while Paycom’s stock suffered notable declines, reflecting a weaker market stance over the analyzed period.
Target Prices
The current target price consensus for DocuSign, Inc. and Paycom Software, Inc. shows a positive outlook from analysts.
| Company | Target High | Target Low | Consensus |
|---|---|---|---|
| DocuSign, Inc. | 88 | 70 | 76.86 |
| Paycom Software, Inc. | 290 | 165 | 215 |
Analysts expect both stocks to appreciate, with DocuSign’s consensus target roughly 35% above its current price of $56.71, and Paycom’s target about 45% above its current $148.41 price. This suggests potential upside for investors considering these software application leaders.
Analyst Opinions Comparison
This section compares analysts’ ratings and grades for DocuSign, Inc. and Paycom Software, Inc.:
Rating Comparison
DocuSign, Inc. Rating
- Rating: B+, categorized as Very Favorable
- Discounted Cash Flow Score: 5, Very Favorable
- ROE Score: 4, Favorable
- ROA Score: 4, Favorable
- Debt To Equity Score: 3, Moderate
- Overall Score: 3, Moderate
Paycom Software, Inc. Rating
- Rating: A, categorized as Very Favorable
- Discounted Cash Flow Score: 5, Very Favorable
- ROE Score: 5, Very Favorable
- ROA Score: 5, Very Favorable
- Debt To Equity Score: 4, Favorable
- Overall Score: 4, Favorable
Which one is the best rated?
Based on the provided data, Paycom Software, Inc. holds a higher overall rating and superior scores in return on equity, return on assets, and debt to equity compared to DocuSign, Inc. Paycom’s rating is therefore stronger in this comparison.
Scores Comparison
Here is a direct comparison of DocuSign and Paycom Software’s financial scores:
DocuSign Scores
- Altman Z-Score: 4.43, indicating a safe zone
- Piotroski Score: 5, classified as average
Paycom Scores
- Altman Z-Score: 3.84, indicating a safe zone
- Piotroski Score: 5, classified as average
Which company has the best scores?
Both DocuSign and Paycom are in the safe zone for the Altman Z-Score, with DocuSign slightly higher. Their Piotroski Scores are identical at 5, indicating average financial strength for both companies.
Grades Comparison
The following presents a comparison of recent grades assigned to DocuSign, Inc. and Paycom Software, Inc.:
DocuSign, Inc. Grades
This table summarizes the latest grades from recognized financial institutions for DocuSign, Inc.
| Grading Company | Action | New Grade | Date |
|---|---|---|---|
| RBC Capital | Maintain | Sector Perform | 2026-01-05 |
| Evercore ISI Group | Maintain | In Line | 2025-12-05 |
| UBS | Maintain | Neutral | 2025-12-05 |
| Wells Fargo | Maintain | Equal Weight | 2025-12-05 |
| Piper Sandler | Maintain | Neutral | 2025-12-05 |
| RBC Capital | Maintain | Sector Perform | 2025-12-05 |
| JP Morgan | Maintain | Neutral | 2025-12-05 |
| B of A Securities | Maintain | Neutral | 2025-12-05 |
| Needham | Maintain | Hold | 2025-12-05 |
| Baird | Maintain | Neutral | 2025-12-05 |
DocuSign’s grades show a consistent pattern of hold and neutral ratings, reflecting a cautious stance by analysts.
Paycom Software, Inc. Grades
Below is a summary of recent grades from reputable grading companies for Paycom Software, Inc.
| Grading Company | Action | New Grade | Date |
|---|---|---|---|
| Barclays | Maintain | Equal Weight | 2026-01-12 |
| TD Cowen | Maintain | Buy | 2026-01-08 |
| Citigroup | Maintain | Neutral | 2025-12-23 |
| Keybanc | Maintain | Overweight | 2025-11-06 |
| TD Cowen | Maintain | Buy | 2025-11-06 |
| UBS | Maintain | Buy | 2025-11-06 |
| Jefferies | Maintain | Hold | 2025-11-06 |
| JP Morgan | Maintain | Neutral | 2025-11-06 |
| Mizuho | Maintain | Neutral | 2025-11-06 |
| Barclays | Maintain | Equal Weight | 2025-11-06 |
Paycom exhibits a more favorable grading pattern, including multiple buy and overweight ratings, indicating stronger analyst confidence.
Which company has the best grades?
Paycom Software, Inc. holds generally better grades than DocuSign, with multiple buy and overweight ratings compared to DocuSign’s predominance of hold and neutral grades. This difference may influence investor perception of growth potential and market positioning.
Strengths and Weaknesses
Below is a comparative overview of key strengths and weaknesses for DocuSign, Inc. (DOCU) and Paycom Software, Inc. (PAYC), based on the latest financial and operational data.
| Criterion | DocuSign, Inc. (DOCU) | Paycom Software, Inc. (PAYC) |
|---|---|---|
| Diversification | Moderate: Mainly subscription services with some professional services; limited product range | Moderate: Focus on recurring software services with implementation support; focused product line |
| Profitability | Improving net margin at 35.87%, ROE 53.32%, but neutral ROIC and slightly unfavorable liquidity ratios | Strong profitability with net margin 26.66%, ROE 31.85%, ROIC 24.86%, good liquidity and coverage ratios |
| Innovation | Slightly favorable moat with growing ROIC; invests in platform development and integration | Very favorable moat with durable competitive advantage and increasing profitability; high ROIC growth |
| Global presence | Established global footprint but with challenges in scaling liquidity and asset turnover | Growing presence with strong financial discipline and operational efficiency, albeit lower asset turnover |
| Market Share | Leading in e-signature market but faces intense competition | Strong market position in payroll software with consistent revenue growth and customer retention |
Key takeaways: Paycom demonstrates a stronger competitive advantage and financial stability, highlighted by its very favorable moat and superior profitability metrics. DocuSign shows promising growth and improving profitability but still faces challenges in capital efficiency and liquidity. Both companies have focused product offerings with solid market positions.
Risk Analysis
Below is a comparative table of key risks for DocuSign, Inc. (DOCU) and Paycom Software, Inc. (PAYC) based on the most recent data from 2025 and 2024 respectively:
| Metric | DocuSign, Inc. (DOCU) | Paycom Software, Inc. (PAYC) |
|---|---|---|
| Market Risk | Moderate (Beta 0.99, price range $56.63-$99.3) | Moderate (Beta 0.82, price range $148.41-$267.76) |
| Debt Level | Low (Debt/Equity 0.06, Debt to Assets 3.1%) | Very Low (Debt/Equity 0.05, Debt to Assets 1.42%) |
| Regulatory Risk | Moderate (Operating in US & international markets with complex e-signature laws) | Moderate (US-focused SaaS HCM with evolving labor regulations) |
| Operational Risk | Moderate (Dependence on cloud infrastructure and AI-driven services) | Moderate (Cloud-based platform with reliance on continuous software innovation) |
| Environmental Risk | Low (Technology sector, minimal direct environmental impact) | Low (Technology sector, minimal direct environmental impact) |
| Geopolitical Risk | Moderate (International exposure with some US federal government contracts) | Low to Moderate (Primarily US market exposure) |
The most likely and impactful risks for both are market volatility and regulatory changes affecting software and data privacy laws. DocuSign faces additional geopolitical exposure due to its international footprint and federal contracts, while Paycom’s risk is more concentrated in US labor regulation shifts. Both companies maintain low debt, mitigating financial distress risk.
Which Stock to Choose?
DocuSign, Inc. shows a favorable income evolution with a 7.78% revenue growth in 2025 and strong net margin improvement to 35.87%. Its financial ratios are slightly favorable overall, highlighting high ROE at 53.32% and low debt, though liquidity ratios remain weak. The company’s profitability is increasing, but it is still shedding value based on ROIC versus WACC. Its rating stands at B+ with a very favorable outlook on discounted cash flow.
Paycom Software, Inc. exhibits a consistently favorable income trend, with 11.19% revenue growth in 2024 and solid profitability metrics, including a 26.66% net margin and high ROIC well above WACC, indicating value creation. Financial ratios are favorable overall, with strong liquidity and manageable debt levels. Paycom holds a higher rating of A, reflecting very favorable scores in ROE and asset returns.
For investors prioritizing durable competitive advantage and value creation, Paycom’s very favorable moat and stronger rating may appear more compelling. Conversely, investors attracted to rapid profitability growth and improving financial health might find DocuSign’s favorable income statement and improving ratios worth watching. The choice could depend on whether emphasis is placed on established value generation or accelerating profitability trends.
Disclaimer: Investment carries a risk of loss of initial capital. The past performance is not a reliable indicator of future results. Be sure to understand risks before making an investment decision.
Go Further
I encourage you to read the complete analyses of DocuSign, Inc. and Paycom Software, Inc. to enhance your investment decisions: