In the fast-evolving software application sector, Figma, Inc. and DocuSign, Inc. stand out as leaders driving innovation in digital collaboration and workflow solutions. Both headquartered in San Francisco, these companies target overlapping markets—design and document management—while leveraging cutting-edge technology to enhance user experience and productivity. This article will analyze their strengths and risks to help you decide which company holds the most promise for your investment portfolio.
Table of contents
Companies Overview
I will begin the comparison between Figma and DocuSign by providing an overview of these two companies and their main differences.
Figma Overview
Figma, Inc. develops a browser-based design tool aimed at helping design and development teams collaboratively create user interfaces and prototypes. Its platform includes various products like Figma Design, Dev Mode, FigJam, and AI-powered Figma Make, streamlining design workflows. Founded in 2012 and headquartered in San Francisco, Figma operates within the software application industry with a market cap of approximately 14.4B USD.
DocuSign Overview
DocuSign, Inc. specializes in electronic signature software that enables businesses to digitally prepare, sign, and manage agreements globally. Its offerings extend to contract lifecycle management (CLM), AI tools for agreement analysis, and industry-specific cloud solutions, serving enterprises and small businesses. Established in 2003 and headquartered in San Francisco, DocuSign has a market cap near 11.4B USD and operates in the same software application sector.
Key similarities and differences
Both Figma and DocuSign operate in the software application industry, focusing on cloud-based solutions that enhance business workflows through digital tools. While Figma targets collaborative design and prototyping for product teams, DocuSign focuses on digital agreements and contract management. Their business models emphasize SaaS delivery, but they serve different core functions: creative design versus legal and transactional processes. Both have significant market presence, with Figma newer to the public market since 2025 compared to DocuSign’s 2018 IPO.
Income Statement Comparison
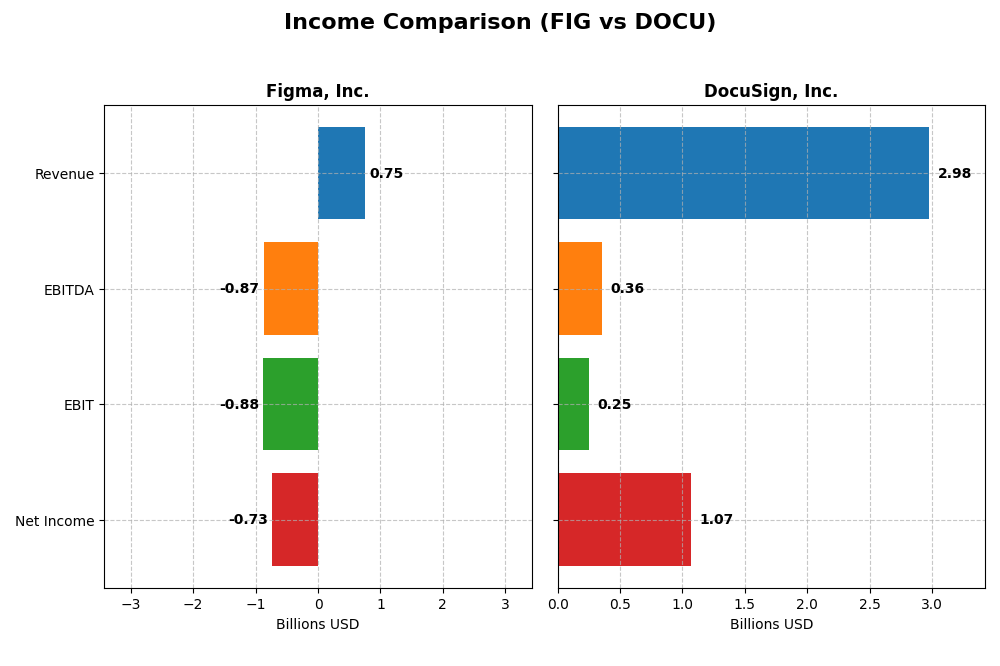
The table below compares key income statement metrics for Figma, Inc. and DocuSign, Inc. for their most recent fiscal years, illustrating their revenue, profitability, and earnings per share.
| Metric | Figma, Inc. (FIG) | DocuSign, Inc. (DOCU) |
|---|---|---|
| Market Cap | 14.4B | 11.4B |
| Revenue | 749M | 2.98B |
| EBITDA | -870M | 357M |
| EBIT | -877M | 249M |
| Net Income | -732M | 1.07B |
| EPS | -3.11 | 5.23 |
| Fiscal Year | 2024 | 2025 |
Income Statement Interpretations
Figma, Inc.
Figma’s revenue surged by 48.36% from 2023 to 2024, reaching $749M, supported by a strong gross margin of 88.32%. However, operating expenses grew at a similar pace, driving the company into an operating loss of $877M and a net loss of $732M in 2024. Despite impressive top-line growth, profitability margins deteriorated significantly in the latest year.
DocuSign, Inc.
DocuSign experienced steady revenue growth, increasing 7.78% in 2025 to $2.98B, with a stable gross margin of 79.12%. Operating income improved markedly to $200M, reflecting effective expense management. Net income rose sharply to $1.07B, and net margin expanded to 35.87%, indicating stronger profitability and margin improvement in the most recent fiscal year.
Which one has the stronger fundamentals?
DocuSign presents stronger fundamentals with consistent revenue growth, improving operating and net margins, and a favorable overall income statement evaluation. In contrast, Figma shows robust revenue growth but suffers from significant operating losses and negative net margins, leading to an unfavorable income statement profile. DocuSign’s profitability and margin stability position it more favorably by comparison.
Financial Ratios Comparison
The table below presents the most recent financial ratios for Figma, Inc. (FIG) and DocuSign, Inc. (DOCU) as of their fiscal year ending in 2024 and 2025, respectively, to facilitate a direct comparison.
| Ratios | Figma, Inc. (FIG) 2024 | DocuSign, Inc. (DOCU) 2025 |
|---|---|---|
| ROE | -55.3% | 53.3% |
| ROIC | -59.7% | 9.1% |
| P/E | -70.7 | 18.5 |
| P/B | 39.1 | 9.9 |
| Current Ratio | 3.66 | 0.81 |
| Quick Ratio | 3.66 | 0.81 |
| D/E (Debt-to-Equity) | 0.022 | 0.062 |
| Debt-to-Assets | 1.6% | 3.1% |
| Interest Coverage | 0 | 129 |
| Asset Turnover | 0.42 | 0.74 |
| Fixed Asset Turnover | 17.1 | 7.28 |
| Payout Ratio | 0 | 0 |
| Dividend Yield | 0 | 0 |
Interpretation of the Ratios
Figma, Inc.
Figma’s financial ratios reveal several weaknesses, including negative net margin (-97.74%) and return on equity (-55.29%), indicating profitability and efficiency challenges. The company has a high price-to-book ratio (39.1) and an unfavorable interest coverage ratio, raising concerns about valuation and debt servicing. It does not pay dividends, likely reflecting reinvestment in growth and innovation priorities.
DocuSign, Inc.
DocuSign presents a stronger ratio profile with favorable net margin (35.87%) and return on equity (53.32%), though some metrics like price-to-book ratio (9.87) and current ratio (0.81) are less favorable. The interest coverage ratio is robust at 160.96, signaling solid debt management. DocuSign does not pay dividends, suggesting continued focus on reinvestment and expansion.
Which one has the best ratios?
DocuSign holds a more favorable overall ratio evaluation, balancing profitability and financial health with fewer unfavorable metrics than Figma. While Figma struggles with profitability and some liquidity measures, DocuSign’s results indicate stronger operational efficiency and debt coverage, though both companies forego dividends to prioritize growth or reinvestment strategies.
Strategic Positioning
This section compares the strategic positioning of Figma, Inc. (FIG) and DocuSign, Inc. (DOCU) in terms of market position, key segments, and exposure to technological disruption:
Figma, Inc. (FIG)
- New York Stock Exchange-listed with $14.4B market cap; faces high beta volatility (-3.8)
- Focuses on browser-based collaborative design tools for UI and product development teams
- Operates in software application industry, with a diverse toolset including AI-enabled design and prototyping
- Exposure to technology disruption is high due to rapid innovation in design collaboration tools
DocuSign, Inc. (DOCU)
- NASDAQ-listed with $11.4B market cap; moderate beta near 1.0
- Specializes in electronic signature software and contract lifecycle management solutions
- Provides AI-driven contract management, digital signatures, and industry-specific cloud offerings
- Faces moderate disruption risks; leverages AI but operates in a mature digital signature market
Figma, Inc. vs DocuSign, Inc. Positioning
Figma pursues a concentrated approach focused on collaborative design software, while DocuSign has a diversified portfolio spanning e-signatures, AI-driven contract management, and industry-specific solutions. Figma’s high beta reflects greater market volatility, whereas DocuSign’s broader segments provide some stability.
Which has the best competitive advantage?
DocuSign’s slightly favorable moat reflects growing profitability and efficient capital use, while Figma’s very unfavorable moat indicates value destruction and declining returns, suggesting DocuSign currently holds a better competitive advantage based on MOAT evaluation.
Stock Comparison
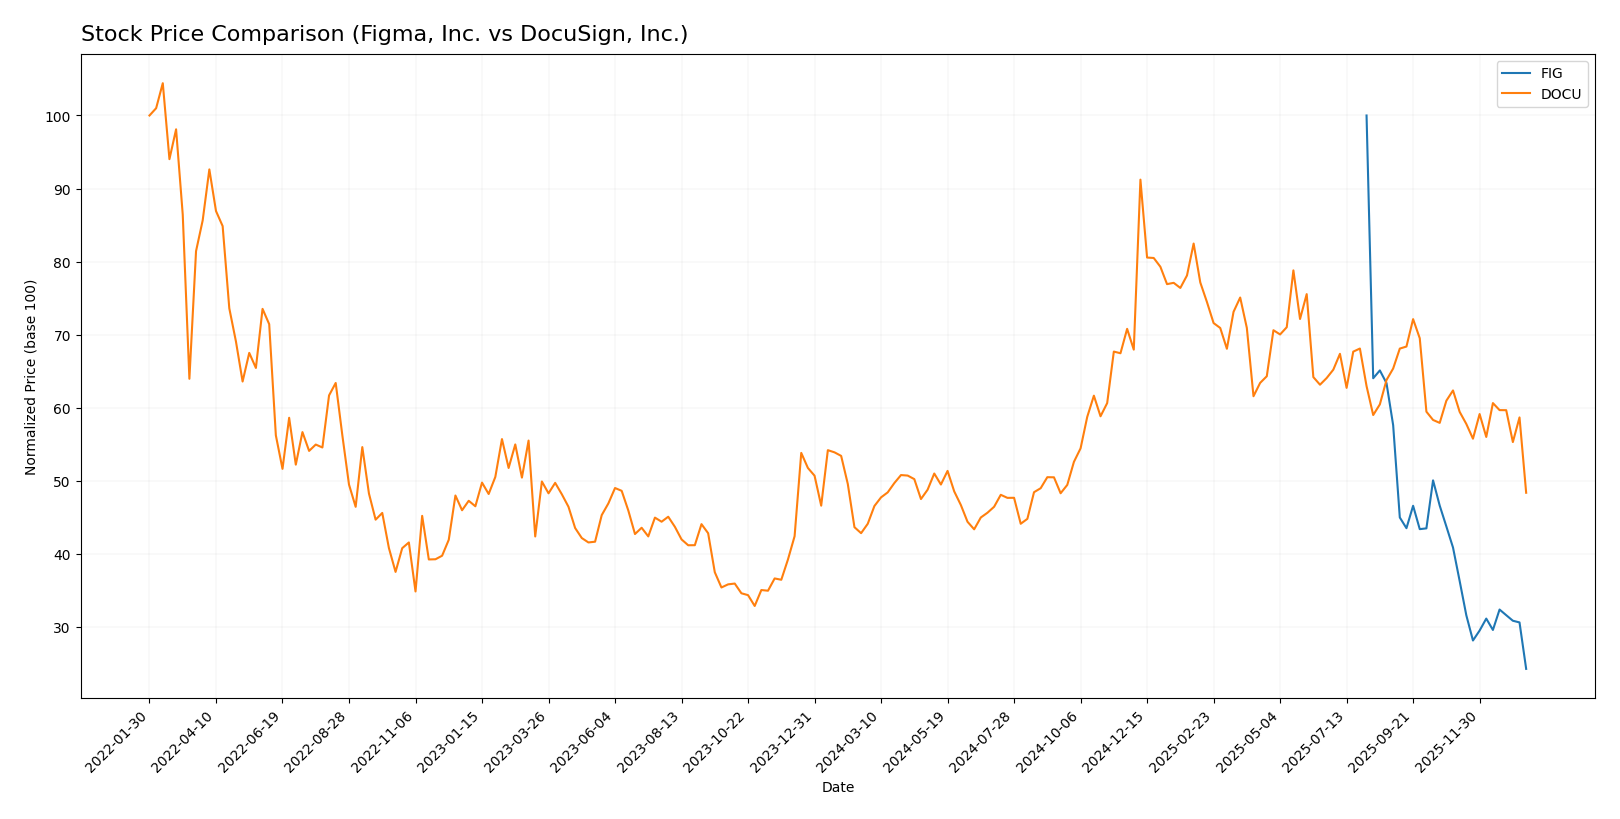
The stock prices of Figma, Inc. (FIG) and DocuSign, Inc. (DOCU) have shown contrasting movements over the past 12 months, with FIG experiencing a sharp decline and DOCU exhibiting moderate gains followed by recent downward pressure.
Trend Analysis
Figma, Inc. (FIG) stock showed a bearish trend over the past year with a significant price drop of -75.76%, accompanied by accelerating decline and high volatility (std deviation 19.95). The stock ranged between $122.0 and $29.57.
DocuSign, Inc. (DOCU) experienced a bullish trend overall with a 9.63% price increase over the year but showed deceleration. Recent months revealed a short-term bearish phase with a -22.46% drop and moderate volatility (std deviation 4.06).
Comparing both, DOCU delivered the highest market performance over 12 months with a positive gain, while FIG faced a steep loss, reflecting divergent investor sentiment and market dynamics.
Target Prices
Here is the consensus target price overview for Figma, Inc. and DocuSign, Inc. based on verified analyst estimates.
| Company | Target High | Target Low | Consensus |
|---|---|---|---|
| Figma, Inc. | 52 | 38 | 43.6 |
| DocuSign, Inc. | 88 | 70 | 76.86 |
Analysts expect Figma’s price to rise significantly above the current $29.57, while DocuSign’s consensus target of $76.86 also suggests upside from its current $56.71 price. Both show potential for appreciation based on current valuations.
Analyst Opinions Comparison
This section compares analysts’ ratings and financial grades for Figma, Inc. (FIG) and DocuSign, Inc. (DOCU):
Rating Comparison
FIG Rating
- Rating: C+, rated Very Favorable overall by analysts.
- Discounted Cash Flow Score: 4, indicating a favorable valuation.
- ROE Score: 1, showing very unfavorable efficiency in equity use.
- ROA Score: 1, showing very unfavorable asset utilization.
- Debt To Equity Score: 4, indicating favorable financial risk level.
- Overall Score: 2, considered moderate by analysts.
DOCU Rating
- Rating: B+, rated Very Favorable overall by analysts.
- Discounted Cash Flow Score: 5, indicating a very favorable valuation.
- ROE Score: 4, showing favorable efficiency in equity use.
- ROA Score: 4, showing favorable asset utilization.
- Debt To Equity Score: 3, indicating moderate financial risk level.
- Overall Score: 3, considered moderate by analysts.
Which one is the best rated?
Based strictly on the provided data, DOCU holds a stronger rating with a B+ versus FIG’s C+. DOCU scores higher in DCF, ROE, ROA, and overall score, suggesting better financial efficiency and valuation metrics.
Scores Comparison
Here is a comparison of the Altman Z-Score and Piotroski Score for both companies:
Figma Scores
- Altman Z-Score: 14.34, indicating a very safe zone.
- Piotroski Score: 4, classified as average financial strength.
DocuSign Scores
- Altman Z-Score: 4.43, indicating a safe zone.
- Piotroski Score: 5, classified as average financial strength.
Which company has the best scores?
Figma has a significantly higher Altman Z-Score, indicating stronger financial stability than DocuSign. Both companies have similar average Piotroski Scores, showing comparable financial strength in that regard.
Grades Comparison
Here is the grades comparison for Figma, Inc. and DocuSign, Inc.:
Figma, Inc. Grades
The following table summarizes recent grades assigned by reputable financial institutions for Figma, Inc.:
| Grading Company | Action | New Grade | Date |
|---|---|---|---|
| Morgan Stanley | Maintain | Equal Weight | 2026-01-15 |
| Wells Fargo | Upgrade | Overweight | 2026-01-08 |
| RBC Capital | Maintain | Sector Perform | 2026-01-05 |
| Goldman Sachs | Maintain | Neutral | 2025-11-07 |
| JP Morgan | Maintain | Neutral | 2025-11-06 |
| Piper Sandler | Maintain | Overweight | 2025-11-06 |
| Wells Fargo | Maintain | Equal Weight | 2025-11-05 |
| Wells Fargo | Maintain | Equal Weight | 2025-09-04 |
| Morgan Stanley | Maintain | Equal Weight | 2025-09-04 |
| RBC Capital | Maintain | Sector Perform | 2025-09-04 |
Figma’s grades predominantly show a Hold to Overweight stance, with multiple firms maintaining neutral or sector perform ratings.
DocuSign, Inc. Grades
The following table summarizes recent grades assigned by reputable financial institutions for DocuSign, Inc.:
| Grading Company | Action | New Grade | Date |
|---|---|---|---|
| RBC Capital | Maintain | Sector Perform | 2026-01-05 |
| Evercore ISI Group | Maintain | In Line | 2025-12-05 |
| UBS | Maintain | Neutral | 2025-12-05 |
| Wells Fargo | Maintain | Equal Weight | 2025-12-05 |
| Piper Sandler | Maintain | Neutral | 2025-12-05 |
| RBC Capital | Maintain | Sector Perform | 2025-12-05 |
| JP Morgan | Maintain | Neutral | 2025-12-05 |
| B of A Securities | Maintain | Neutral | 2025-12-05 |
| Needham | Maintain | Hold | 2025-12-05 |
| Baird | Maintain | Neutral | 2025-12-05 |
DocuSign’s ratings mostly indicate a Hold or Neutral consensus with no upgrades or downgrades recently.
Which company has the best grades?
Both Figma and DocuSign hold a consensus rating of Hold overall. However, Figma has a few recent upgrades to Overweight and more instances of positive ratings compared to DocuSign’s consistent Neutral and Hold grades. This suggests Figma may be viewed slightly more favorably by some analysts, potentially affecting investor sentiment and portfolio positioning.
Strengths and Weaknesses
Below is a comparison table highlighting the key strengths and weaknesses of Figma, Inc. (FIG) and DocuSign, Inc. (DOCU) based on the latest financial and operational data.
| Criterion | Figma, Inc. (FIG) | DocuSign, Inc. (DOCU) |
|---|---|---|
| Diversification | Limited diversification, focused on design software | Moderate diversification; mainly subscription-based e-signature services with some professional services |
| Profitability | Negative profitability; net margin -97.74%, ROIC -59.68% | Positive profitability; net margin 35.87%, ROIC 9.09% |
| Innovation | High innovation potential but declining value creation | Steady innovation with growing ROIC and improving competitiveness |
| Global presence | Growing but relatively smaller global footprint | Established global presence with strong market penetration |
| Market Share | Niche player in design collaboration tools | Leading market share in e-signature and digital transaction management |
Key takeaways: DocuSign demonstrates stronger profitability and a slightly favorable economic moat with growing returns, making it a more stable investment. Figma, despite innovation potential, is currently value-destructive with declining profitability, signaling higher risk for investors.
Risk Analysis
Below is a comparative table highlighting key risks for Figma, Inc. (FIG) and DocuSign, Inc. (DOCU) based on their latest financial and operational profiles from 2025-2026:
| Metric | Figma, Inc. (FIG) | DocuSign, Inc. (DOCU) |
|---|---|---|
| Market Risk | High volatility (beta -3.80), wide price range $29.48-$142.92 | Moderate volatility (beta 0.99), range $56.63-$99.30 |
| Debt level | Very low debt (D/E 0.02), low debt-to-assets 1.6% | Low debt (D/E 0.06), debt-to-assets 3.1% |
| Regulatory Risk | Moderate; tech sector subject to data/privacy regulations | Moderate; compliance needed for e-signature laws globally |
| Operational Risk | Negative profitability metrics, low ROE (-55%), net margin -98% | Positive profitability, strong ROE 53%, net margin 36% |
| Environmental Risk | Low; software company with limited direct environmental impact | Low; primarily digital services with minimal environmental footprint |
| Geopolitical Risk | Moderate; US-based with global customers, exposure to trade tensions | Moderate; similar US base, international regulatory environment |
The most impactful and likely risks center on Figma’s significant operational challenges, including its negative profitability and unfavorable financial ratios, which increase its market and operational risk. DocuSign shows healthier financials but faces typical regulatory and geopolitical risks inherent in global software services. Investors should weigh Figma’s high volatility and financial instability against DocuSign’s steadier profile with moderate risks.
Which Stock to Choose?
Figma, Inc. (FIG) shows strong revenue growth of 48.36% in 2024 but suffers from negative profitability with a net margin of -97.74%. Financial ratios reveal a mixed picture with 42.86% favorable metrics but an overall unfavorable rating, and the company carries low debt with a very favorable debt-to-equity ratio. Its MOAT evaluation is very unfavorable due to a declining ROIC well below WACC.
DocuSign, Inc. (DOCU) presents moderate revenue growth of 7.78% in 2025 and positive profitability, with a net margin of 35.87%. Financial ratios are slightly favorable overall, with 42.86% favorable and 21.43% unfavorable metrics, along with moderate debt levels. The company’s MOAT is slightly favorable, reflecting improving profitability and a growing ROIC above WACC.
Investors focused on growth may find Figma’s strong revenue gains appealing despite profitability challenges and declining ROIC, while those prioritizing financial stability and improving returns might view DocuSign’s favorable income statement and improving MOAT as more suitable. The choice could depend on an investor’s risk tolerance and preference for value creation trends.
Disclaimer: Investment carries a risk of loss of initial capital. The past performance is not a reliable indicator of future results. Be sure to understand risks before making an investment decision.
Go Further
I encourage you to read the complete analyses of Figma, Inc. and DocuSign, Inc. to enhance your investment decisions: