In the fast-evolving software application industry, DocuSign, Inc. and Elastic N.V. stand out as innovative leaders with distinct yet overlapping market focuses. DocuSign revolutionizes digital agreements and contract management, while Elastic offers powerful data search and analytics solutions. Both companies leverage cutting-edge technology to drive growth, making them compelling options for investors. This article will help you determine which company offers the most promising investment opportunity in 2026.
Table of contents
Companies Overview
I will begin the comparison between DocuSign and Elastic by providing an overview of these two companies and their main differences.
DocuSign Overview
DocuSign, Inc. specializes in electronic signature software and digital agreement management, serving businesses globally. Its offerings include e-signature solutions, contract lifecycle management with AI-driven tools, and industry-specific cloud services. Founded in 2003 and headquartered in San Francisco, DocuSign targets enterprises, commercial, and small businesses, emphasizing workflow automation and compliance in the agreement process.
Elastic Overview
Elastic N.V. focuses on search technology and data analytics through its Elastic Stack software suite. Its products include Elasticsearch for real-time search and analytics, Kibana for user interface management, Beats for data shipping, and Logstash for data processing. Founded in 2012 and based in Mountain View, Elastic serves multi-cloud environments with solutions for app search, logging, metrics, and performance monitoring, catering to a wide range of data-driven applications.
Key similarities and differences
Both DocuSign and Elastic operate in the software application industry within the technology sector, offering cloud-based solutions to enterprise clients. While DocuSign centers on digital agreements and contract management, Elastic provides search and data analytics platforms. DocuSign’s focus is on workflow automation and compliance, whereas Elastic emphasizes data ingestion, search, and visualization across multi-cloud environments, reflecting distinct but complementary software business models.
Income Statement Comparison
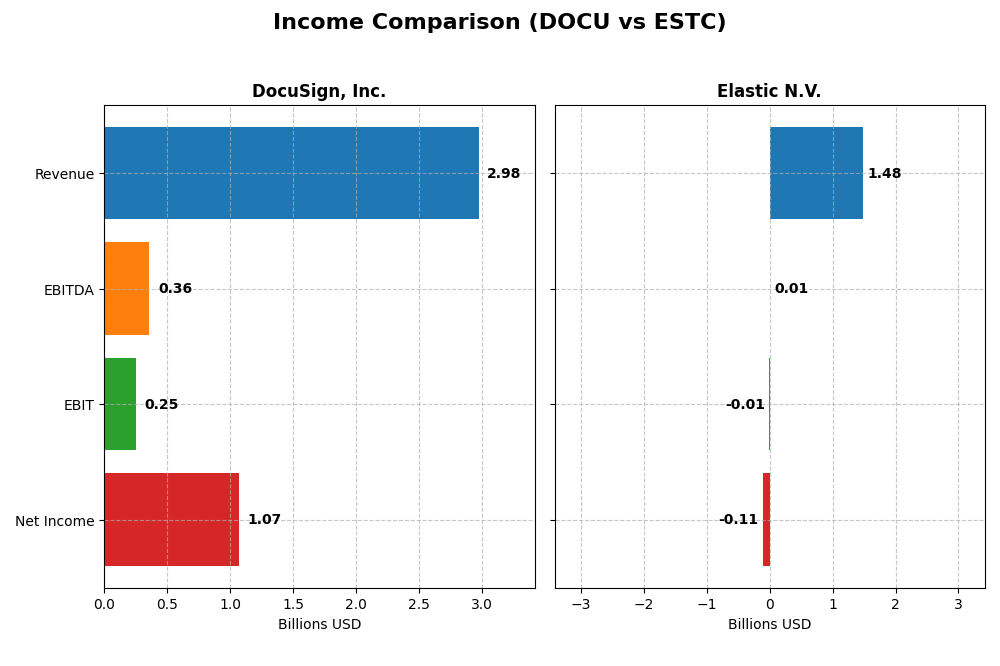
The table below compares key income statement metrics for DocuSign, Inc. and Elastic N.V. for their most recent fiscal year, highlighting revenue, profitability, and earnings per share.
| Metric | DocuSign, Inc. (DOCU) | Elastic N.V. (ESTC) |
|---|---|---|
| Market Cap | 11.36B | 7.52B |
| Revenue | 2.98B | 1.48B |
| EBITDA | 357M | 6.05M |
| EBIT | 249M | -6.26M |
| Net Income | 1.07B | -108M |
| EPS | 5.23 | -1.04 |
| Fiscal Year | 2025 | 2025 |
Income Statement Interpretations
DocuSign, Inc.
DocuSign’s revenue doubled from 2021 to 2025, reaching $3B with a strong net income turnaround to $1.07B in 2025. Gross margins remained favorable near 79%, while EBIT margins improved to a neutral 8.38%. The latest year saw solid revenue growth of 7.78%, significant EBIT expansion of 148.19%, and a dramatic net margin increase, reflecting operational leverage and margin improvement.
Elastic N.V.
Elastic’s revenue grew 144% over five years to $1.48B in 2025, showing robust top-line expansion. Gross margin stayed favorable at 74.39%, but EBIT and net margins remained negative, at -0.42% and -7.29% respectively. Despite a 17% revenue rise in the latest year, net margin and EPS declined, indicating profitability challenges despite operational growth and improved cost management.
Which one has the stronger fundamentals?
DocuSign demonstrates stronger fundamentals with consistent profitability improvements, high gross margins, and a favorable net margin exceeding 35%. Elastic shows strong revenue growth but persistent negative EBIT and net margins, signaling ongoing profitability struggles. DocuSign’s superior margin expansion and net income growth outweigh Elastic’s top-line gains, marking it as financially more robust.
Financial Ratios Comparison
The table below presents a side-by-side comparison of key financial ratios for DocuSign, Inc. and Elastic N.V., based on their most recent fiscal year data.
| Ratios | DocuSign, Inc. (DOCU) | Elastic N.V. (ESTC) |
|---|---|---|
| ROE | 53.3% | -11.7% |
| ROIC | 9.1% | -3.4% |
| P/E | 18.5 | -82.7 |
| P/B | 9.87 | 9.64 |
| Current Ratio | 0.81 | 1.92 |
| Quick Ratio | 0.81 | 1.92 |
| D/E | 0.06 | 0.64 |
| Debt-to-Assets | 3.1% | 22.9% |
| Interest Coverage | 129.0 | -2.17 |
| Asset Turnover | 0.74 | 0.57 |
| Fixed Asset Turnover | 7.28 | 51.28 |
| Payout ratio | 0 | 0 |
| Dividend yield | 0 | 0 |
Interpretation of the Ratios
DocuSign, Inc.
DocuSign shows a slightly favorable ratio profile for 2025, with strong net margin at 35.87% and a high return on equity of 53.32%. However, its current ratio of 0.81 signals liquidity concerns, and a price-to-book ratio near 9.87 appears stretched. The company does not pay dividends, likely reinvesting profits to support growth and innovation.
Elastic N.V.
Elastic’s 2025 ratios present a mixed picture: a negative net margin of -7.29% and return on equity at -11.66% are unfavorable, indicating profitability challenges. Its strong current and quick ratios around 1.92 suggest solid liquidity, but interest coverage is negative, raising solvency questions. Like DocuSign, Elastic pays no dividends, focusing on reinvestment and development.
Which one has the best ratios?
DocuSign’s ratios are generally stronger in profitability and solvency, despite liquidity weaknesses, while Elastic struggles with negative profitability but maintains better liquidity. Both show no dividend payouts, reflecting growth priorities. Overall, DocuSign’s slightly favorable assessment contrasts with Elastic’s neutral rating, highlighting a more robust financial profile for DocuSign in 2025.
Strategic Positioning
This section compares the strategic positioning of DocuSign and Elastic, focusing on market position, key segments, and exposure to technological disruption:
DocuSign, Inc.
- Leading electronic signature provider facing strong software application competition.
- Revenue driven mainly by subscription services and contract lifecycle management.
- Invests in AI-driven contract management and digital transaction solutions.
Elastic N.V.
- Search technology vendor competing in multi-cloud software markets.
- Revenue primarily from subscription software and professional services.
- Focuses on Elastic Stack software with data search and analytics capabilities.
DocuSign, Inc. vs Elastic N.V. Positioning
DocuSign concentrates on digital agreement solutions with broad industry applications, while Elastic offers a diversified search and analytics platform across multi-cloud environments. DocuSign’s strong subscription base contrasts with Elastic’s integrated data processing approach.
Which has the best competitive advantage?
DocuSign shows a slightly favorable moat with growing profitability but no clear competitive advantage. Elastic has a slightly unfavorable moat, also growing profitably but currently destroying value, indicating weaker competitive positioning.
Stock Comparison
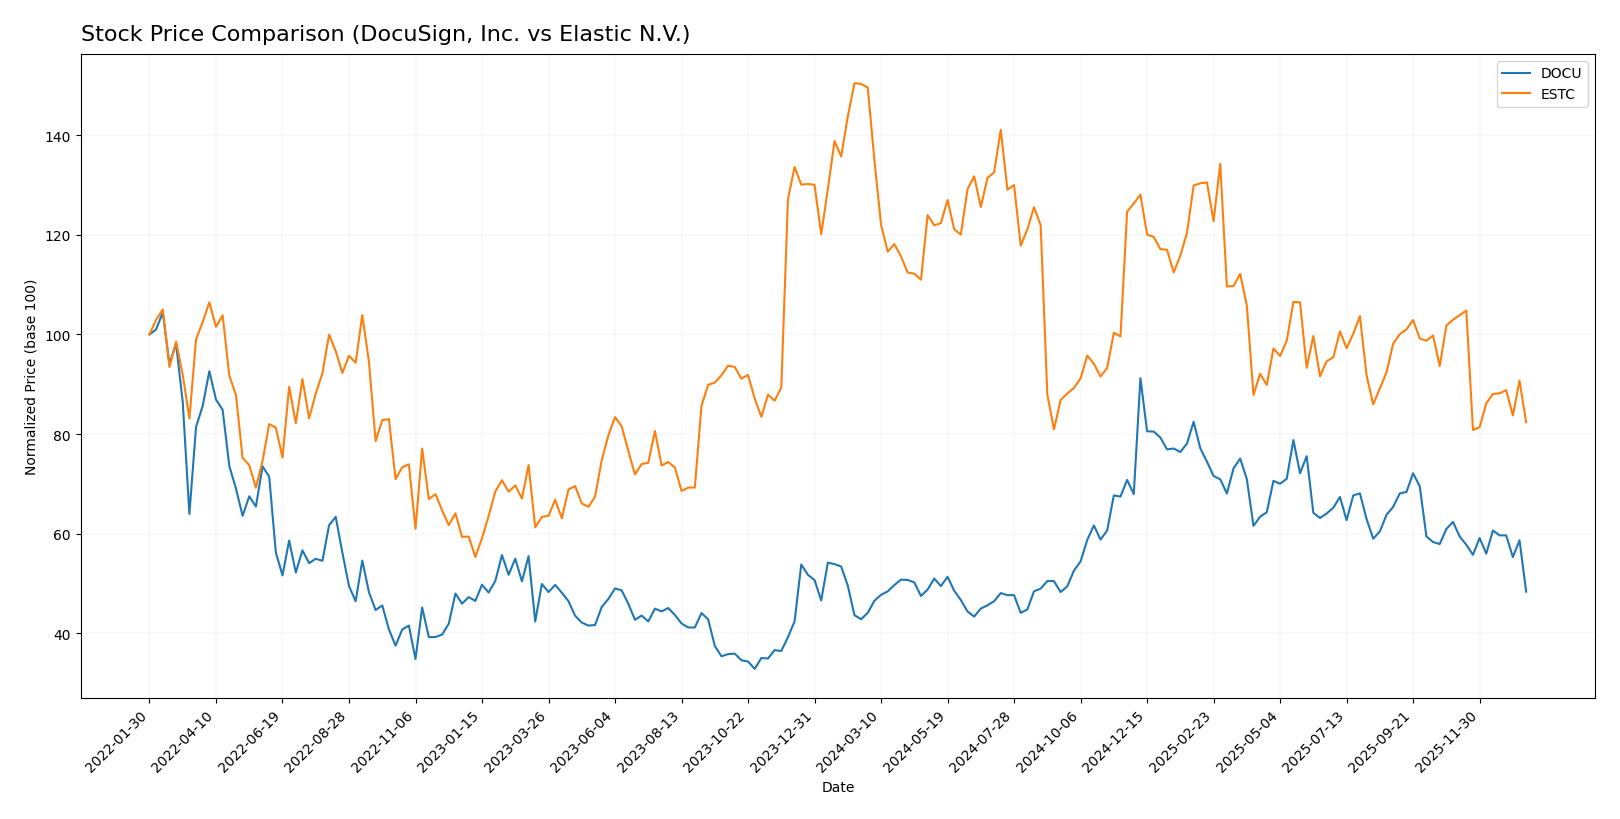
The stock price chart highlights contrasting trajectories for DocuSign, Inc. and Elastic N.V. over the past 12 months, with DocuSign showing a moderate bullish trend despite recent weakening, while Elastic exhibits a pronounced bearish decline with accelerating selling pressure.
Trend Analysis
DocuSign, Inc. experienced a 9.63% price increase over the past year, indicating a bullish trend with deceleration and a high volatility level (std dev 12.98). The recent period shows a 22.46% decline, signaling short-term weakness.
Elastic N.V. registered a -44.93% price change over the year, confirming a bearish trend with deceleration and higher volatility (std dev 14.08). The recent 20% drop reflects a sustained negative momentum.
Comparatively, DocuSign delivered the highest market performance with a positive 9.63% gain, while Elastic faced significant losses, underscoring divergent investor sentiment and stock dynamics.
Target Prices
Analysts present a clear consensus on target prices for DocuSign, Inc. and Elastic N.V., indicating potential upside from current levels.
| Company | Target High | Target Low | Consensus |
|---|---|---|---|
| DocuSign, Inc. | 88 | 70 | 76.86 |
| Elastic N.V. | 134 | 76 | 108 |
DocuSign’s consensus target price of 76.86 suggests a moderate upside from the current price of 56.71, while Elastic’s target consensus of 108 indicates a more significant expected increase from its current 71.38. Overall, analysts remain optimistic on both stocks.
Analyst Opinions Comparison
This section compares analysts’ ratings and grades for DocuSign, Inc. and Elastic N.V.:
Rating Comparison
DocuSign Rating
- Rating: B+, considered Very Favorable
- Discounted Cash Flow Score: 5, Very Favorable
- ROE Score: 4, Favorable
- ROA Score: 4, Favorable
- Debt To Equity Score: 3, Moderate
- Overall Score: 3, Moderate
Elastic Rating
- Rating: C-, considered Very Favorable
- Discounted Cash Flow Score: 3, Moderate
- ROE Score: 1, Very Unfavorable
- ROA Score: 1, Very Unfavorable
- Debt To Equity Score: 1, Very Unfavorable
- Overall Score: 1, Very Unfavorable
Which one is the best rated?
DocuSign holds a stronger overall rating and better scores in discounted cash flow, ROE, ROA, and debt-to-equity compared to Elastic, which has consistently lower scores across key financial metrics.
Scores Comparison
Here is a comparison of the Altman Z-Score and Piotroski Score for DocuSign and Elastic:
DocuSign Scores
- Altman Z-Score: 4.43, indicating a safe zone status.
- Piotroski Score: 5, classified as average financial health.
Elastic Scores
- Altman Z-Score: 3.51, indicating a safe zone status.
- Piotroski Score: 4, classified as average financial health.
Which company has the best scores?
DocuSign and Elastic both fall into the safe zone for Altman Z-Score, with DocuSign having a slightly higher score. DocuSign also has a marginally better Piotroski Score, indicating a modestly stronger financial position based on the provided data.
Grades Comparison
Here is a comparison of the latest available grades and ratings for DocuSign, Inc. and Elastic N.V.:
DocuSign, Inc. Grades
This table summarizes recent grades from established financial institutions for DocuSign, Inc.:
| Grading Company | Action | New Grade | Date |
|---|---|---|---|
| RBC Capital | Maintain | Sector Perform | 2026-01-05 |
| Evercore ISI Group | Maintain | In Line | 2025-12-05 |
| UBS | Maintain | Neutral | 2025-12-05 |
| Wells Fargo | Maintain | Equal Weight | 2025-12-05 |
| Piper Sandler | Maintain | Neutral | 2025-12-05 |
| JP Morgan | Maintain | Neutral | 2025-12-05 |
| B of A Securities | Maintain | Neutral | 2025-12-05 |
| Needham | Maintain | Hold | 2025-12-05 |
| Baird | Maintain | Neutral | 2025-12-05 |
DocuSign’s grades predominantly indicate a neutral or hold stance, reflecting a cautious outlook without strong buy signals.
Elastic N.V. Grades
This table shows recent grades from recognized grading firms for Elastic N.V.:
| Grading Company | Action | New Grade | Date |
|---|---|---|---|
| Barclays | Maintain | Overweight | 2026-01-12 |
| RBC Capital | Maintain | Outperform | 2026-01-05 |
| Jefferies | Maintain | Buy | 2026-01-05 |
| Citigroup | Maintain | Buy | 2025-11-24 |
| Wedbush | Maintain | Outperform | 2025-11-21 |
| B of A Securities | Maintain | Neutral | 2025-11-21 |
| Guggenheim | Maintain | Buy | 2025-11-21 |
| Wells Fargo | Maintain | Equal Weight | 2025-11-21 |
| Canaccord Genuity | Maintain | Buy | 2025-11-21 |
Elastic shows a generally positive consensus, with multiple buy and outperform ratings, indicating stronger confidence from analysts.
Which company has the best grades?
Elastic N.V. has received more favorable grades than DocuSign, with a majority of buy and outperform recommendations versus DocuSign’s neutral and hold ratings. This difference could influence investor sentiment toward Elastic as a stronger growth candidate.
Strengths and Weaknesses
Below is a comparison of key strengths and weaknesses for DocuSign, Inc. (DOCU) and Elastic N.V. (ESTC) based on their recent financial and operational data:
| Criterion | DocuSign, Inc. (DOCU) | Elastic N.V. (ESTC) |
|---|---|---|
| Diversification | Primarily focused on subscription services with growing professional services; limited product diversification | Subscription-driven with increasing professional services; moderate diversification |
| Profitability | Strong net margin (35.87%) and ROE (53.32%), but ROIC slightly neutral; positive profitability trend | Negative net margin (-7.29%) and ROE (-11.66%); improving ROIC but overall unprofitable |
| Innovation | High fixed asset turnover (7.28) indicates efficient asset use; strong growth in profitability | Extremely high fixed asset turnover (51.28), reflecting innovation and asset efficiency; yet struggling with profitability |
| Global presence | Solid global subscription revenue (~$2.9B in 2025); expanding customer base | Growing global subscription revenue (~$1.38B in 2025); less scale than DOCU |
| Market Share | Larger market share in e-signature and contract management space | Smaller but growing presence in search and data analytics markets |
Key takeaways: DocuSign exhibits stronger profitability and a more favorable financial position, making it a safer investment choice currently. Elastic shows promising innovation and revenue growth but faces profitability challenges, implying higher risk with potential upside.
Risk Analysis
Below is a comparative risk table for DocuSign, Inc. (DOCU) and Elastic N.V. (ESTC) based on the most recent 2025 data:
| Metric | DocuSign, Inc. (DOCU) | Elastic N.V. (ESTC) |
|---|---|---|
| Market Risk | Moderate (Beta 0.99) | Moderate (Beta 0.93) |
| Debt level | Low (D/E 0.06, favorable) | Moderate (D/E 0.64, neutral) |
| Regulatory Risk | Moderate (Tech sector compliance) | Moderate (Tech sector compliance) |
| Operational Risk | Moderate (Software delivery, cloud reliance) | Moderate (Cloud and multi-cloud environment dependency) |
| Environmental Risk | Low (Minimal direct impact) | Low (Minimal direct impact) |
| Geopolitical Risk | Moderate (US-focused, global customers) | Moderate (US-based, global market exposure) |
DocuSign’s low debt and strong interest coverage reduce financial risk, but its liquidity ratios are weak, presenting operational caution. Elastic faces higher debt and negative profitability, increasing financial vulnerability. Market and geopolitical risks remain moderate for both due to tech sector dynamics and international exposure.
Which Stock to Choose?
DocuSign, Inc. (DOCU) shows favorable income evolution with strong net margin growth of 1239% and a 7.78% revenue increase in the latest year. Its profitability is solid, marked by a 53.3% return on equity and low debt levels, supported by a very favorable B+ rating and a slightly favorable moat indicating improving profitability.
Elastic N.V. (ESTC) reports favorable revenue growth of 17% and overall positive income statement trends, yet it suffers from a negative net margin of -7.29% and unfavorable returns on equity and invested capital. The company carries moderate debt and a C- rating with a slightly unfavorable moat, reflecting ongoing value destruction despite improving ROIC.
Considering ratings and financial metrics, DOCU’s slightly favorable ratios and strong income growth might appeal to investors prioritizing profitability and moderate risk. ESTC’s profile, with favorable liquidity but weaker profitability and rating, could be seen as more suitable for risk-tolerant investors focused on growth potential.
Disclaimer: Investment carries a risk of loss of initial capital. The past performance is not a reliable indicator of future results. Be sure to understand risks before making an investment decision.
Go Further
I encourage you to read the complete analyses of DocuSign, Inc. and Elastic N.V. to enhance your investment decisions: