Diamondback Energy, Inc. (FANG) and Texas Pacific Land Corporation (TPL) are two prominent players in the oil and gas exploration and production sector, both deeply rooted in Texas’ Permian Basin. While Diamondback focuses on direct resource extraction and midstream infrastructure, Texas Pacific Land specializes in land management and water services tied to oil and gas operations. This article will guide you through a detailed comparison to identify which company offers the most compelling investment opportunity in 2026.
Table of contents
Companies Overview
I will begin the comparison between Diamondback Energy, Inc. and Texas Pacific Land Corporation by providing an overview of these two companies and their main differences.
Diamondback Energy, Inc. Overview
Diamondback Energy, Inc. is an independent oil and natural gas company focused on acquiring, developing, exploring, and exploiting unconventional and onshore oil and natural gas reserves primarily in the Permian Basin, West Texas. The company holds significant acreage and operates extensive midstream infrastructure, including pipelines and water systems, supporting its production activities. Founded in 2007, Diamondback Energy is headquartered in Midland, Texas, and trades on NASDAQ.
Texas Pacific Land Corporation Overview
Texas Pacific Land Corporation operates in land and resource management along with water services and operations, managing about 880,000 acres mostly in western Texas. It holds various nonparticipating perpetual oil and gas royalty interests and leases land for multiple purposes, including hydrocarbon extraction and infrastructure. The company also provides comprehensive water services to Permian Basin operators. Founded in 1888, it is headquartered in Dallas, Texas, and listed on the NYSE.
Key similarities and differences
Both companies operate within the oil and gas exploration and production sector in Texas, targeting the Permian Basin region. Diamondback Energy focuses on direct exploration, production, and midstream operations, while Texas Pacific Land emphasizes land and resource management with royalty interests and water services. Diamondback operates thousands of wells and infrastructure assets, whereas Texas Pacific Land manages land holdings and provides ancillary services, reflecting distinct business models despite geographic overlap.
Income Statement Comparison
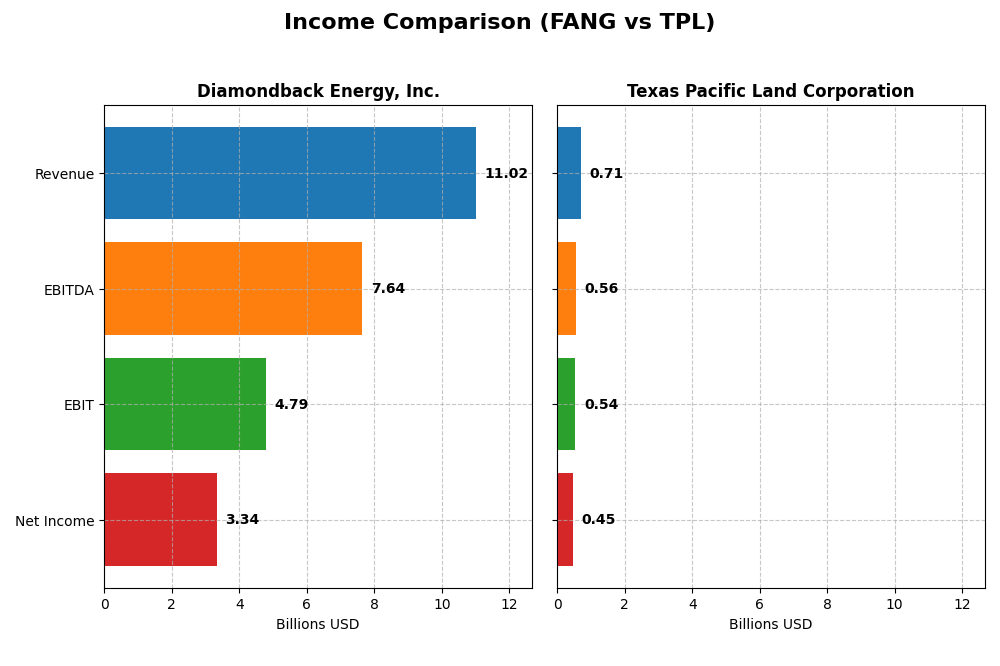
Below is a side-by-side comparison of key income statement metrics for Diamondback Energy, Inc. and Texas Pacific Land Corporation for the fiscal year 2024.
| Metric | Diamondback Energy, Inc. (FANG) | Texas Pacific Land Corporation (TPL) |
|---|---|---|
| Market Cap | 42.9B | 21.5B |
| Revenue | 11.0B | 706M |
| EBITDA | 7.64B | 564M |
| EBIT | 4.79B | 539M |
| Net Income | 3.34B | 454M |
| EPS | 15.53 | 6.58 |
| Fiscal Year | 2024 | 2024 |
Income Statement Interpretations
Diamondback Energy, Inc.
Diamondback Energy exhibited strong revenue growth from 2020 to 2024, rising from $2.8B to $11B, with net income improving significantly from a loss of $4.5B in 2020 to $3.3B in 2024. Margins generally improved, with gross margin around 45% and net margin at 30% in 2024. The latest year saw a 32% revenue increase but a 20% decline in net margin, indicating some pressure on profitability despite top-line growth.
Texas Pacific Land Corporation
Texas Pacific Land showed steady revenue growth from $303M in 2020 to $706M in 2024, with net income rising from $176M to $454M. Margins remained robust, with a gross margin near 90% and net margin above 64% in 2024. The most recent year maintained favorable margin stability and a moderate 12% EPS growth, reflecting consistent operational efficiency and profitability gains.
Which one has the stronger fundamentals?
Texas Pacific Land’s income statement demonstrates higher and more stable margins alongside consistent year-over-year growth, with minimal unfavorable factors. Diamondback Energy delivered substantial revenue and net income growth overall but faced margin compression and some unfavorable trends in the latest year. Thus, Texas Pacific Land appears to have a steadier financial profile based on the income statement metrics.
Financial Ratios Comparison
The following table presents a side-by-side comparison of key financial ratios for Diamondback Energy, Inc. (FANG) and Texas Pacific Land Corporation (TPL) based on their most recent fiscal year data ending 2024.
| Ratios | Diamondback Energy, Inc. (FANG) | Texas Pacific Land Corporation (TPL) |
|---|---|---|
| ROE | 8.85% | 40.09% |
| ROIC | 5.75% | 35.60% |
| P/E | 10.48 | 18.67 |
| P/B | 0.93 | 7.48 |
| Current Ratio | 0.44 | 8.33 |
| Quick Ratio | 0.41 | 8.33 |
| D/E (Debt-to-Equity) | 0.33 | 0.0004 |
| Debt-to-Assets | 18.47% | 0.04% |
| Interest Coverage | 15.11 | 0 |
| Asset Turnover | 0.16 | 0.57 |
| Fixed Asset Turnover | 0.17 | 1.27 |
| Payout ratio | 47.27% | 76.51% |
| Dividend yield | 4.51% | 4.10% |
Interpretation of the Ratios
Diamondback Energy, Inc.
Diamondback Energy shows a mix of strong and weak ratios, with a favorable net margin of 30.28% but an unfavorable return on equity at 8.85%. The company has a low current ratio of 0.44, indicating liquidity concerns, yet maintains a favorable debt-to-equity ratio of 0.33 and strong interest coverage of 16.46. Its dividend yield of 4.51% is supported by consistent payouts, but free cash flow coverage is negative, suggesting cautious monitoring of dividend sustainability.
Texas Pacific Land Corporation
Texas Pacific Land has predominantly favorable ratios, including a high net margin of 64.32%, robust ROE of 40.09%, and excellent debt metrics with zero debt and minimal debt-to-assets at 0.04%. The current ratio is very high at 8.33, which, despite being flagged unfavorable, reflects strong liquidity. With a 4.1% dividend yield and infinite interest coverage, dividends appear well supported, although the high price-to-book ratio of 7.48 signals valuation caution.
Which one has the best ratios?
Both companies present favorable overall ratios at 57.14%, but Texas Pacific Land exhibits stronger profitability and liquidity metrics, especially with zero debt and higher returns on equity and invested capital. Diamondback Energy faces liquidity and efficiency challenges, despite a solid dividend yield. Hence, Texas Pacific Land’s ratios appear more robust, with fewer unfavorable indicators.
Strategic Positioning
This section compares the strategic positioning of Diamondback Energy, Inc. and Texas Pacific Land Corporation, focusing on market position, key segments, and exposure to technological disruption:
Diamondback Energy, Inc.
- Large market cap (~43B USD), operates mainly in oil & gas exploration and production, facing typical sector competition.
- Key segments include upstream and midstream oil and gas operations, with significant acreage and producing wells in the Permian Basin.
- Exposure linked to conventional oil & gas production technologies; no explicit mention of disruptive tech adoption or risks.
Texas Pacific Land Corporation
- Smaller market cap (~21.5B USD), land and resource management with less direct competitive pressure in oil & gas royalties.
- Focuses on land/resource management, oil and gas royalties, and water services in the Permian Basin, with diversified revenue streams.
- Exposure involves water services innovation but no direct technological disruption highlighted in core land and royalty management.
Diamondback Energy, Inc. vs Texas Pacific Land Corporation Positioning
Diamondback’s approach centers on integrated upstream and midstream oil & gas operations, while Texas Pacific Land emphasizes land management and royalties with water services. Diamondback’s diversified operations may face more operational risks compared to Texas Pacific’s focused asset base.
Which has the best competitive advantage?
Texas Pacific Land shows a very favorable moat with strong ROIC above WACC and growing profitability, indicating a durable competitive advantage. Diamondback has a slightly favorable moat with increasing profitability but is currently shedding value relative to cost of capital.
Stock Comparison
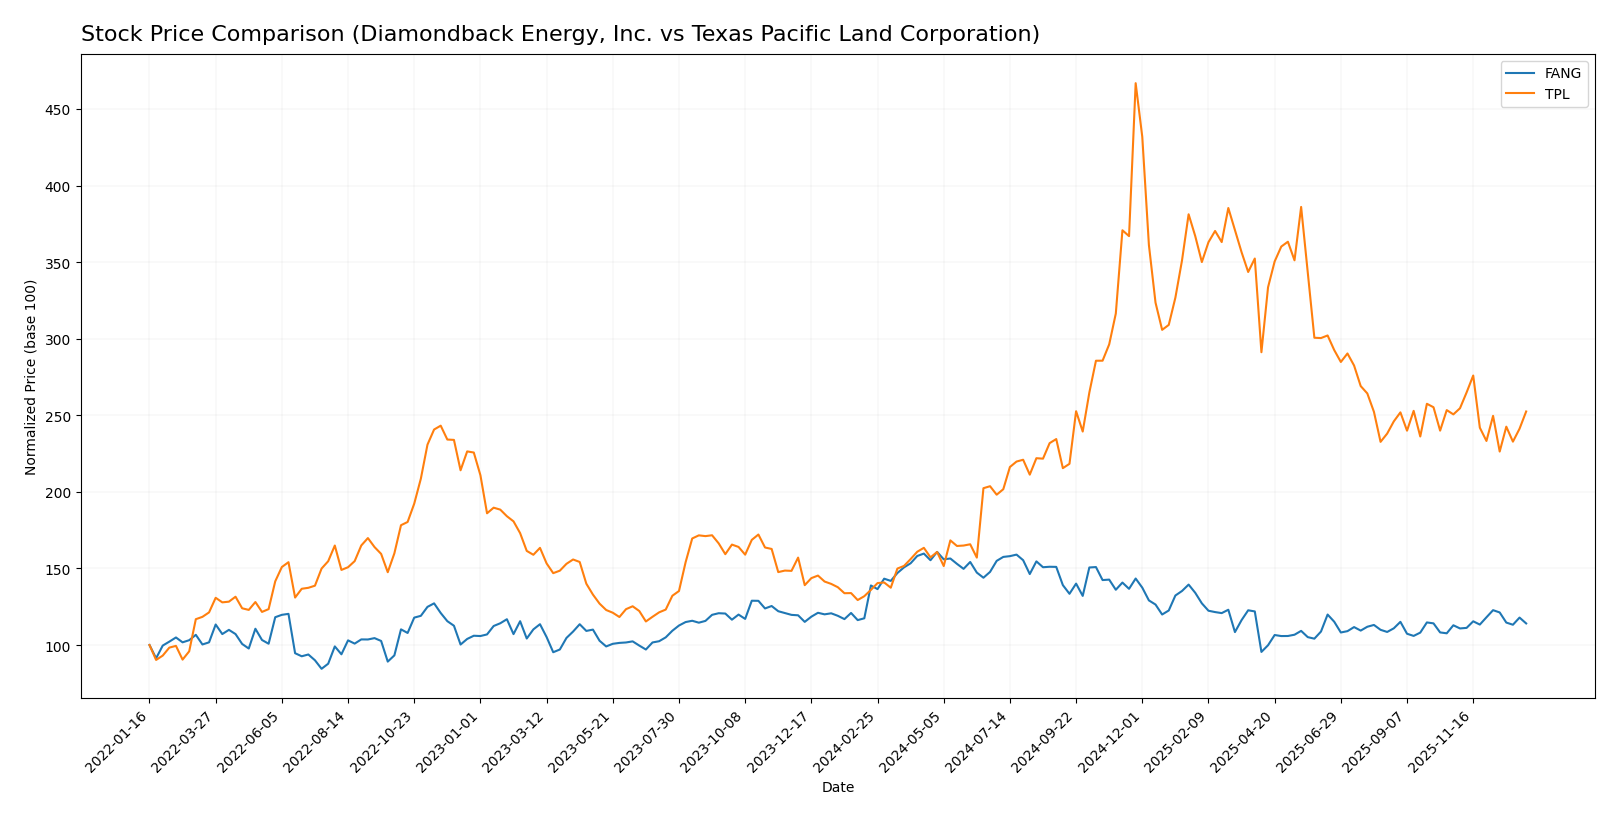
The stock price dynamics over the past year reveal contrasting movements, with Diamondback Energy, Inc. showing a significant decline while Texas Pacific Land Corporation experienced a strong upward trajectory, reflecting differing market sentiment and volatility.
Trend Analysis
Diamondback Energy, Inc. (FANG) exhibited a bearish trend over the past 12 months with a price decline of 17.84%, accompanied by acceleration and high volatility, peaking at 207.76 and bottoming at 123.37.
Texas Pacific Land Corporation (TPL) showed a bullish trend with an 85.66% price increase over the same period, though its upward momentum decelerated amid very high volatility, reaching a high of 576.67 and a low of 167.98.
Comparing both, TPL delivered the highest market performance with a strong bullish trend, while FANG experienced a pronounced bearish trend over the past year.
Target Prices
The current analyst consensus presents a positive outlook for Diamondback Energy, Inc. and Texas Pacific Land Corporation.
| Company | Target High | Target Low | Consensus |
|---|---|---|---|
| Diamondback Energy, Inc. | 219 | 162 | 185.36 |
| Texas Pacific Land Corporation | 1050 | 1050 | 1050 |
Analysts expect Diamondback Energy’s stock price to rise significantly from the current 147.41 USD towards the 185 USD consensus. Texas Pacific Land’s target consensus of 1050 USD is substantially higher than its current price of 311.87 USD, indicating strong bullish sentiment.
Analyst Opinions Comparison
This section compares analysts’ ratings and grades for Diamondback Energy, Inc. (FANG) and Texas Pacific Land Corporation (TPL):
Rating Comparison
FANG Rating
- Rating: A- with a Very Favorable status.
- Discounted Cash Flow Score: 5, Very Favorable.
- ROE Score: 4, Favorable efficiency in profit generation.
- ROA Score: 4, Favorable asset utilization.
- Debt To Equity Score: 2, Moderate financial risk.
- Overall Score: 4, Favorable financial standing.
TPL Rating
- Rating: A- with a Very Favorable status.
- Discounted Cash Flow Score: 4, Favorable.
- ROE Score: 5, Very Favorable profit efficiency.
- ROA Score: 5, Very Favorable asset utilization.
- Debt To Equity Score: 3, Moderate financial risk.
- Overall Score: 4, Favorable financial standing.
Which one is the best rated?
Both FANG and TPL share the same overall rating of A- and an overall score of 4, indicating favorable financial standing. TPL scores higher on ROE and ROA, while FANG leads in discounted cash flow, making their ratings comparably strong but with differing strengths.
Scores Comparison
The comparison of Diamondback Energy, Inc. and Texas Pacific Land Corporation scores is as follows:
FANG Scores
- Altman Z-Score: 1.33 indicates financial distress, high bankruptcy risk.
- Piotroski Score: 5, reflecting average financial strength.
TPL Scores
- Altman Z-Score: 29.77 indicates a safe zone, very low bankruptcy risk.
- Piotroski Score: 4, reflecting average financial strength.
Which company has the best scores?
Based on the provided data, TPL exhibits a significantly stronger Altman Z-Score indicating financial stability, while both companies have similar average Piotroski Scores. TPL has the overall better scores.
Grades Comparison
Here is a comparison of the latest available grades from reputable financial analysts for Diamondback Energy, Inc. and Texas Pacific Land Corporation:
Diamondback Energy, Inc. Grades
The following table displays recent grades assigned by established financial institutions:
| Grading Company | Action | New Grade | Date |
|---|---|---|---|
| Wells Fargo | Maintain | Overweight | 2024-10-18 |
| Susquehanna | Maintain | Positive | 2024-10-18 |
| Keybanc | Maintain | Overweight | 2024-10-16 |
| Truist Securities | Maintain | Buy | 2024-10-16 |
| Piper Sandler | Maintain | Overweight | 2024-10-15 |
| Scotiabank | Maintain | Sector Outperform | 2024-10-10 |
| BMO Capital | Upgrade | Outperform | 2024-10-04 |
| Benchmark | Maintain | Buy | 2024-10-03 |
| Barclays | Upgrade | Overweight | 2024-10-02 |
| Wells Fargo | Maintain | Overweight | 2024-10-01 |
Diamondback Energy shows a consistent trend of positive ratings, with multiple upgrades and predominantly “Overweight” and “Buy” grades.
Texas Pacific Land Corporation Grades
Below are the recent grades from recognized grading companies:
| Grading Company | Action | New Grade | Date |
|---|---|---|---|
| BWS Financial | Maintain | Buy | 2024-08-12 |
| BWS Financial | Maintain | Buy | 2024-05-10 |
| BWS Financial | Maintain | Buy | 2024-04-02 |
| Stifel | Maintain | Hold | 2024-01-23 |
| Stifel | Maintain | Hold | 2023-11-30 |
| Stifel | Maintain | Hold | 2023-05-22 |
| Stifel | Maintain | Hold | 2023-05-21 |
| Stifel | Maintain | Hold | 2023-04-27 |
| Stifel | Maintain | Hold | 2023-04-26 |
| Stifel | Maintain | Hold | 2023-04-12 |
Texas Pacific Land Corporation’s ratings mostly reflect a “Hold” status from Stifel, contrasted with repeated “Buy” ratings from BWS Financial.
Which company has the best grades?
Diamondback Energy, Inc. has received stronger and more consistent positive grades, including multiple “Overweight” and “Buy” recommendations with recent upgrades. Texas Pacific Land Corporation’s grades show a mix, largely “Hold” ratings with fewer “Buy” endorsements. This disparity may influence investors’ perception of growth potential and risk.
Strengths and Weaknesses
Below is a comparative summary of key strengths and weaknesses for Diamondback Energy, Inc. (FANG) and Texas Pacific Land Corporation (TPL) based on recent financial and operational data.
| Criterion | Diamondback Energy, Inc. (FANG) | Texas Pacific Land Corporation (TPL) |
|---|---|---|
| Diversification | Moderate, primarily upstream services with some midstream exposure | Diversified revenue streams including royalties, easements, and water sales |
| Profitability | Moderate net margin (30.3%), neutral ROIC (5.75%), some cost efficiency | High net margin (64.3%), strong ROIC (35.6%), excellent profitability |
| Innovation | Limited innovation focus, traditional energy exploration and production | Innovation in land and resource management, royalty monetization |
| Global presence | Primarily US-focused in oil and gas sectors | US-based land holdings, niche market with no global footprint |
| Market Share | Significant in upstream oil services but competitive sector | Unique land asset base with durable competitive advantage |
Key takeaways: Texas Pacific Land Corporation stands out with superior profitability, a durable economic moat, and diversified revenue streams. Diamondback Energy, while showing improving profitability, faces challenges with limited diversification and efficiency, positioning TPL as a more defensible investment in energy-related assets.
Risk Analysis
Below is a comparison of key risks for Diamondback Energy, Inc. (FANG) and Texas Pacific Land Corporation (TPL) as of 2024.
| Metric | Diamondback Energy, Inc. (FANG) | Texas Pacific Land Corporation (TPL) |
|---|---|---|
| Market Risk | Moderate (Beta 0.58) | Moderate-High (Beta 0.94) |
| Debt Level | Moderate (D/E 0.33, favorable) | Very Low (D/E 0.00, favorable) |
| Regulatory Risk | High (Oil & Gas sector scrutiny) | Moderate (Land & Water management) |
| Operational Risk | Elevated (many producing wells) | Low (focus on land & water services) |
| Environmental Risk | High (Permian Basin operations) | Moderate (water sourcing impact) |
| Geopolitical Risk | Moderate (US domestic focus) | Moderate (US domestic focus) |
The most impactful risk is Diamondback’s exposure to environmental and regulatory factors due to extensive oil and gas operations in the Permian Basin. Texas Pacific Land benefits from minimal debt and diversified land-based royalties but faces moderate risk from regulatory changes and water resource management. Investors should weigh Diamondback’s operational complexity against Texas Pacific’s steadier, asset-backed profile.
Which Stock to Choose?
Diamondback Energy, Inc. (FANG) shows a favorable income evolution with 71.43% positive income statement metrics, including strong revenue growth of 291.86% over five years. Its financial ratios are mostly favorable at 57.14%, but low current and quick ratios and moderate ROE indicate some liquidity and profitability challenges. The company carries moderate debt with a net debt to EBITDA of 1.61 and holds a very favorable A- rating, though its Altman Z-Score signals distress risk.
Texas Pacific Land Corporation (TPL) demonstrates very strong profitability and income growth, with 92.86% favorable income statement indicators and sustained revenue growth of 133.29%. Its financial ratios are similarly favorable at 57.14%, supported by excellent liquidity, no debt, and a very favorable A- rating. The Altman Z-Score places TPL firmly in the safe zone, reflecting robust financial health and low bankruptcy risk.
For investors, TPL’s very favorable rating, superior profitability, and strong financial health could appeal to those seeking stability and quality. Conversely, FANG’s rapid income growth and moderate rating might attract growth-oriented investors willing to accept higher liquidity and risk considerations. The choice could depend on an investor’s risk tolerance and preference for growth versus stability.
Disclaimer: Investment carries a risk of loss of initial capital. The past performance is not a reliable indicator of future results. Be sure to understand risks before making an investment decision.
Go Further
I encourage you to read the complete analyses of Diamondback Energy, Inc. and Texas Pacific Land Corporation to enhance your investment decisions: