Diamondback Energy, Inc. (FANG) and Occidental Petroleum Corporation (OXY) are two prominent players in the oil and gas exploration and production sector. Both companies focus on unconventional resources and possess significant operations in key U.S. basins, though Occidental also maintains a global footprint and diversified chemical and midstream segments. This comparison explores their strategies, market positions, and growth potential to help you identify the most compelling investment opportunity in energy today.
Table of contents
Companies Overview
I will begin the comparison between Diamondback Energy, Inc. and Occidental Petroleum Corporation by providing an overview of these two companies and their main differences.
Diamondback Energy, Inc. Overview
Diamondback Energy, Inc. is an independent oil and natural gas company focused on acquiring, developing, and exploiting unconventional and onshore reserves primarily in the Permian Basin in West Texas. Founded in 2007 and headquartered in Midland, Texas, it holds significant acreage and operates thousands of producing wells, as well as midstream infrastructure assets. The company aims to maximize resource value within its core geographic regions.
Occidental Petroleum Corporation Overview
Occidental Petroleum Corporation, founded in 1920 and based in Houston, Texas, operates across multiple regions including the US, Middle East, Africa, and Latin America. It is diversified into three main segments: Oil and Gas, Chemicals, and Midstream and Marketing. Occidental engages in exploration, development, production, and marketing of oil, gas, and chemical products, leveraging a broad asset base and global footprint to serve various markets.
Key similarities and differences
Both companies operate in the Oil & Gas Exploration & Production industry with a focus on upstream activities. Diamondback is more geographically concentrated in the Permian Basin, while Occidental has a diversified global presence and a broader business model including chemicals and midstream operations. Diamondback’s smaller workforce contrasts with Occidental’s larger scale and diversified segments, reflecting different strategic approaches within the energy sector.
Income Statement Comparison
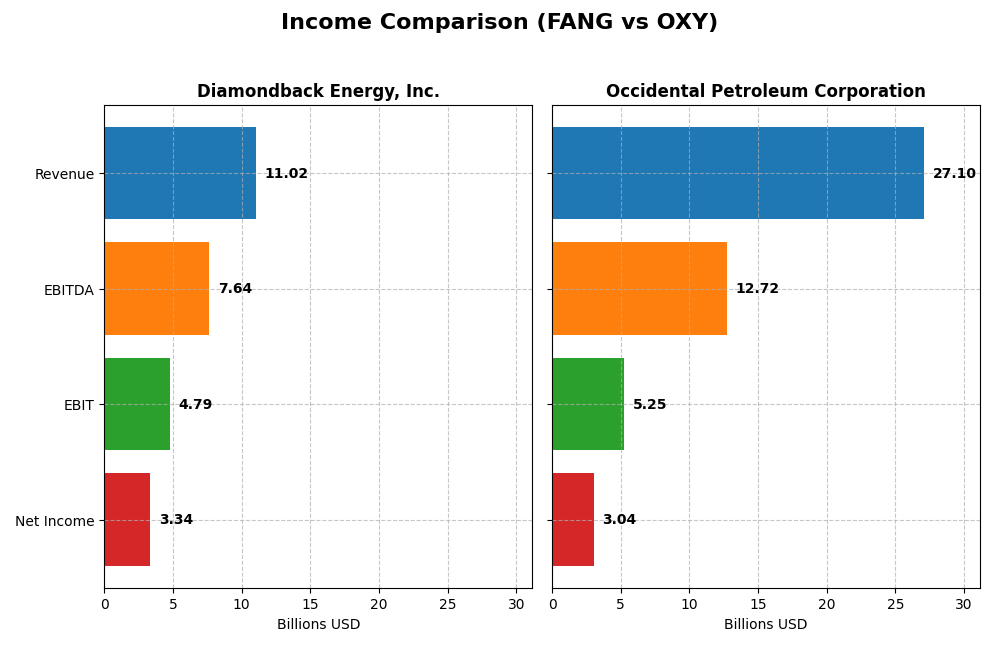
This table compares key income statement metrics for Diamondback Energy, Inc. (FANG) and Occidental Petroleum Corporation (OXY) for the fiscal year 2024.
| Metric | Diamondback Energy, Inc. (FANG) | Occidental Petroleum Corporation (OXY) |
|---|---|---|
| Market Cap | 42.9B | 42.2B |
| Revenue | 11.0B | 27.1B |
| EBITDA | 7.64B | 12.7B |
| EBIT | 4.79B | 5.25B |
| Net Income | 3.34B | 3.04B |
| EPS | 15.53 | 2.59 |
| Fiscal Year | 2024 | 2024 |
Income Statement Interpretations
Diamondback Energy, Inc.
Diamondback Energy showed strong revenue growth from 2020 to 2024, increasing from $2.8B to $11.0B, with net income rising from a loss of $4.5B in 2020 to $3.3B in 2024. Gross and EBIT margins remained favorable, around 45% and 43% respectively. In 2024, revenue surged 32% but net margin and EPS declined slightly, indicating some pressure on profitability despite top-line strength.
Occidental Petroleum Corporation
Occidental’s revenue grew overall from $17.1B in 2020 to $27.1B in 2024, though it declined 4.3% in the latest year. Net income recovered from a $14.8B loss in 2020 to $3.0B in 2024, but the net margin of 11.2% is considerably lower than Diamondback’s. EBIT margin also fell sharply in 2024. The recent year saw declines in revenue, EBIT, net margin, and EPS, reflecting challenges in maintaining profitability.
Which one has the stronger fundamentals?
Diamondback Energy demonstrates stronger fundamentals with higher and more stable margins, significant revenue and net income growth over five years, and a more favorable recent-year revenue increase despite margin pressures. Occidental has improved from heavy losses but faces declining profitability and shrinking margins recently. Overall, Diamondback’s income statement metrics portray better operational efficiency and growth sustainability based on the data provided.
Financial Ratios Comparison
The table below presents key financial ratios for Diamondback Energy, Inc. (FANG) and Occidental Petroleum Corporation (OXY) based on their most recent fiscal year data from 2024.
| Ratios | Diamondback Energy, Inc. (FANG) | Occidental Petroleum Corporation (OXY) |
|---|---|---|
| ROE | 8.85% | 8.91% |
| ROIC | 5.75% | 5.48% |
| P/E | 10.48 | 14.81 |
| P/B | 0.93 | 1.32 |
| Current Ratio | 0.44 | 0.95 |
| Quick Ratio | 0.41 | 0.73 |
| D/E | 0.33 | 0.79 |
| Debt-to-Assets | 18.47% | 31.72% |
| Interest Coverage | 15.11 | 5.08 |
| Asset Turnover | 0.16 | 0.32 |
| Fixed Asset Turnover | 0.17 | 0.39 |
| Payout ratio | 47.27% | 47.52% |
| Dividend yield | 4.51% | 3.21% |
Interpretation of the Ratios
Diamondback Energy, Inc.
Diamondback Energy exhibits a favorable net margin of 30.28% and strong valuations with a PE of 10.48 and a PB below 1, signaling undervaluation. However, the low current and quick ratios (0.44 and 0.41) indicate liquidity concerns. Debt levels and interest coverage are favorable, but asset turnover ratios are weak. The company pays a healthy dividend with a 4.51% yield, supported by moderate payout ratios and free cash flow coverage.
Occidental Petroleum Corporation
Occidental shows a favorable net margin of 11.23% and decent valuation ratios, though its PE and PB are higher compared to Diamondback. Liquidity ratios are better but still below 1, and debt measures are neutral with a higher debt-to-equity ratio of 0.79. Interest coverage is moderate, and asset turnover remains weak. The dividend yield stands at 3.21%, reflecting a consistent payout backed by stable cash flows, though some ratios suggest cautious monitoring.
Which one has the best ratios?
Diamondback Energy has a more favorable overall ratio profile with 57.14% favorable metrics versus Occidental’s 35.71%. Despite weaker liquidity, Diamondback’s stronger profitability, lower valuation multiples, and higher dividend yield suggest a more robust financial footing. Occidental’s ratios are more mixed with a neutral global opinion, highlighting certain strengths but also some financial concerns.
Strategic Positioning
This section compares the strategic positioning of Diamondback Energy, Inc. and Occidental Petroleum Corporation covering Market position, Key segments, and Exposure to technological disruption:
Diamondback Energy, Inc.
- Focused on unconventional onshore oil and gas in Permian Basin with moderate competitive pressure.
- Primarily upstream services with some midstream asset ownership; revenue driven by oil and gas production.
- Limited technological disruption exposure; focused on traditional oil and gas exploration and development.
Occidental Petroleum Corporation
- Operates globally with diversified competitive pressures across regions and sectors.
- Diversified across oil and gas, chemicals, and midstream segments contributing significantly to revenue.
- Exposure to technological disruption mitigated by diversified chemical and midstream businesses.
Diamondback Energy, Inc. vs Occidental Petroleum Corporation Positioning
Diamondback has a concentrated strategy centered on Permian Basin upstream and midstream operations, offering focused expertise but limited diversification. Occidental’s diversified approach spans oil, chemicals, and midstream segments, potentially balancing risks but requiring complex management.
Which has the best competitive advantage?
Both companies show slightly favorable moat status with growing ROIC trends but have not yet demonstrated strong competitive advantages, indicating improving profitability without clear economic moat dominance.
Stock Comparison
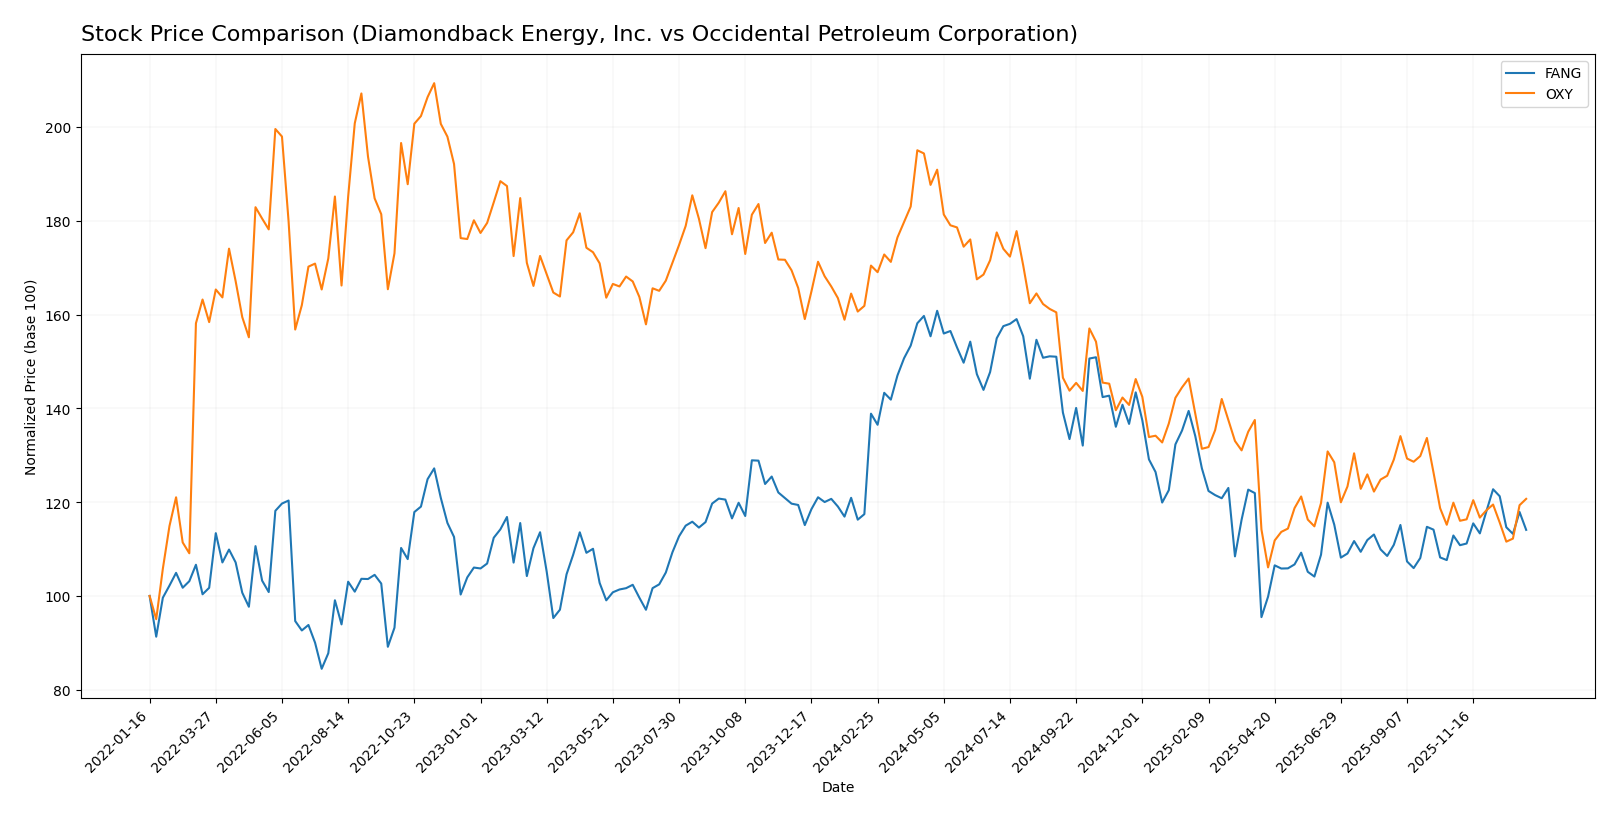
The stock prices of Diamondback Energy, Inc. (FANG) and Occidental Petroleum Corporation (OXY) have both experienced notable declines over the past 12 months, with recent periods showing near-neutral to slight positive price changes amid varying trading dynamics.
Trend Analysis
Diamondback Energy, Inc. (FANG) shows a bearish trend over the past year with a -17.84% price change, accompanied by accelerating downward momentum and high volatility (std deviation 23.76). Recent weeks indicate a slight bullish shift with a 1.06% increase.
Occidental Petroleum Corporation (OXY) also exhibits a bearish trend over the last 12 months, declining -29.18% with accelerating negative momentum and lower volatility (std deviation 8.33). The recent trend is nearly flat with a 0.68% gain but a slight negative slope.
Comparing both, FANG has delivered a smaller decline than OXY over the past year and shows a more positive recent price trend, indicating relatively better market performance despite ongoing bearish conditions.
Target Prices
Analysts present a clear consensus on target prices for Diamondback Energy, Inc. and Occidental Petroleum Corporation.
| Company | Target High | Target Low | Consensus |
|---|---|---|---|
| Diamondback Energy, Inc. | 219 | 162 | 185.36 |
| Occidental Petroleum Corporation | 64 | 38 | 49.36 |
For Diamondback Energy, the consensus target price of 185.36 suggests a significant upside from the current price of 147.41. Occidental Petroleum’s target consensus at 49.36 also indicates potential gains compared to its current price of 42.86.
Analyst Opinions Comparison
This section compares analysts’ ratings and grades for Diamondback Energy, Inc. (FANG) and Occidental Petroleum Corporation (OXY):
Rating Comparison
FANG Rating
- Rating: A- indicating a very favorable overall assessment.
- Discounted Cash Flow Score: 5, reflecting a very favorable valuation.
- ROE Score: 4, showing favorable efficiency in generating shareholder profit.
- ROA Score: 4, favorable asset utilization for earnings generation.
- Debt To Equity Score: 2, moderate financial risk with some leverage.
- Overall Score: 4, favorable financial standing summary.
OXY Rating
- Rating: B+ also signaling a very favorable overall assessment.
- Discounted Cash Flow Score: 5, equally very favorable valuation.
- ROE Score: 3, moderate efficiency in using equity for profit.
- ROA Score: 4, favorable effectiveness in asset earnings use.
- Debt To Equity Score: 1, very unfavorable with high financial risk.
- Overall Score: 3, moderate financial standing summary.
Which one is the best rated?
Based strictly on provided data, FANG holds a higher overall rating (A- vs B+), stronger ROE, and a better overall score compared to OXY. However, OXY scores lower on debt to equity, indicating higher financial risk.
Scores Comparison
Here is a comparison of the Altman Z-Score and Piotroski Score for Diamondback Energy, Inc. (FANG) and Occidental Petroleum Corporation (OXY):
FANG Scores
- Altman Z-Score: 1.33, in the distress zone indicating risk.
- Piotroski Score: 5, reflecting an average financial strength.
OXY Scores
- Altman Z-Score: 1.39, also in the distress zone indicating risk.
- Piotroski Score: 5, reflecting an average financial strength.
Which company has the best scores?
Both FANG and OXY have Altman Z-Scores in the distress zone, signaling financial risk. Their Piotroski Scores are identical at 5, indicating average financial strength, so neither company has a clear advantage based on these scores.
Grades Comparison
Here is a detailed comparison of the recent grades assigned to Diamondback Energy, Inc. and Occidental Petroleum Corporation:
Diamondback Energy, Inc. Grades
The following table shows recent grades from reputable financial institutions for Diamondback Energy, Inc.:
| Grading Company | Action | New Grade | Date |
|---|---|---|---|
| Wells Fargo | Maintain | Overweight | 2024-10-18 |
| Susquehanna | Maintain | Positive | 2024-10-18 |
| Keybanc | Maintain | Overweight | 2024-10-16 |
| Truist Securities | Maintain | Buy | 2024-10-16 |
| Piper Sandler | Maintain | Overweight | 2024-10-15 |
| Scotiabank | Maintain | Sector Outperform | 2024-10-10 |
| BMO Capital | Upgrade | Outperform | 2024-10-04 |
| Benchmark | Maintain | Buy | 2024-10-03 |
| Barclays | Upgrade | Overweight | 2024-10-02 |
| Wells Fargo | Maintain | Overweight | 2024-10-01 |
Diamondback Energy consistently receives positive ratings, with several institutions maintaining or upgrading to overweight, buy, or outperform grades.
Occidental Petroleum Corporation Grades
The following table summarizes recent grades from established rating firms for Occidental Petroleum Corporation:
| Grading Company | Action | New Grade | Date |
|---|---|---|---|
| UBS | Maintain | Neutral | 2025-12-12 |
| B of A Securities | Maintain | Neutral | 2025-12-11 |
| JP Morgan | Downgrade | Underweight | 2025-12-08 |
| Citigroup | Maintain | Neutral | 2025-11-19 |
| Piper Sandler | Maintain | Neutral | 2025-11-18 |
| Susquehanna | Maintain | Positive | 2025-11-13 |
| Wells Fargo | Maintain | Underweight | 2025-11-12 |
| Mizuho | Maintain | Outperform | 2025-11-11 |
| Piper Sandler | Maintain | Neutral | 2025-10-21 |
| Susquehanna | Maintain | Positive | 2025-10-20 |
Occidental Petroleum shows a more mixed profile with a predominance of neutral and underweight ratings, though some positive and outperform grades appear.
Which company has the best grades?
Diamondback Energy, Inc. has generally received stronger and more consistent positive grades than Occidental Petroleum Corporation, whose ratings are more mixed and include downgrades. This disparity could influence investor perception of risk and growth potential between the two companies.
Strengths and Weaknesses
Below is a comparison of key strengths and weaknesses for Diamondback Energy, Inc. (FANG) and Occidental Petroleum Corporation (OXY) based on their latest financial and operational data.
| Criterion | Diamondback Energy, Inc. (FANG) | Occidental Petroleum Corporation (OXY) |
|---|---|---|
| Diversification | Focused mainly on upstream services; limited diversification beyond oil exploration and production | More diversified with significant revenue from oil & gas, chemicals, and midstream segments |
| Profitability | High net margin of 30.28%; favorable PE and dividend yield; moderate ROIC at 5.75% | Moderate net margin of 11.23%; favorable PE and dividend yield; ROIC at 5.48%, slightly lower |
| Innovation | Limited data suggesting innovation focus; steady ROIC growth indicates operational improvements | No explicit innovation data; strong ROIC growth suggests efficiency gains |
| Global presence | Primarily US-focused operations, limited global footprint | Broader global presence with diversified segments including chemicals and midstream operations |
| Market Share | Concentrated in upstream oil services, growing revenue in that segment | Larger overall revenue base with diversified market segments, stronger market footprint |
Key takeaways: Both companies show improving profitability trends with slightly favorable moats, but Occidental’s broader diversification and global presence provide a more balanced risk profile. Diamondback’s high net margin and focused upstream operations offer strong returns but with higher exposure to oil price volatility.
Risk Analysis
The table below summarizes key risk factors for Diamondback Energy, Inc. (FANG) and Occidental Petroleum Corporation (OXY) based on the latest 2024 data:
| Metric | Diamondback Energy, Inc. (FANG) | Occidental Petroleum Corporation (OXY) |
|---|---|---|
| Market Risk | Moderate (Beta 0.58, oil price sensitivity) | Lower (Beta 0.38, diversified segments) |
| Debt level | Low (Debt/Equity 0.33, favorable) | Moderate-High (Debt/Equity 0.79, neutral to unfavorable) |
| Regulatory Risk | Moderate (US-centric, environmental regulations) | High (Global operations in politically sensitive areas) |
| Operational Risk | Moderate (focus on Permian Basin, midstream assets) | High (complex operations across oil, chemicals, midstream) |
| Environmental Risk | Moderate (Permian Basin impacts, pipeline operations) | High (chemical segment and global footprint) |
| Geopolitical Risk | Low (US-focused) | High (Middle East, Africa, Latin America exposure) |
Both companies face significant market and operational risks inherent to the oil & gas sector. Diamondback’s lower leverage and US-centric operations reduce some financial and geopolitical risks. Occidental’s higher debt and global exposure increase vulnerability to regulatory, geopolitical, and environmental uncertainties. Recent financial distress signals (Altman Z-scores below 1.8) for both firms highlight elevated bankruptcy risk, emphasizing cautious risk management.
Which Stock to Choose?
Diamondback Energy, Inc. (FANG) shows strong income growth with a favorable net margin of 30.28% and stable gross and EBIT margins. Its financial ratios are mostly favorable, including a solid dividend yield of 4.51% and low debt ratios, though liquidity ratios are weak. Profitability is moderate with ROE at 8.85%, and the company holds a very favorable A- rating.
Occidental Petroleum Corporation (OXY) demonstrates a favorable but lower net margin of 11.23% and moderate profitability with ROE near 8.91%. Its financial ratios present a neutral overall stance, with higher debt levels and moderate interest coverage. The company’s rating is very favorable at B+ but with some concern over debt-to-equity and liquidity metrics.
Considering the ratings and overall financial evaluations, FANG might appear more attractive for investors seeking favorable profitability and dividend yield, while OXY could be seen as a neutral option with slightly higher financial risk. Risk-averse investors could favor OXY’s steadier metrics, whereas those prioritizing income growth and yield might lean toward FANG.
Disclaimer: Investment carries a risk of loss of initial capital. The past performance is not a reliable indicator of future results. Be sure to understand risks before making an investment decision.
Go Further
I encourage you to read the complete analyses of Diamondback Energy, Inc. and Occidental Petroleum Corporation to enhance your investment decisions: