Diamondback Energy, Inc. (FANG) and EQT Corporation (EQT) are two prominent players in the oil and gas exploration and production industry in the United States. While Diamondback focuses largely on oil extraction in the Permian Basin, EQT specializes in natural gas production, particularly in the Marcellus play. Both companies emphasize innovation and resource development, making them compelling options for investors seeking exposure to energy markets. This article will help you decide which company offers the most attractive investment opportunity.
Table of contents
Companies Overview
I will begin the comparison between Diamondback Energy and EQT Corporation by providing an overview of these two companies and their main differences.
Diamondback Energy Overview
Diamondback Energy, Inc. is an independent oil and natural gas company specializing in the acquisition, development, exploration, and exploitation of unconventional and onshore oil and natural gas reserves in the Permian Basin, West Texas. Founded in 2007 and headquartered in Midland, Texas, it manages extensive acreage and midstream infrastructure, focusing on the Spraberry, Wolfcamp, and Bone Spring formations. Its market capitalization stands at $42.9B.
EQT Corporation Overview
EQT Corporation operates primarily as a natural gas producer in the United States, with significant reserves of natural gas and natural gas liquids, including ethane and propane. Founded in 1878 and based in Pittsburgh, Pennsylvania, EQT holds approximately 2.0M gross acres mostly in the Marcellus play. It is listed on the NYSE and has a market capitalization of $31.9B, reflecting its role in the energy sector focused on natural gas production.
Key similarities and differences
Both Diamondback Energy and EQT operate in the oil and gas exploration and production industry, with an emphasis on natural resources in the United States. While Diamondback focuses on oil and natural gas in the Permian Basin with substantial midstream assets, EQT concentrates on natural gas and liquids across larger acreage in the Marcellus region. Their business models differ in resource focus, reserve types, and geographic concentration, impacting their market presence and operational strategies.
Income Statement Comparison
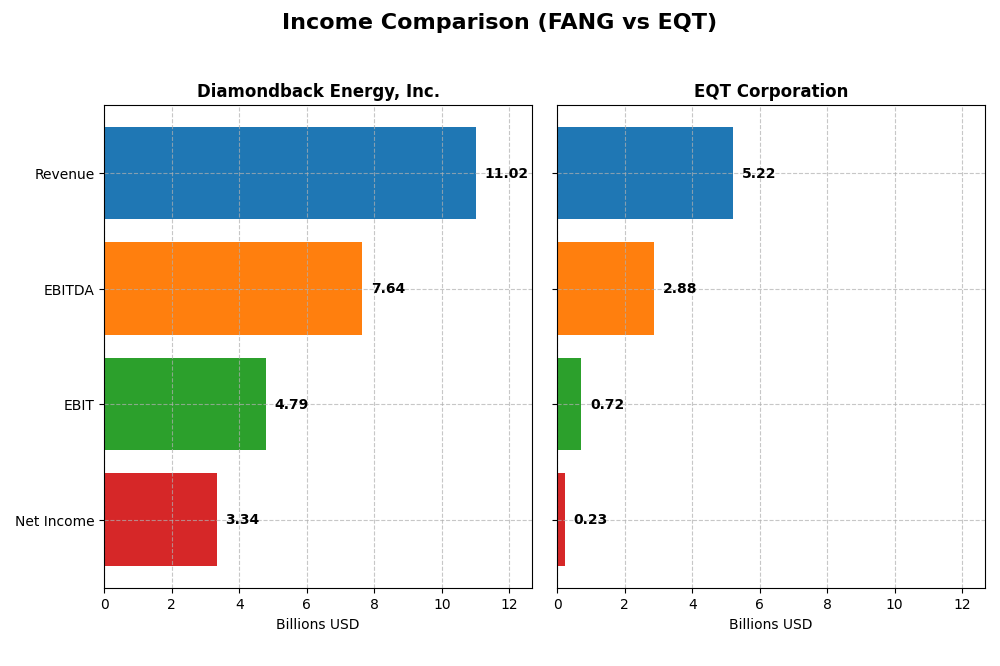
This table compares the most recent fiscal year income statement metrics of Diamondback Energy, Inc. and EQT Corporation, providing key financial figures for an informed analysis.
| Metric | Diamondback Energy, Inc. (FANG) | EQT Corporation (EQT) |
|---|---|---|
| Market Cap | 42.9B | 31.9B |
| Revenue | 11.0B | 5.2B |
| EBITDA | 7.6B | 2.9B |
| EBIT | 4.8B | 719M |
| Net Income | 3.3B | 231M |
| EPS | 15.53 | 0.45 |
| Fiscal Year | 2024 | 2024 |
Income Statement Interpretations
Diamondback Energy, Inc.
Diamondback Energy exhibited strong revenue growth from 2020 to 2024, surging by nearly 292%. Net income followed a positive trend, increasing by 174% over the same period. Margins remained robust, with gross margin at 45.11% and net margin at 30.28% in 2024. The latest year saw revenue growth slow to 32.19%, while net margin and EPS declined, signaling margin pressure despite top-line strength.
EQT Corporation
EQT showed moderate revenue growth of 96% from 2020 to 2024, with net income rising 124%. Margins were more constrained, with a 14.69% gross margin and 4.42% net margin in 2024. The most recent year reflected a slowdown, with only 3% revenue growth and significant declines in gross profit (-18.52%), EBIT (-69.05%), and net margin (-87.1%), indicating weaker operational performance.
Which one has the stronger fundamentals?
Diamondback Energy holds stronger fundamentals, supported by higher margins, more consistent revenue growth, and a favorable overall income statement evaluation (71% favorable). EQT’s neutral income statement opinion, coupled with recent declines in profitability metrics and margin pressures, suggest more volatility. Diamondback’s better margin control and growth trajectory position it with a more favorable income profile.
Financial Ratios Comparison
The table below presents a side-by-side comparison of key financial ratios for Diamondback Energy, Inc. (FANG) and EQT Corporation (EQT) for the fiscal year ending 2024, highlighting their recent financial performance and leverage metrics.
| Ratios | Diamondback Energy, Inc. (FANG) | EQT Corporation (EQT) |
|---|---|---|
| ROE | 8.85% | 1.12% |
| ROIC | 5.75% | 1.66% |
| P/E | 10.48 | 101.91 |
| P/B | 0.93 | 1.14 |
| Current Ratio | 0.44 | 0.70 |
| Quick Ratio | 0.41 | 0.70 |
| D/E (Debt-to-Equity) | 0.33 | 0.45 |
| Debt-to-Assets | 18.47% | 23.51% |
| Interest Coverage | 15.11 | 1.51 |
| Asset Turnover | 0.16 | 0.13 |
| Fixed Asset Turnover | 0.17 | 0.16 |
| Payout Ratio | 47.27% | 141.64% |
| Dividend Yield | 4.51% | 1.39% |
Interpretation of the Ratios
Diamondback Energy, Inc.
Diamondback Energy presents a generally favorable ratio profile with strong net margin at 30.28% and a solid dividend yield of 4.51%. However, its return on equity (8.85%) and asset turnover ratios are weak, and liquidity ratios are low, suggesting potential short-term solvency risks. The company pays dividends with a well-covered payout, indicating shareholder returns are stable but watch for liquidity constraints.
EQT Corporation
EQT Corporation shows predominantly unfavorable ratios, including low net margin (4.42%), return on equity (1.12%), and interest coverage (1.58), which raises concerns about profitability and debt servicing. Its dividend yield is modest at 1.39%, reflecting a cautious payout. The company’s liquidity ratios remain below 1, indicating potential short-term funding challenges alongside weak operational efficiency.
Which one has the best ratios?
Diamondback Energy holds a more favorable overall ratio profile than EQT Corporation, with higher profitability, better dividend yield, and stronger debt management metrics. EQT’s ratios reveal profitability and liquidity weaknesses despite some favorable debt ratios. Therefore, Diamondback Energy currently demonstrates a stronger financial ratio standing based on the 2024 data.
Strategic Positioning
This section compares the strategic positioning of Diamondback Energy, Inc. and EQT Corporation in terms of market position, key segments, and exposure to technological disruption:
Diamondback Energy, Inc.
- Mid-sized oil & gas producer focused on Permian Basin, facing competitive pressure in unconventional oil markets.
- Revenue driven mainly by upstream services, including exploration and production; also operates midstream infrastructure.
- Limited explicit exposure to technological disruption noted; operates with traditional exploration and midstream assets.
EQT Corporation
- Natural gas producer with significant presence in Marcellus play, competing in U.S. natural gas sector.
- Revenue primarily from natural gas and NGLs sales, with oil sales as a minor segment.
- No direct mention of technological disruption exposure; focuses on natural gas production and related liquids.
Diamondback Energy, Inc. vs EQT Corporation Positioning
Diamondback shows a diversified business model with upstream and midstream operations concentrated in the Permian Basin, while EQT focuses on natural gas and NGLs production mainly in the Marcellus region. Diamondback’s midstream assets provide operational integration, contrasting with EQT’s more concentrated natural gas sales focus.
Which has the best competitive advantage?
Based on MOAT evaluation, Diamondback has a slightly favorable position with growing ROIC above WACC, indicating improving profitability. EQT shows a slightly unfavorable MOAT, with ROIC below WACC despite growth, reflecting ongoing value destruction.
Stock Comparison
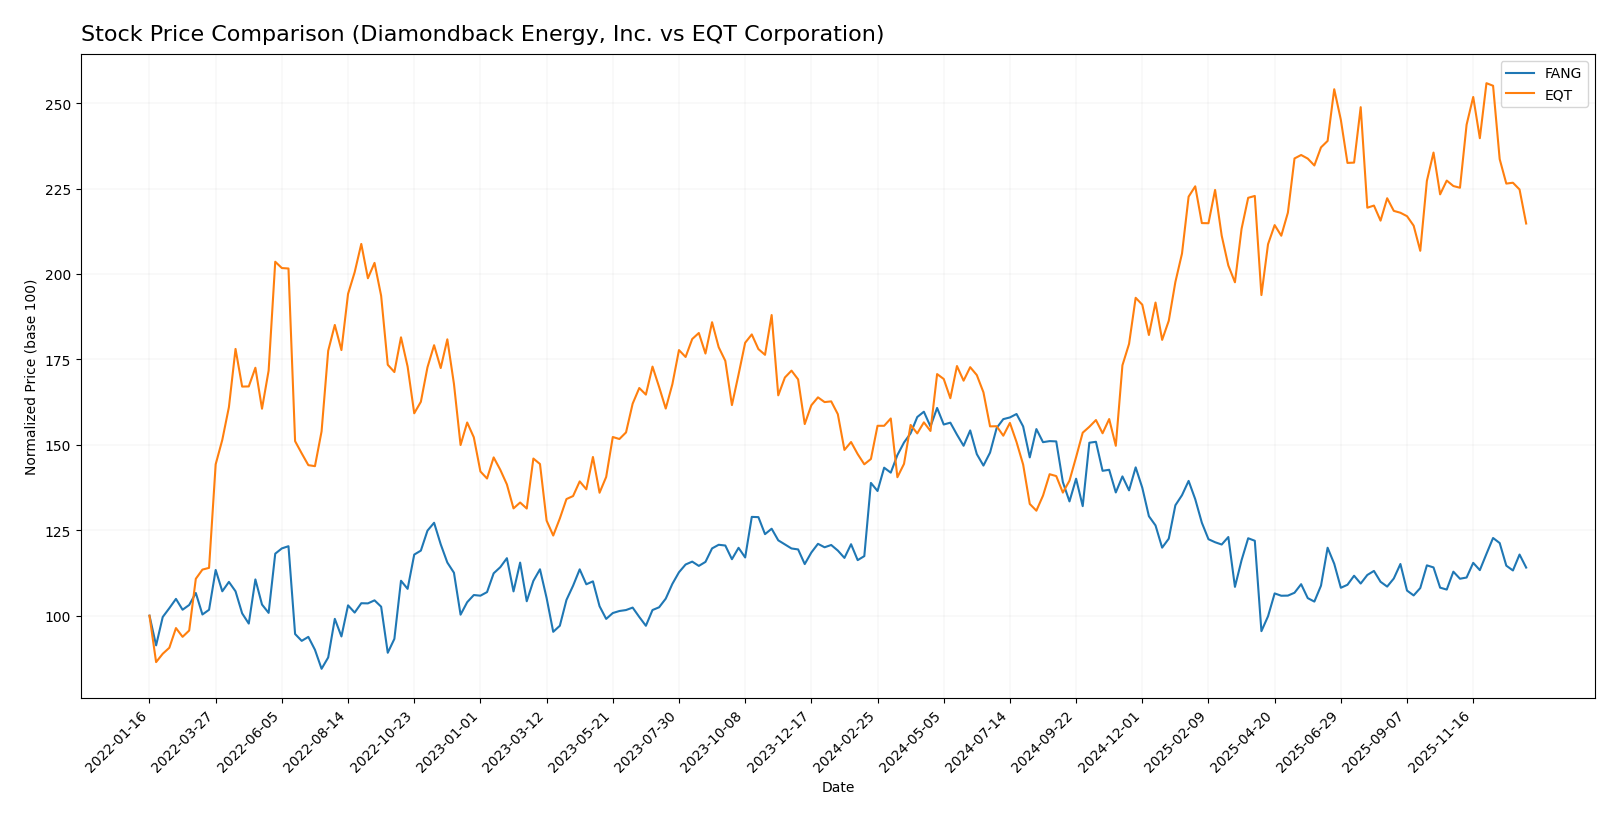
The stock price movements of Diamondback Energy, Inc. (FANG) and EQT Corporation (EQT) over the past 12 months reveal contrasting trends with notable shifts in momentum and trading volumes.
Trend Analysis
Diamondback Energy, Inc. (FANG) experienced a bearish trend over the past year with a price decline of 17.84%, showing acceleration in its downward movement. The stock fluctuated between 123.37 and 207.76, with high volatility indicated by a standard deviation of 23.76.
EQT Corporation (EQT) showed a bullish trend over the same period, gaining 47.23%. This trend decelerated toward the end of the year, with the price ranging from 31.1 to 60.86 and relatively lower volatility at a standard deviation of 8.62.
Comparing both stocks, EQT delivered significantly higher market performance than FANG over the past 12 months, despite a recent short-term decline for EQT and a near-neutral recent trend for FANG.
Target Prices
The current analyst consensus for target prices indicates a positive outlook for both Diamondback Energy, Inc. and EQT Corporation.
| Company | Target High | Target Low | Consensus |
|---|---|---|---|
| Diamondback Energy, Inc. | 219 | 162 | 185.36 |
| EQT Corporation | 55 | 23 | 41.11 |
Analysts expect Diamondback Energy’s stock to appreciate significantly from its current price of $147.41, while EQT Corporation’s consensus target suggests moderate upside from its current price of $51.09.
Analyst Opinions Comparison
This section compares analysts’ ratings and grades for Diamondback Energy, Inc. (FANG) and EQT Corporation (EQT):
Rating Comparison
FANG Rating
- Rating: A-, rated Very Favorable overall.
- Discounted Cash Flow Score: 5, Very Favorable, indicating strong future cash flow projections.
- ROE Score: 4, Favorable, showing efficient profit generation from equity.
- ROA Score: 4, Favorable, reflecting effective asset utilization.
- Debt To Equity Score: 2, Moderate, suggesting some financial risk from leverage.
- Overall Score: 4, Favorable, summarizing solid financial standing.
EQT Rating
- Rating: A-, rated Very Favorable overall.
- Discounted Cash Flow Score: 5, Very Favorable, indicating strong future cash flow projections.
- ROE Score: 4, Favorable, showing efficient profit generation from equity.
- ROA Score: 4, Favorable, reflecting effective asset utilization.
- Debt To Equity Score: 2, Moderate, suggesting some financial risk from leverage.
- Overall Score: 4, Favorable, summarizing solid financial standing.
Which one is the best rated?
Based on the provided data, both FANG and EQT have identical ratings and scores across all evaluated metrics, including overall, DCF, ROE, ROA, and debt-to-equity scores. Neither company is rated better than the other.
Scores Comparison
Here is the comparison of the Altman Z-Score and Piotroski Score for both companies:
FANG Scores
- Altman Z-Score: 1.33, in distress zone indicating financial distress risk.
- Piotroski Score: 5, average financial strength and value potential.
EQT Scores
- Altman Z-Score: 2.01, in grey zone indicating moderate bankruptcy risk.
- Piotroski Score: 8, very strong financial strength and investment quality.
Which company has the best scores?
EQT has higher scores than FANG, with a better Altman Z-Score in the grey zone versus distress zone, and a very strong Piotroski Score compared to FANG’s average score.
Grades Comparison
Here is a detailed comparison of the latest grades from recognized grading companies for both Diamondback Energy, Inc. and EQT Corporation:
Diamondback Energy, Inc. Grades
The following table summarizes recent grades and actions from established financial institutions:
| Grading Company | Action | New Grade | Date |
|---|---|---|---|
| Wells Fargo | Maintain | Overweight | 2024-10-18 |
| Susquehanna | Maintain | Positive | 2024-10-18 |
| Keybanc | Maintain | Overweight | 2024-10-16 |
| Truist Securities | Maintain | Buy | 2024-10-16 |
| Piper Sandler | Maintain | Overweight | 2024-10-15 |
| Scotiabank | Maintain | Sector Outperform | 2024-10-10 |
| BMO Capital | Upgrade | Outperform | 2024-10-04 |
| Benchmark | Maintain | Buy | 2024-10-03 |
| Barclays | Upgrade | Overweight | 2024-10-02 |
| Wells Fargo | Maintain | Overweight | 2024-10-01 |
Overall, Diamondback Energy’s grades trend positively, with multiple “Overweight,” “Buy,” and “Outperform” ratings, including recent upgrades.
EQT Corporation Grades
Below is a summary of the latest grades from reputable grading companies:
| Grading Company | Action | New Grade | Date |
|---|---|---|---|
| Bernstein | Maintain | Outperform | 2026-01-05 |
| Citigroup | Maintain | Buy | 2025-12-19 |
| Mizuho | Maintain | Outperform | 2025-12-12 |
| UBS | Maintain | Buy | 2025-12-12 |
| Scotiabank | Maintain | Sector Perform | 2025-11-21 |
| Piper Sandler | Maintain | Neutral | 2025-11-18 |
| Wells Fargo | Maintain | Overweight | 2025-10-23 |
| UBS | Maintain | Buy | 2025-10-17 |
| Scotiabank | Maintain | Sector Perform | 2025-10-09 |
| Barclays | Maintain | Overweight | 2025-10-07 |
EQT Corporation’s ratings show a stable outlook with a mix of “Buy,” “Outperform,” and “Overweight” grades, but also some “Neutral” and “Sector Perform” indications.
Which company has the best grades?
Diamondback Energy, Inc. receives a stronger consensus with more frequent “Buy” and “Overweight” ratings, including recent upgrades, while EQT Corporation has a more mixed profile with some neutral evaluations. This difference could influence investor confidence and portfolio weightings based on perceived momentum and analyst enthusiasm.
Strengths and Weaknesses
Below is a comparative overview of key strengths and weaknesses for Diamondback Energy, Inc. (FANG) and EQT Corporation (EQT) based on their latest financial and operational data.
| Criterion | Diamondback Energy, Inc. (FANG) | EQT Corporation (EQT) |
|---|---|---|
| Diversification | Moderate: Primarily upstream services with some midstream revenue (~$8.3B upstream, $440M midstream in 2023) | Moderate: Focus on natural gas and NGLs sales with some oil sales (~$4.9B oil in 2024, gas dominant) |
| Profitability | Strong net margin (30.28%), favorable PE (10.48), dividend yield 4.51% | Weak net margin (4.42%), high PE (101.91), lower dividend yield (1.39%) |
| Innovation | Neutral: ROIC growing but only slightly above WACC, indicating improving but limited competitive advantage | Neutral to unfavorable: ROIC below WACC, though improving, signals value destruction |
| Global presence | Limited: Primarily US-focused operations in oil and gas extraction | Limited: US-focused primarily on natural gas production and sales |
| Market Share | Solid in upstream oil services segment, revenues around $8.3B in 2023 | Leading in natural gas sales in US, with $4.5B+ in natural gas revenue |
Key takeaways: Diamondback Energy demonstrates stronger profitability and value creation potential, supported by favorable financial ratios and a growing ROIC trend. EQT, while improving, still struggles with profitability and value destruction despite its leadership in natural gas sales. Investors should weigh FANG’s better margin and dividend yield against EQT’s ongoing turnaround risks.
Risk Analysis
Below is a comparative table highlighting key risks for Diamondback Energy, Inc. (FANG) and EQT Corporation (EQT) based on 2024 data:
| Metric | Diamondback Energy, Inc. (FANG) | EQT Corporation (EQT) |
|---|---|---|
| Market Risk | Moderate (Beta 0.58, oil price sensitivity) | Moderate (Beta 0.68, natural gas market exposure) |
| Debt level | Low (Debt/Equity 0.33, favorable) | Moderate (Debt/Equity 0.45, favorable but higher) |
| Regulatory Risk | Moderate (Energy sector regulations, Permian Basin focus) | Moderate (Natural gas regulations, Marcellus play) |
| Operational Risk | Moderate (Large acreage and well operations) | Moderate (Extensive acreage, fewer employees) |
| Environmental Risk | Elevated (Oil production impact, Permian Basin) | Elevated (Natural gas extraction and emissions) |
| Geopolitical Risk | Moderate (US domestic focus, stable environment) | Moderate (US domestic focus, stable environment) |
Among these risks, environmental and market risks are the most likely and impactful for both companies. Diamondback’s oil price sensitivity and EQT’s natural gas market exposure pose significant revenue volatility. Additionally, Diamondback’s low debt level supports resilience, whereas EQT’s higher leverage and weaker interest coverage ratio increase financial risk. Both face regulatory scrutiny typical for energy producers, with environmental concerns increasingly influencing investor decisions. Recent financial stress signals for Diamondback (Altman Z-Score in distress zone) warrant cautious risk management.
Which Stock to Choose?
Diamondback Energy, Inc. (FANG) shows a favorable income evolution with a 32.19% revenue growth in 2024 and strong profitability indicators, including a 30.28% net margin. Its financial ratios are mostly favorable, with a solid debt profile and a strong rating of A-. However, liquidity ratios are weak, and free cash flow remains negative.
EQT Corporation (EQT) presents a more neutral income evolution with modest 3.0% revenue growth in 2024 and lower profitability, reflected by a 4.42% net margin. Its financial ratios are largely unfavorable, especially profitability and interest coverage, despite a moderate debt level. EQT also holds an A- rating but shows signs of financial strain in liquidity and cash flow metrics.
Investors focused on growth and profitability might find Diamondback Energy’s stronger income statement and favorable ratio profile more appealing, while those with a preference for companies showing improving profitability despite current challenges might consider EQT. The ratings and income evaluations suggest that FANG could be seen as the more robust performer, whereas EQT’s profile might appeal to those willing to tolerate higher risk for potential recovery.
Disclaimer: Investment carries a risk of loss of initial capital. The past performance is not a reliable indicator of future results. Be sure to understand risks before making an investment decision.
Go Further
I encourage you to read the complete analyses of Diamondback Energy, Inc. and EQT Corporation to enhance your investment decisions: