In the dynamic oil and gas sector, EOG Resources, Inc. and Diamondback Energy, Inc. stand out as prominent players with overlapping interests in exploration and production. Both companies focus heavily on the Permian Basin, leveraging innovative strategies to maximize resource extraction and operational efficiency. For investors seeking exposure to energy with growth potential, comparing these two firms offers valuable insight. Let’s explore which company presents the most compelling investment opportunity in 2026.
Table of contents
Companies Overview
I will begin the comparison between EOG Resources and Diamondback Energy by providing an overview of these two companies and their main differences.
EOG Resources Overview
EOG Resources, Inc. is an energy company focused on exploring, developing, producing, and marketing crude oil, natural gas, and natural gas liquids. It holds significant reserves primarily in New Mexico, Texas, and Trinidad and Tobago, with total estimated net proved reserves of 3,747 million barrels of oil equivalent. Incorporated in 1985 and headquartered in Houston, Texas, EOG is a well-established player in the Oil & Gas Exploration & Production industry.
Diamondback Energy Overview
Diamondback Energy, Inc. is an independent oil and natural gas company specializing in unconventional and onshore reserves in the Permian Basin, West Texas. The company owns a large acreage position of approximately 525K gross acres and substantial proved reserves of nearly 1.79B barrels of crude oil equivalent. Founded in 2007 and based in Midland, Texas, Diamondback also operates midstream infrastructure, focusing on pipeline and water systems in the Midland and Delaware Basins.
Key similarities and differences
Both EOG and Diamondback operate in the Oil & Gas Exploration & Production sector with a focus on U.S. shale and conventional reserves. EOG has a broader geographic scope including international assets, while Diamondback concentrates on the Permian Basin with significant midstream asset integration. EOG’s reserves and market cap are larger, reflecting a more diversified portfolio, whereas Diamondback specializes in unconventional onshore development with a smaller but focused asset base.
Income Statement Comparison
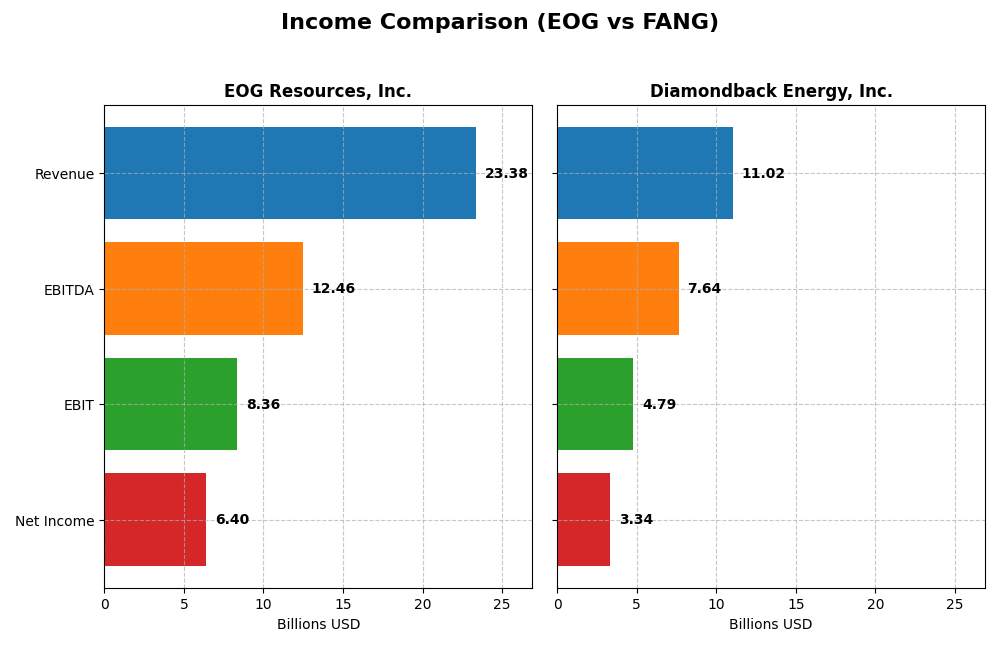
The following table compares key income statement metrics for EOG Resources, Inc. and Diamondback Energy, Inc. for the fiscal year 2024, providing a snapshot of their financial performance.
| Metric | EOG Resources, Inc. | Diamondback Energy, Inc. |
|---|---|---|
| Market Cap | 57.5B | 42.9B |
| Revenue | 23.4B | 11.0B |
| EBITDA | 12.5B | 7.6B |
| EBIT | 8.4B | 4.8B |
| Net Income | 6.4B | 3.3B |
| EPS | 11.31 | 15.53 |
| Fiscal Year | 2024 | 2024 |
Income Statement Interpretations
EOG Resources, Inc.
EOG Resources showed strong revenue growth of 137% overall from 2020 to 2024, with net income surging over 1158% in the same period. Margins remained robust, boasting a gross margin of 75.7% and net margin near 27.4%. However, the latest year saw a slight slowdown with revenue up only 0.85%, and net margin declining by 16.4%, indicating margin compression despite solid profitability.
Diamondback Energy, Inc.
Diamondback Energy experienced a significant revenue increase of 292% over five years, with net income rising 174%. The company maintains favorable margins, including a 45.1% gross margin and a 30.3% net margin. In 2024, revenue grew 32.2%, EBIT increased by 8.3%, though net margin contracted by 19.7%. Operational expenses grew alongside revenue, tempering margin expansion.
Which one has the stronger fundamentals?
Both companies report favorable overall income statement trends with strong revenue and net income growth. EOG Resources has higher profit margins but showed recent margin deterioration and slower revenue growth. Diamondback Energy displays faster recent revenue growth and higher EBIT margin but weaker net margin progression. The fundamentals reflect distinct strengths, with EOG excelling in margin stability and Diamondback in growth momentum.
Financial Ratios Comparison
The table below compares key financial ratios for EOG Resources, Inc. and Diamondback Energy, Inc. based on their most recent fiscal year data, allowing investors to evaluate their operational and financial efficiency.
| Ratios | EOG Resources, Inc. (EOG) | Diamondback Energy, Inc. (FANG) |
|---|---|---|
| ROE | 21.8% | 8.8% |
| ROIC | 14.8% | 5.8% |
| P/E | 10.8 | 10.5 |
| P/B | 2.36 | 0.93 |
| Current Ratio | 2.10 | 0.44 |
| Quick Ratio | 1.91 | 0.41 |
| D/E (Debt-to-Equity) | 0.17 | 0.33 |
| Debt-to-Assets | 10.7% | 18.5% |
| Interest Coverage | 58.6 | 15.1 |
| Asset Turnover | 0.50 | 0.16 |
| Fixed Asset Turnover | 0.68 | 0.17 |
| Payout Ratio | 32.6% | 47.3% |
| Dividend Yield | 3.0% | 4.5% |
Interpretation of the Ratios
EOG Resources, Inc.
EOG shows strong financial health with 79% of its key ratios favorable, including high net margin (27.39%) and return on equity (21.82%). The company displays solid liquidity and low debt levels, though asset turnover ratios are weak. Dividend yield is 3.01%, supported by stable free cash flow, indicating a sustainable payout and reasonable shareholder returns.
Diamondback Energy, Inc.
Diamondback presents a mixed picture with 57% favorable ratios, strong net margin (30.28%) but weak return on equity (8.85%) and low liquidity ratios, reflecting potential short-term financial stress. The dividend yield is higher at 4.51%, but negative free cash flow raises concerns about the sustainability of distributions and shareholder returns in the near term.
Which one has the best ratios?
EOG Resources exhibits a more balanced and robust financial profile with predominantly favorable ratios, especially in profitability and liquidity, supporting consistent dividend payouts. Diamondback, despite some favorable profitability metrics and a higher dividend yield, faces notable weaknesses in liquidity and returns, making its overall ratio evaluation less strong than EOG’s.
Strategic Positioning
This section compares the strategic positioning of EOG Resources, Inc. and Diamondback Energy, Inc., including their market position, key segments, and exposure to technological disruption:
EOG Resources, Inc.
- Large market cap of 57B with moderate beta, strong NYSE presence; faces typical industry competition.
- Diversified revenues across oil, natural gas liquids, and natural gas segments with integrated marketing.
- Limited explicit exposure to technological disruption mentioned; operates conventional and unconventional reserves.
Diamondback Energy, Inc.
- Market cap of 43B, slightly higher beta, listed on NASDAQ; competes in Permian-focused niche.
- Concentrated upstream focus on Permian Basin with midstream assets and royalty interests.
- Focus on unconventional oil and natural gas reserves, with midstream infrastructure integration.
EOG Resources, Inc. vs Diamondback Energy, Inc. Positioning
EOG shows a diversified approach across multiple energy segments and geographies, while Diamondback concentrates on Permian unconventional resources and midstream operations. EOG’s broader portfolio offers varied revenue streams, whereas Diamondback’s specialization may limit exposure but enhances operational focus.
Which has the best competitive advantage?
EOG demonstrates a very favorable moat with strong value creation and growing ROIC, indicating durable competitive advantage. Diamondback’s moat is only slightly favorable with value shedding but improving profitability, reflecting a less established competitive edge.
Stock Comparison
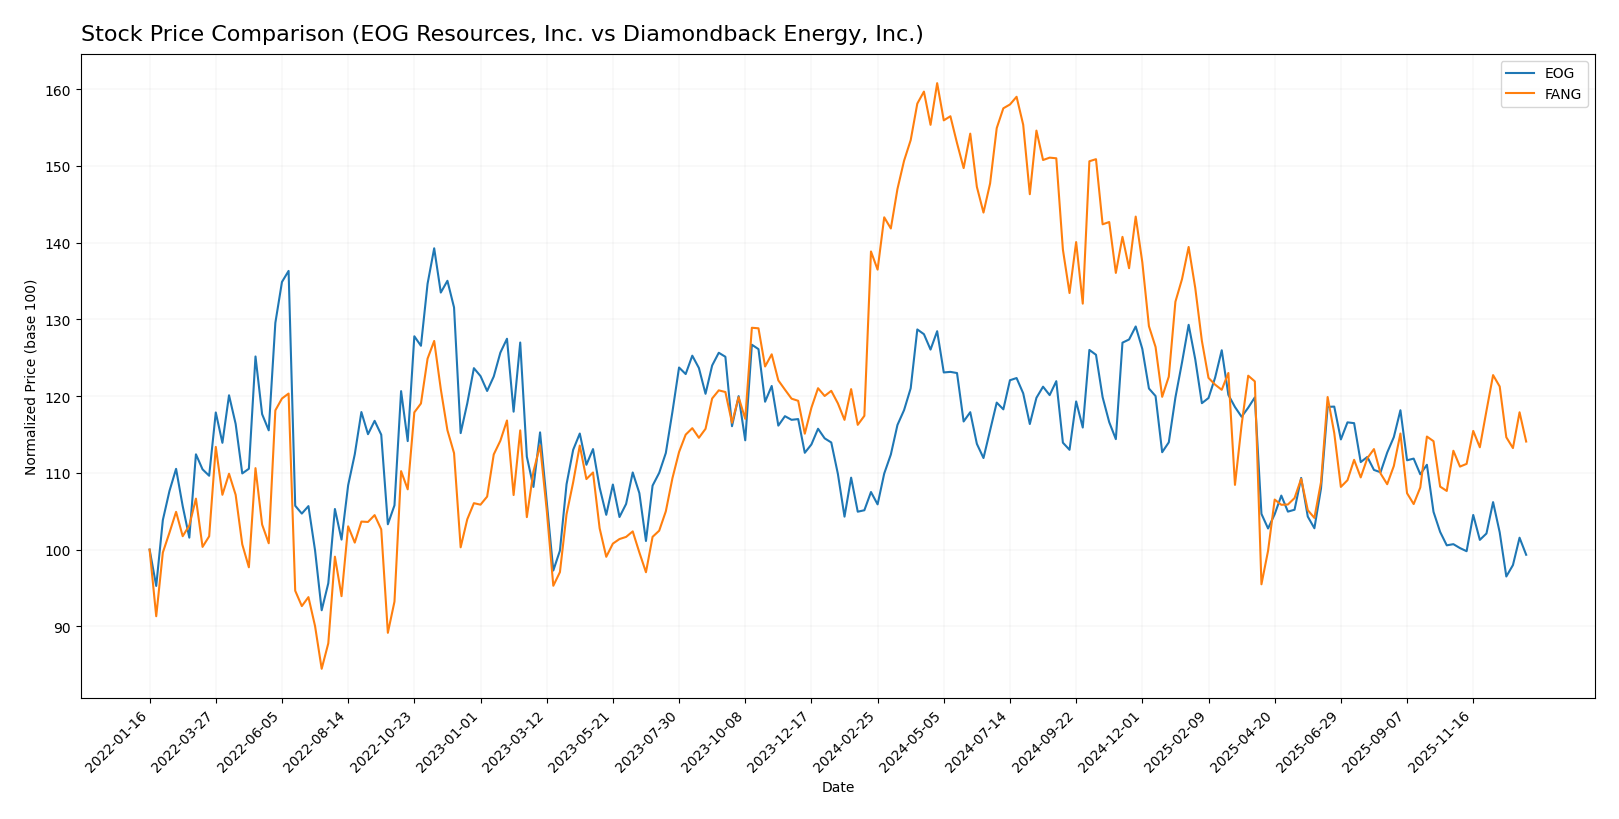
The stock prices of EOG Resources, Inc. and Diamondback Energy, Inc. have both experienced notable shifts over the past year, with distinct bearish trends and varying degrees of volatility shaping their trading dynamics.
Trend Analysis
EOG Resources, Inc. shows a bearish trend over the past 12 months with a price decrease of 7.61%, accompanied by accelerating decline and moderate volatility at 8.9 standard deviation. Its price ranged from a high of 136.58 to a low of 101.93.
Diamondback Energy, Inc. also exhibits a bearish trend with a more pronounced 17.84% decline over the last year, accelerating downward with higher volatility at 23.76 standard deviation and price fluctuations between 207.76 and 123.37.
Comparing both stocks, EOG Resources, Inc. has delivered the higher market performance as its price decline is less severe than Diamondback Energy, Inc. over the same period.
Target Prices
Analysts present a positive outlook with clear target price ranges for both EOG Resources, Inc. and Diamondback Energy, Inc.
| Company | Target High | Target Low | Consensus |
|---|---|---|---|
| EOG Resources, Inc. | 170 | 124 | 139.45 |
| Diamondback Energy, Inc. | 219 | 162 | 185.36 |
The consensus target prices for EOG and Diamondback Energy are significantly above their current stock prices of $104.92 and $147.41, respectively, indicating that analysts expect meaningful upside potential for both stocks.
Analyst Opinions Comparison
This section compares analysts’ ratings and grades for EOG Resources, Inc. and Diamondback Energy, Inc.:
Rating Comparison
EOG Rating
- Rating: A-, described as Very Favorable overall company financial standing.
- Discounted Cash Flow Score: 5, indicating a Very Favorable valuation metric.
- ROE Score: 5, signaling very efficient profit generation from equity.
- ROA Score: 5, showing very effective asset utilization to generate earnings.
- Debt To Equity Score: 2, a moderate risk level due to debt relative to equity.
- Overall Score: 4, representing a favorable financial health assessment.
FANG Rating
- Rating: A-, described as Very Favorable overall company financial standing.
- Discounted Cash Flow Score: 5, indicating a Very Favorable valuation metric.
- ROE Score: 4, indicating favorable but lower efficiency than EOG.
- ROA Score: 4, showing favorable but less effective asset use than EOG.
- Debt To Equity Score: 2, also moderate financial risk from debt exposure.
- Overall Score: 4, representing a favorable financial health assessment.
Which one is the best rated?
Both EOG and FANG share the same overall rating of A- and overall score of 4, showing favorable assessments. EOG scores higher in ROE and ROA, suggesting stronger profitability and asset use, while debt risk is equal for both.
Scores Comparison
The comparison of the Altman Z-Score and Piotroski Score for EOG Resources and Diamondback Energy is as follows:
EOG Scores
- Altman Z-Score: 3.34, indicating a safe zone with low bankruptcy risk.
- Piotroski Score: 5, reflecting average financial strength.
FANG Scores
- Altman Z-Score: 1.33, indicating distress zone and higher bankruptcy risk.
- Piotroski Score: 5, reflecting average financial strength.
Which company has the best scores?
EOG Resources shows a safer financial position with a higher Altman Z-Score in the safe zone, while both companies share the same average Piotroski Score. Diamondback Energy’s distress zone Altman Z-Score indicates more financial risk.
Grades Comparison
Here is a detailed comparison of the latest grades assigned to EOG Resources, Inc. and Diamondback Energy, Inc.:
EOG Resources, Inc. Grades
The table below shows the most recent grades issued by reputable financial institutions for EOG Resources, Inc.:
| Grading Company | Action | New Grade | Date |
|---|---|---|---|
| Bernstein | Maintain | Market Perform | 2026-01-05 |
| Citigroup | Maintain | Neutral | 2025-12-17 |
| Mizuho | Maintain | Neutral | 2025-12-12 |
| UBS | Maintain | Buy | 2025-12-12 |
| Piper Sandler | Maintain | Neutral | 2025-11-18 |
| Wells Fargo | Maintain | Overweight | 2025-11-11 |
| Piper Sandler | Maintain | Neutral | 2025-10-21 |
| Susquehanna | Maintain | Positive | 2025-10-20 |
| Wells Fargo | Maintain | Overweight | 2025-10-17 |
| Morgan Stanley | Maintain | Equal Weight | 2025-10-14 |
EOG’s grades mostly reflect a stable outlook with a mix of Neutral, Overweight, and Buy ratings, indicating moderate confidence from analysts.
Diamondback Energy, Inc. Grades
Presented here are the recent grades from established grading firms for Diamondback Energy, Inc.:
| Grading Company | Action | New Grade | Date |
|---|---|---|---|
| Wells Fargo | Maintain | Overweight | 2024-10-18 |
| Susquehanna | Maintain | Positive | 2024-10-18 |
| Keybanc | Maintain | Overweight | 2024-10-16 |
| Truist Securities | Maintain | Buy | 2024-10-16 |
| Piper Sandler | Maintain | Overweight | 2024-10-15 |
| Scotiabank | Maintain | Sector Outperform | 2024-10-10 |
| BMO Capital | Upgrade | Outperform | 2024-10-04 |
| Benchmark | Maintain | Buy | 2024-10-03 |
| Barclays | Upgrade | Overweight | 2024-10-02 |
| Wells Fargo | Maintain | Overweight | 2024-10-01 |
Diamondback Energy shows a predominantly positive consensus, with multiple Overweight and Buy ratings, including recent upgrades, suggesting growing analyst confidence.
Which company has the best grades?
Diamondback Energy, Inc. has received stronger and more consistent positive grades compared to EOG Resources, Inc., with several recent upgrades to Outperform and Overweight. This pattern may signal a more favorable perception among analysts, potentially impacting investor sentiment and portfolio weighting decisions.
Strengths and Weaknesses
Below is a summary table highlighting the key strengths and weaknesses of EOG Resources, Inc. (EOG) and Diamondback Energy, Inc. (FANG) based on their recent financial performance, market positions, and competitive advantages.
| Criterion | EOG Resources, Inc. (EOG) | Diamondback Energy, Inc. (FANG) |
|---|---|---|
| Diversification | Highly diversified product mix: Oil & Condensate (13.9B), Natural Gas (1.55B), Gathering & Marketing (5.8B) | Primarily upstream services (8.34B) with some midstream segment (440M); less diversified |
| Profitability | Strong profitability: Net margin 27.4%, ROE 21.8%, ROIC 14.8% (very favorable) | Good net margin 30.3%, but lower ROE 8.9% and neutral ROIC 5.75% |
| Innovation | Demonstrates durable competitive advantage with growing ROIC (+1207%) | Growing ROIC (+122%), but still shedding value; competitive edge less clear |
| Global presence | Significant US and Trinidad markets; strong infrastructure in natural gas and oil | Mainly focused on US upstream and midstream services; limited geographic diversification |
| Market Share | Large market share in oil and natural gas production with efficient capital use | Smaller scale with less capital efficiency, reflected in weaker asset turnover ratios |
Key takeaways: EOG Resources shows a very favorable competitive moat supported by diversified revenue streams and strong profitability metrics. Diamondback Energy has improving profitability but remains less diversified and with a less robust economic moat, suggesting higher risk and cautious investment consideration.
Risk Analysis
Below is a comparative overview of the key risks facing EOG Resources, Inc. and Diamondback Energy, Inc. as of 2026:
| Metric | EOG Resources, Inc. | Diamondback Energy, Inc. |
|---|---|---|
| Market Risk | Moderate (Beta 0.50) | Moderate (Beta 0.58) |
| Debt level | Low (D/E 0.17, favorable) | Moderate (D/E 0.33, favorable) |
| Regulatory Risk | Moderate – energy sector scrutiny | Moderate – Permian Basin focused |
| Operational Risk | Moderate – asset turnover issues | Higher – lower asset efficiency |
| Environmental Risk | Elevated – fossil fuel exposure | Elevated – oil & gas operations |
| Geopolitical Risk | Low – US and Trinidad & Tobago | Low – US focused |
EOG shows a safer financial profile with low debt and strong coverage ratios, but has moderate operational risks due to asset turnover inefficiencies. Diamondback faces higher operational and liquidity risks alongside a concerning Altman Z-Score placing it in the distress zone, raising bankruptcy risk concerns despite solid dividend yields. Environmental and regulatory risks remain significant for both given the energy sector’s transition pressures.
Which Stock to Choose?
EOG Resources, Inc. shows a favorable income evolution with strong profitability metrics despite recent slight declines in revenue and net margin growth. Its financial ratios are very favorable overall, supported by low debt levels, a high current ratio, and a robust rating of A- indicating solid financial health.
Diamondback Energy, Inc. exhibits favorable income growth over the longer term, with recent mixed signals including strong revenue growth but some margin contractions. Its financial ratios are generally favorable but with notable weaknesses in liquidity and higher debt. The company holds an A- rating as well, reflecting stable but less resilient financials compared to EOG.
Considering ratings and comprehensive evaluations, EOG might appear more suitable for investors prioritizing financial stability and quality, given its very favorable ratio profile and durable competitive advantage. Meanwhile, FANG could be more appealing for investors with a higher risk tolerance focused on growth potential despite liquidity concerns.
Disclaimer: Investment carries a risk of loss of initial capital. The past performance is not a reliable indicator of future results. Be sure to understand risks before making an investment decision.
Go Further
I encourage you to read the complete analyses of EOG Resources, Inc. and Diamondback Energy, Inc. to enhance your investment decisions: