Home > Comparison > Healthcare > DXCM vs ZBH
The strategic rivalry between DexCom, Inc. and Zimmer Biomet Holdings, Inc. shapes the healthcare devices sector’s future. DexCom operates as a high-growth innovator specializing in continuous glucose monitoring systems, while Zimmer Biomet commands a diversified portfolio in orthopedic reconstructive products. This head-to-head contrasts breakthrough digital health technology with established musculoskeletal solutions. This analysis aims to identify which company’s trajectory offers the superior risk-adjusted return for a diversified healthcare portfolio.
Table of contents
Companies Overview
DexCom and Zimmer Biomet stand as pivotal players in the medical devices sector, shaping healthcare innovation globally.
DexCom, Inc.: Leader in Continuous Glucose Monitoring
DexCom dominates the continuous glucose monitoring market, generating revenue through advanced CGM systems for diabetes care. Its flagship products, including Dexcom G6 and G7, focus on real-time glucose data integration and patient convenience. In 2026, DexCom emphasizes expanding its digital health ecosystem and enhancing interoperability with third-party developers.
Zimmer Biomet Holdings, Inc.: Orthopedic Device Powerhouse
Zimmer Biomet excels in the musculoskeletal healthcare market by designing and marketing orthopaedic reconstructive and surgical products. It serves a broad clientele from surgeons to hospitals globally. In 2026, the company prioritizes innovation in surgical robotics and expanding its footprint in emerging markets to solidify its leadership in orthopedic solutions.
Strategic Collision: Similarities & Divergences
Both companies lead in medical devices but adopt contrasting philosophies: DexCom champions a connected, data-driven ecosystem, while Zimmer Biomet relies on a diversified portfolio of physical implants and instruments. Their primary competition lies in capturing healthcare providers’ trust and integrating technology in patient care. DexCom’s digital growth contrasts with Zimmer Biomet’s traditional surgical innovation, creating distinct investment profiles based on tech adoption versus established market presence.
Income Statement Comparison
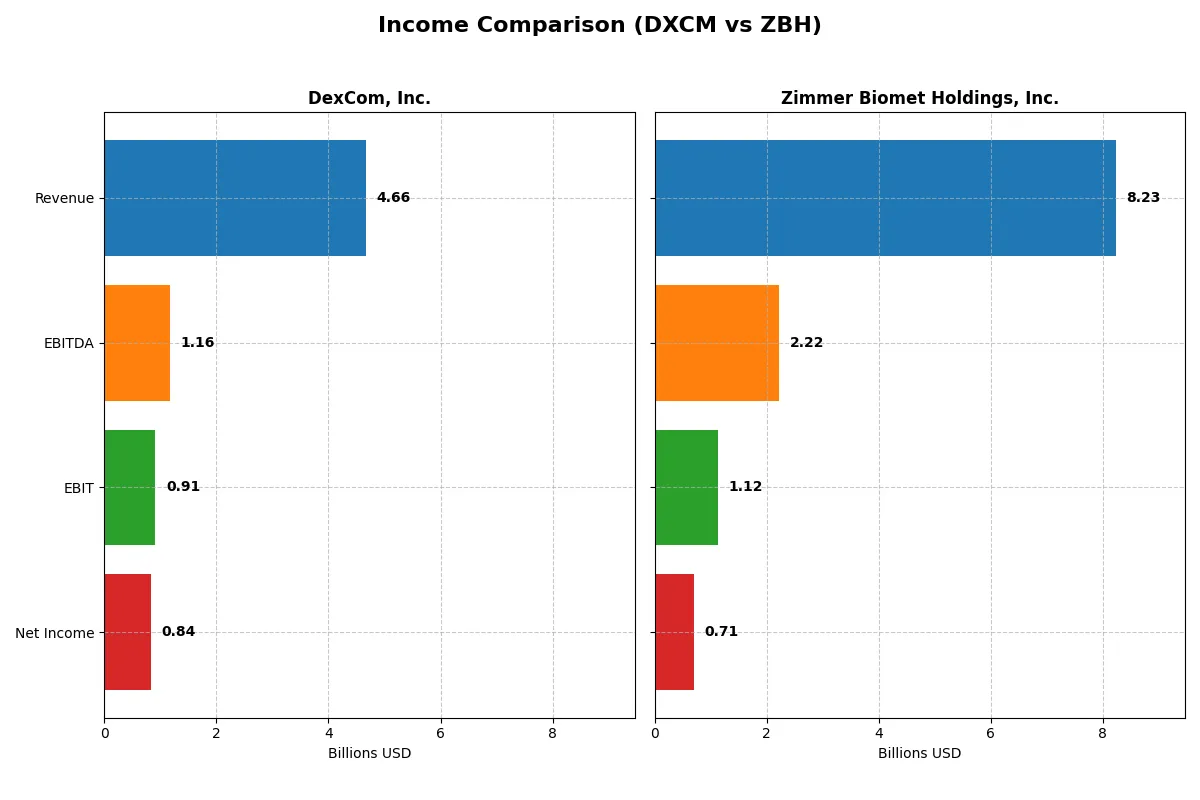
This data dissects the core profitability and scalability of both corporate engines to reveal who dominates the bottom line:
| Metric | DexCom, Inc. (DXCM) | Zimmer Biomet Holdings, Inc. (ZBH) |
|---|---|---|
| Revenue | 4.66B | 8.23B |
| Cost of Revenue | 1.86B | 3.16B |
| Operating Expenses | 1.89B | 3.71B |
| Gross Profit | 2.80B | 5.07B |
| EBITDA | 1.16B | 2.22B |
| EBIT | 912M | 1.12B |
| Interest Expense | 0 | 293M |
| Net Income | 836M | 705M |
| EPS | 2.14 | 3.56 |
| Fiscal Year | 2025 | 2025 |
Income Statement Analysis: The Bottom-Line Duel
The following income statement comparison reveals which company runs a more efficient and profitable business engine amid evolving market conditions.
DexCom, Inc. Analysis
DexCom’s revenue surged from 2.45B in 2021 to 4.66B in 2025, with net income soaring from 228M to 836M. Its gross margin holds firm at 60.1%, while the net margin expanded to nearly 18%. The 2025 figures show strong momentum and improved profitability, driven by disciplined cost control and rising operational efficiency.
Zimmer Biomet Holdings, Inc. Analysis
Zimmer Biomet achieved revenue growth from 6.83B in 2021 to 8.23B in 2025, but net income rose more modestly from 402M to 705M. The gross margin remains slightly higher than DexCom’s at 61.6%, yet the net margin lags at 8.6%. Recent years show mixed signals with declining EBIT and net margin growth, indicating some margin pressure despite top-line gains.
Margin Discipline vs. Revenue Growth Scale
DexCom outperforms Zimmer Biomet in net margin expansion and earnings growth, posting a 25% EBIT increase in 2025 versus Zimmer’s 10% EBIT decline. While Zimmer commands larger revenue, DexCom’s superior margin trajectory signals a more efficient profit engine. Investors seeking robust earnings momentum may find DexCom’s profile more compelling.
Financial Ratios Comparison
These vital ratios act as a diagnostic tool to expose the underlying fiscal health, valuation premiums, and capital efficiency of the companies compared:
| Ratios | DexCom, Inc. (DXCM) | Zimmer Biomet Holdings, Inc. (ZBH) |
|---|---|---|
| ROE | 30.5% | 5.6% |
| ROIC | 16.6% | 5.5% |
| P/E | 31.0 | 25.2 |
| P/B | 9.4 | 1.4 |
| Current Ratio | 1.88 | 1.98 |
| Quick Ratio | 1.59 | 1.10 |
| D/E (Debt/Equity) | 0.51 | 0.59 |
| Debt-to-Assets | 22.2% | 32.6% |
| Interest Coverage | 0 | 4.65 |
| Asset Turnover | 0.74 | 0.36 |
| Fixed Asset Turnover | 2.85 | 3.73 |
| Payout Ratio | 0% | 27.0% |
| Dividend Yield | 0% | 1.07% |
| Fiscal Year | 2025 | 2025 |
Efficiency & Valuation Duel: The Vital Signs
Financial ratios act as a company’s DNA, revealing hidden risks and operational excellence behind headline figures.
DexCom, Inc.
DexCom delivers strong profitability with a 30.5% ROE and healthy 17.9% net margin, signaling operational efficiency. However, its valuation appears stretched, with a P/E near 31 and P/B at 9.4. It returns no dividend, instead reinvesting heavily in R&D, fueling growth in a competitive sector.
Zimmer Biomet Holdings, Inc.
Zimmer Biomet posts modest profitability, with a 5.5% ROE and 8.6% net margin, reflecting more conservative operations. Its valuation is less stretched, with a P/E of 25.3 and a solid P/B of 1.4. The company pays a 1.07% dividend, offering some income along with steady capital allocation.
Growth Premium vs. Income Stability
DexCom’s efficiency and growth come at a premium valuation, exposing investors to higher risk but potential upside. Zimmer Biomet provides a more balanced risk profile with income and reasonable valuation, suiting cautious investors. The choice hinges on appetite for growth versus steady returns.
Which one offers the Superior Shareholder Reward?
I see DexCom (DXCM) opts for zero dividends but reinvests heavily in growth, with free cash flow per share at 2.76 and no payout ratio. Zimmer Biomet (ZBH) pays a modest 1.07% dividend yield with a 27% payout ratio, supported by strong free cash flow of 7.44 per share. Zimmer’s buyback program is less visible but its dividend plus stable capital returns suggest a balanced distribution model. DexCom’s lack of buybacks and dividends raises sustainability concerns, despite growth potential. Zimmer Biomet offers a more attractive, sustainable total return profile in 2026.
Comparative Score Analysis: The Strategic Profile
The radar chart reveals the fundamental DNA and trade-offs of DexCom, Inc. and Zimmer Biomet Holdings, Inc., highlighting their financial strengths and valuation challenges:
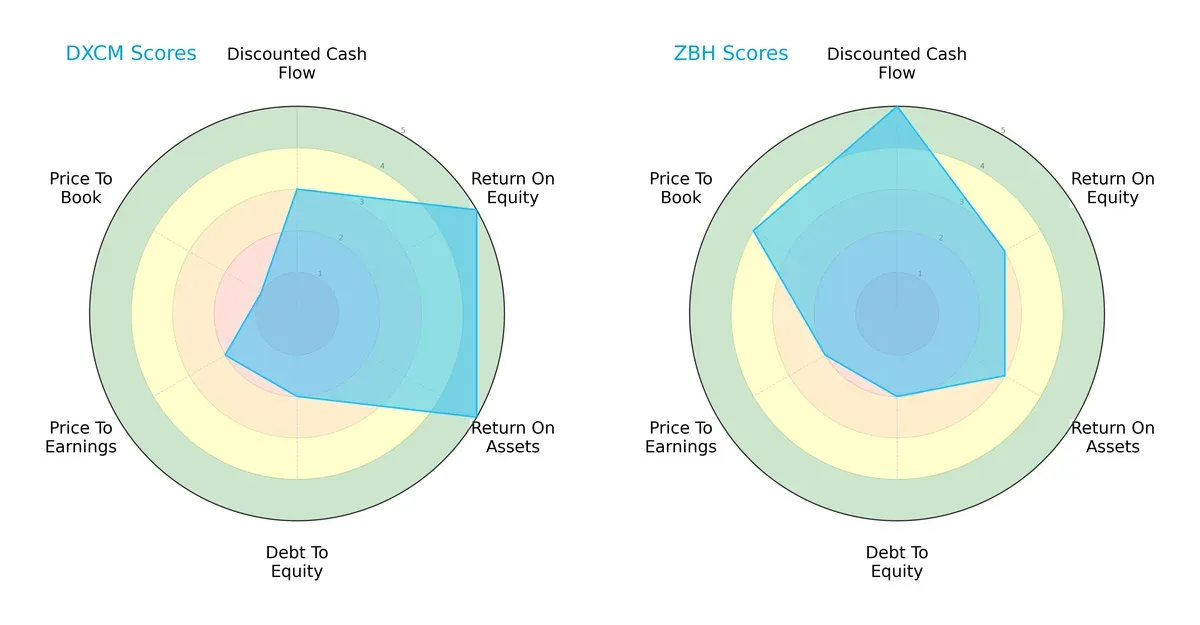
DexCom leads with superior operational efficiency, scoring 5 in ROE and ROA, indicating strong profit generation and asset utilization. Zimmer Biomet excels in discounted cash flow (DCF) with a top score of 5, signaling robust future cash flow expectations. Both firms share moderate overall scores (3) and face similar debt-to-equity challenges (score 2). However, DexCom’s valuation metrics lag significantly, particularly in price-to-book (score 1), while Zimmer Biomet offers a more favorable price-to-book score (4), suggesting better market pricing discipline. Zimmer Biomet presents a more balanced profile, while DexCom relies heavily on operational excellence despite valuation concerns.
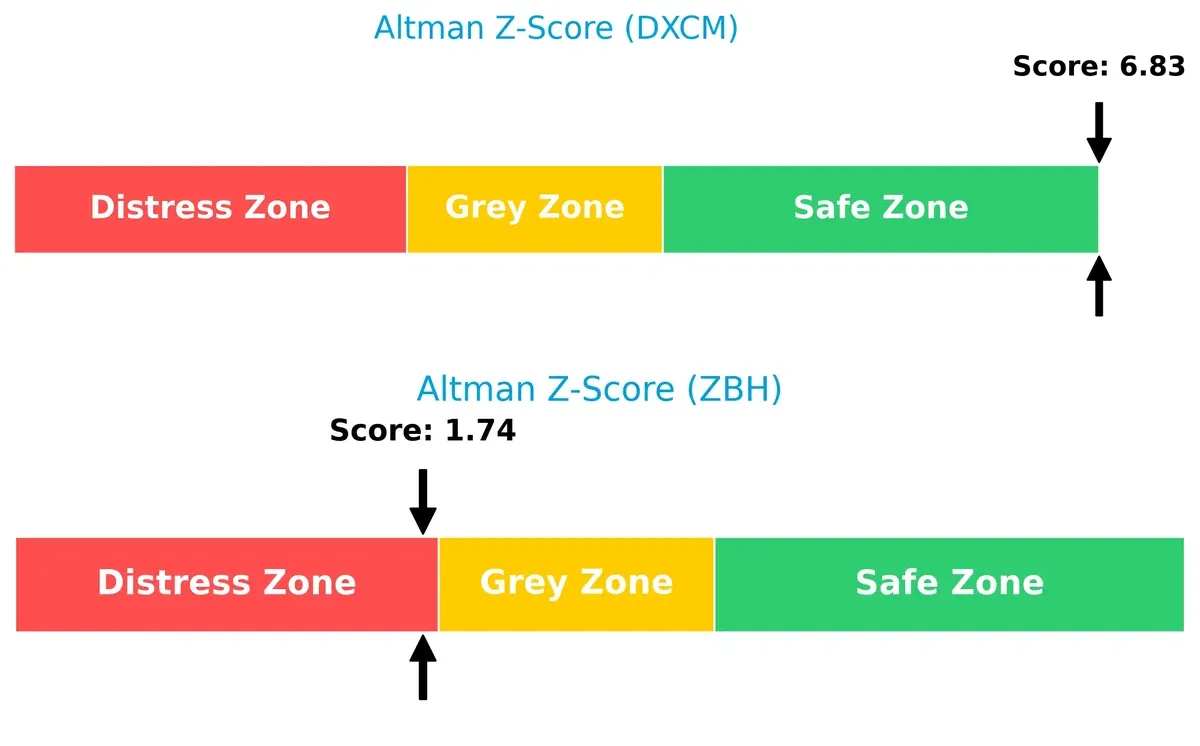
Bankruptcy Risk: Solvency Showdown
DexCom’s Altman Z-Score of 6.83 places it firmly in the safe zone, signaling strong financial stability and low bankruptcy risk. Zimmer Biomet’s score of 1.74 falls in the distress zone, indicating elevated long-term survival risks in this market cycle:
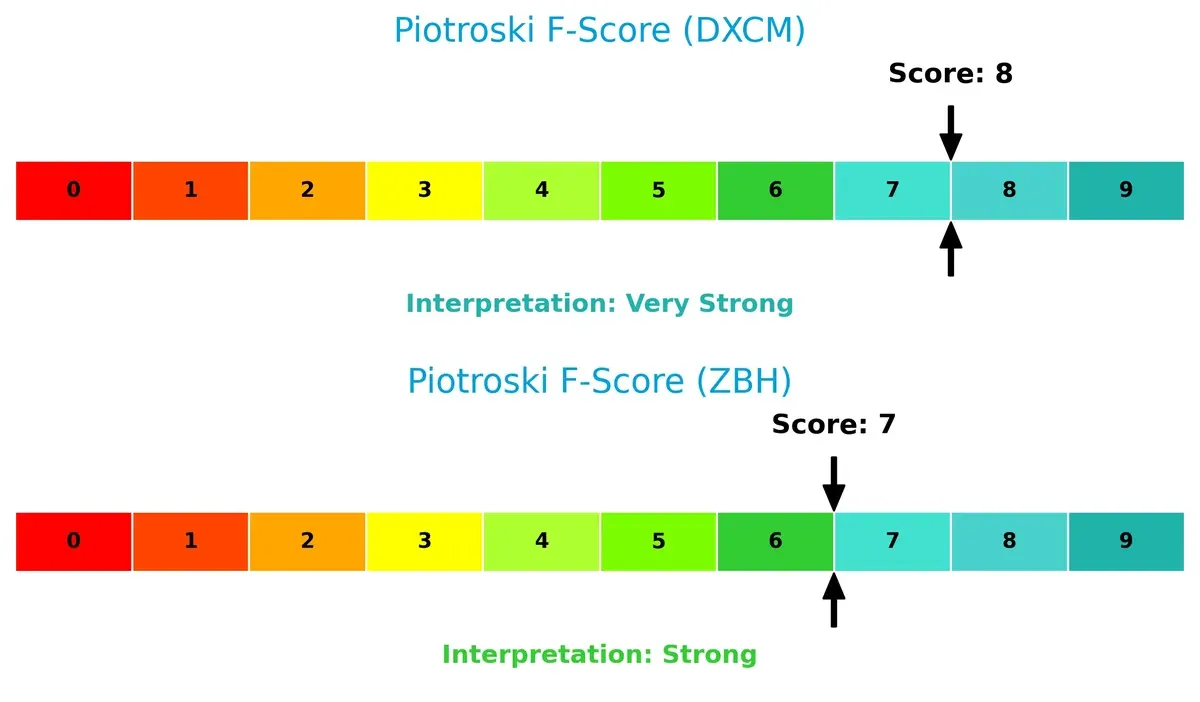
Financial Health: Quality of Operations
DexCom’s Piotroski F-Score of 8 denotes very strong internal financial health, reflecting robust profitability and efficient capital management. Zimmer Biomet’s score of 7 also indicates strength but reveals slightly weaker operational metrics compared to DexCom:
How are the two companies positioned?
This section dissects the operational DNA of DexCom and Zimmer Biomet by comparing their revenue distribution and internal strengths and weaknesses. The goal is to confront their economic moats and identify which model offers the most resilient, sustainable competitive advantage today.
Revenue Segmentation: The Strategic Mix
This visual comparison dissects how DexCom, Inc. and Zimmer Biomet Holdings, Inc. diversify their income streams and where their primary sector bets lie:
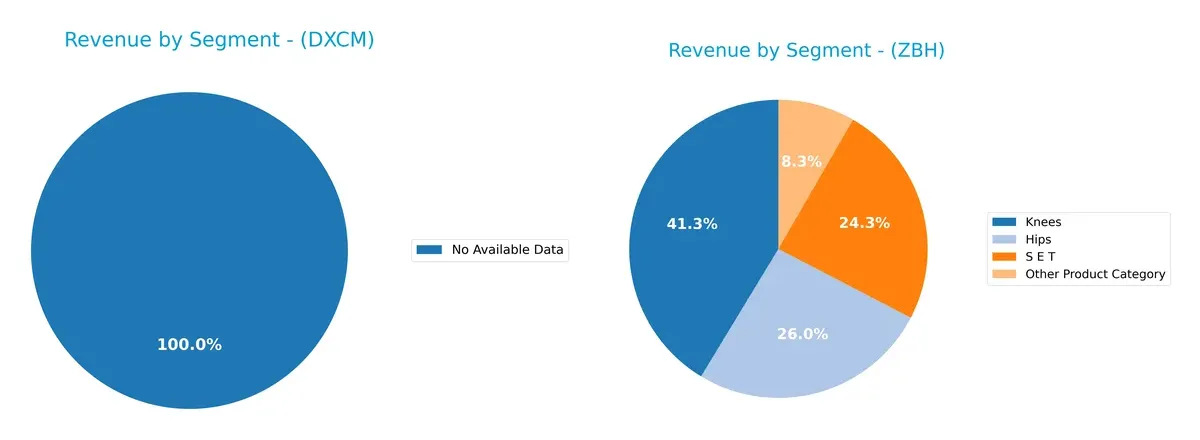
DexCom lacks available segment data, limiting direct comparison. Zimmer Biomet diversifies revenue across Knees ($3.17B), Hips ($2B), S E T ($1.87B), and Other Products ($640M) in 2024. Zimmer’s balanced portfolio reduces dependence on any single category, anchoring its market position in orthopedic implants. This mix mitigates concentration risk and leverages infrastructure dominance, unlike a single-segment reliance that can amplify volatility.
Strengths and Weaknesses Comparison
This table compares the Strengths and Weaknesses of DexCom, Inc. and Zimmer Biomet Holdings, Inc.:
DexCom Strengths
- Higher profitability with net margin at 17.94%
- Strong ROE of 30.46% indicates efficient equity use
- Favorable current and quick ratios show liquidity strength
- Lower debt to assets ratio at 22.23%
- Broad US and growing Non-US revenue base
Zimmer Biomet Strengths
- Diversified product portfolio across hips, knees, and other categories
- Solid global presence with balanced Americas, Asia Pacific, and EMEA revenues
- Favorable WACC at 5.54% lowers capital costs
- Attractive PB ratio at 1.4 indicates market undervaluation
- Favorable fixed asset turnover at 3.73
DexCom Weaknesses
- Elevated WACC at 10.27% increases capital expense
- High PE of 30.97 suggests premium valuation risk
- High PB ratio of 9.43 may indicate overvaluation
- Zero dividend yield limits income appeal
- Neutral asset turnover at 0.74 suggests moderate efficiency
Zimmer Biomet Weaknesses
- Lower profitability with net margin at 8.57%
- ROE at 5.55% signals weak equity returns
- Unfavorable asset turnover at 0.36 reduces operational efficiency
- Moderate interest coverage at 3.84x implies less buffer for debt costs
- Neutral debt to assets ratio at 32.56%
DexCom’s strengths lie in operational profitability and liquidity, though high valuation metrics pose risk. Zimmer Biomet shows robust diversification and capital efficiency, offset by weaker profitability and asset utilization. These contrasts highlight differing strategic focuses in growth and financial structure.
The Moat Duel: Analyzing Competitive Defensibility
A structural moat is the only shield protecting long-term profits from relentless competition erosion. Let’s dissect the competitive moats of DexCom and Zimmer Biomet:
DexCom, Inc.: Innovation-Driven Switching Costs
DexCom’s moat centers on high switching costs, driven by its integrated continuous glucose monitoring systems. This manifests in a robust 19.56% EBIT margin and a soaring 6.3% ROIC premium above WACC. The launch of DexCom G7 and API integrations promise deeper entrenchment in diabetes care by 2026.
Zimmer Biomet Holdings, Inc.: Scale and Product Diversification
Zimmer Biomet’s moat relies on broad product diversification and global scale, contrasting DexCom’s niche focus. However, its slightly negative ROIC spread signals value destruction despite growing profitability. Expansion into robotic surgery and biologics could bolster its moat if execution improves.
Innovation Lock-in vs. Scale Complexity: Who Holds the Stronger Moat?
DexCom’s innovation-driven switching costs create a deeper, more sustainable moat than Zimmer Biomet’s sprawling but less efficient scale. DexCom is better positioned to defend market share through technology leadership and margin expansion.
Which stock offers better returns?
Over the past year, both DexCom, Inc. and Zimmer Biomet Holdings, Inc. experienced significant price declines with differing acceleration patterns and recent trading dynamics.
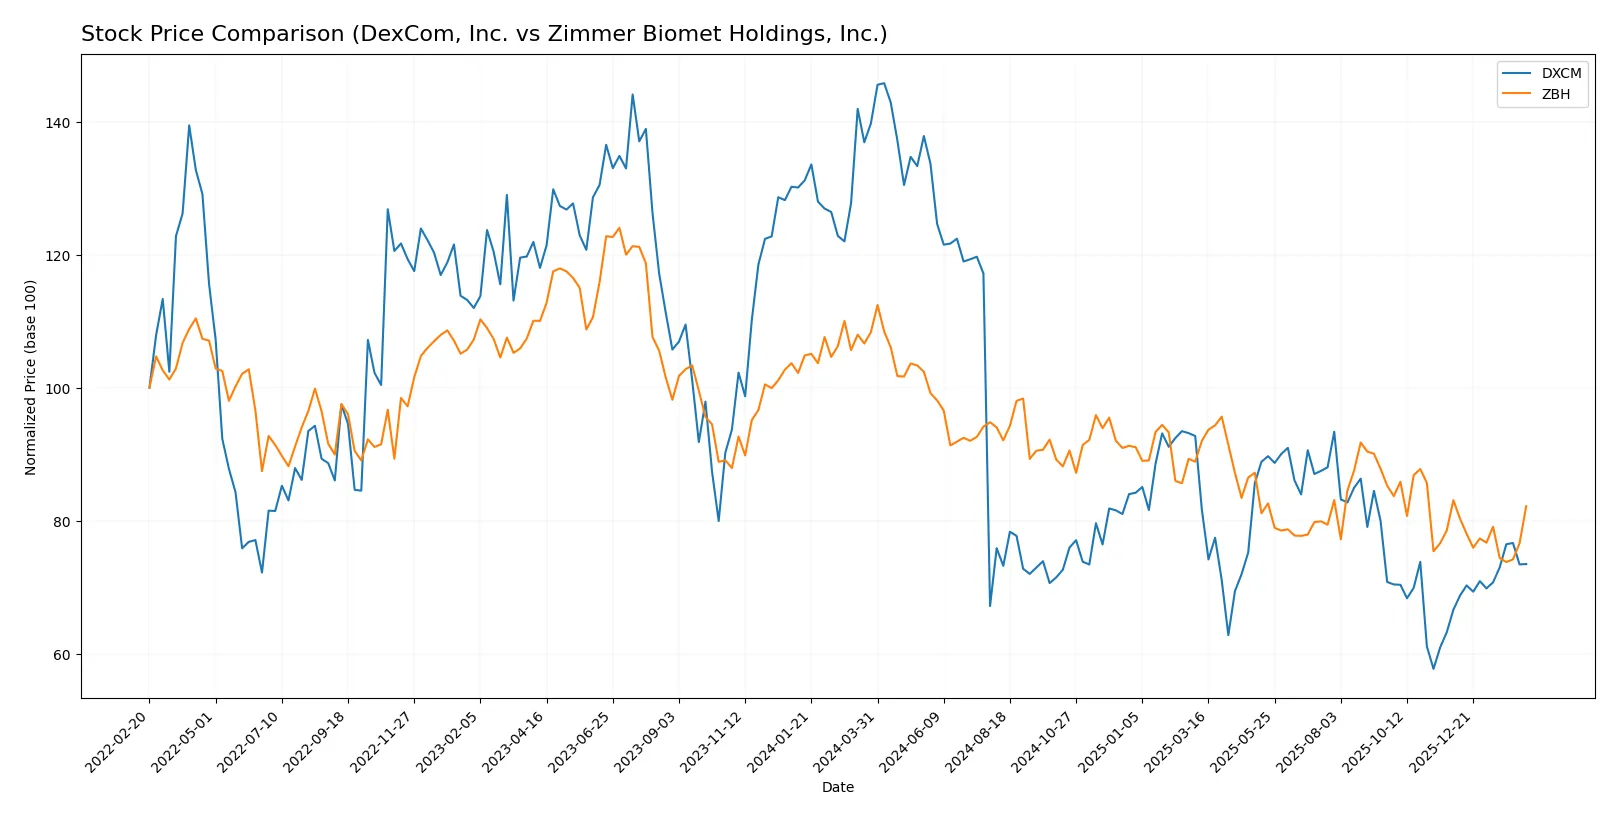
Trend Comparison
DexCom’s stock fell 47.42% over the past 12 months, showing a bearish trend with accelerating decline and high volatility. It rebounded 10.32% recently, indicating a short-term bullish correction.
Zimmer Biomet’s stock dropped 24.17% in the last year, marking a bearish trend with decelerating loss and moderate volatility. Its recent change was a slight 1.1% decline, reflecting a near-neutral short-term trend.
DexCom’s decline is markedly steeper than Zimmer Biomet’s, though its recent rebound contrasts with Zimmer’s ongoing slight weakness. DexCom delivered the lowest market performance overall.
Target Prices
Analysts show a constructive outlook for DexCom and Zimmer Biomet with solid upside potential.
| Company | Target Low | Target High | Consensus |
|---|---|---|---|
| DexCom, Inc. | 72 | 95 | 85.82 |
| Zimmer Biomet Holdings, Inc. | 89 | 130 | 107.82 |
The consensus targets imply 23% upside for DexCom from $70 and 12% upside for Zimmer Biomet from $96. Both stocks reflect positive analyst sentiment relative to current prices.

Don’t Let Luck Decide Your Entry Point
Optimize your entry points with our advanced ProRealTime indicators. You’ll get efficient buy signals with precise price targets for maximum performance. Start outperforming now!
How do institutions grade them?
DexCom, Inc. Grades
The following table lists recent grades from reputable institutions for DexCom, Inc.:
| Grading Company | Action | New Grade | Date |
|---|---|---|---|
| Mizuho | Maintain | Outperform | 2026-02-13 |
| BTIG | Maintain | Buy | 2026-02-13 |
| Canaccord Genuity | Maintain | Buy | 2026-02-13 |
| Barclays | Maintain | Underweight | 2026-02-13 |
| Wells Fargo | Maintain | Overweight | 2026-02-13 |
| Barclays | Downgrade | Underweight | 2026-01-12 |
| Bernstein | Maintain | Outperform | 2026-01-09 |
| Mizuho | Maintain | Outperform | 2025-12-17 |
| Citigroup | Maintain | Buy | 2025-12-11 |
| Morgan Stanley | Upgrade | Overweight | 2025-12-02 |
Zimmer Biomet Holdings, Inc. Grades
Below are recent grades from credible firms for Zimmer Biomet Holdings, Inc.:
| Grading Company | Action | New Grade | Date |
|---|---|---|---|
| Barclays | Maintain | Underweight | 2026-02-12 |
| Citigroup | Maintain | Neutral | 2026-02-11 |
| Wells Fargo | Maintain | Equal Weight | 2026-02-11 |
| BTIG | Maintain | Buy | 2026-02-10 |
| Needham | Maintain | Hold | 2026-02-10 |
| UBS | Maintain | Sell | 2026-01-28 |
| Bernstein | Maintain | Market Perform | 2026-01-09 |
| BTIG | Maintain | Buy | 2026-01-08 |
| Evercore ISI Group | Upgrade | Outperform | 2026-01-05 |
| Baird | Downgrade | Neutral | 2025-12-16 |
Which company has the best grades?
DexCom, Inc. generally receives stronger grades, including multiple “Outperform” and “Buy” ratings. Zimmer Biomet Holdings shows a mixed profile with several lower marks such as “Underweight” and “Sell.” Investors may interpret DexCom’s grades as a signal of higher confidence from analysts.
Risks specific to each company
The following categories identify the critical pressure points and systemic threats facing both firms in the 2026 market environment:
1. Market & Competition
DexCom, Inc.
- Faces intense innovation pressure in continuous glucose monitoring; market growth attracts new entrants.
Zimmer Biomet Holdings, Inc.
- Operates in a mature orthopedic market with steady but slower growth; competitive pricing pressures persist.
2. Capital Structure & Debt
DexCom, Inc.
- Moderate leverage with debt-to-assets at 22%; strong interest coverage signals solid debt management.
Zimmer Biomet Holdings, Inc.
- Higher debt-to-assets at 33%; interest coverage weaker, indicating moderate financial risk.
3. Stock Volatility
DexCom, Inc.
- Beta of 1.49 reflects high volatility and sensitivity to market swings.
Zimmer Biomet Holdings, Inc.
- Beta of 0.61 shows lower volatility and defensive stock characteristics.
4. Regulatory & Legal
DexCom, Inc.
- Subject to FDA scrutiny on device approvals and data privacy regulations internationally.
Zimmer Biomet Holdings, Inc.
- Faces regulatory risks across multiple geographies due to diverse product portfolio and surgical device safety standards.
5. Supply Chain & Operations
DexCom, Inc.
- Relies on high-tech component suppliers; supply chain disruptions could delay product launches.
Zimmer Biomet Holdings, Inc.
- Complex manufacturing and global distribution networks increase exposure to operational delays and cost inflation.
6. ESG & Climate Transition
DexCom, Inc.
- Increasing investor focus on sustainable manufacturing practices; moderate ESG initiatives in place.
Zimmer Biomet Holdings, Inc.
- Stronger emphasis on ESG with broader initiatives on product lifecycle and carbon footprint reduction.
7. Geopolitical Exposure
DexCom, Inc.
- International sales expose it to trade tensions and regulatory changes, notably in Europe and Asia.
Zimmer Biomet Holdings, Inc.
- Broader geographic diversification increases geopolitical risk but also buffers regional shocks.
Which company shows a better risk-adjusted profile?
DexCom’s biggest risk is its high stock volatility combined with an elevated WACC that pressures valuation multiples. Zimmer Biomet faces significant financial distress risk, evidenced by its Altman Z-score in the distress zone, despite lower volatility. DexCom’s robust profitability and strong liquidity create a more favorable risk-adjusted profile. Zimmer’s weaker ROE and moderate interest coverage signal caution. Recent data highlight DexCom’s superior Altman Z-score (6.8 vs. 1.7) as critical in assessing financial stability.
Final Verdict: Which stock to choose?
DexCom’s superpower lies in its robust value creation and soaring profitability. It consistently delivers a return on invested capital well above its cost of capital, signaling a durable competitive edge. My point of vigilance is its rich valuation multiples, which may compress if growth slows. DexCom suits aggressive growth portfolios that can stomach premium pricing for innovation.
Zimmer Biomet’s moat centers on steady cash generation and a defensive industry position with tangible asset backing. It offers a safer profile than DexCom, supported by a solid current ratio and moderate valuation. While its profitability lags, Zimmer fits well in growth-at-a-reasonable-price (GARP) strategies seeking stability with upside potential.
If you prioritize rapid value creation and scalable innovation, DexCom outshines with superior profitability metrics and growth momentum. However, for investors emphasizing capital preservation and more conservative growth, Zimmer Biomet offers better stability and a more attractive valuation floor. Both present analytical scenarios worth considering based on your risk tolerance and portfolio goals.
Disclaimer: Investment carries a risk of loss of initial capital. The past performance is not a reliable indicator of future results. Be sure to understand risks before making an investment decision.
Go Further
I encourage you to read the complete analyses of DexCom, Inc. and Zimmer Biomet Holdings, Inc. to enhance your investment decisions: