Home > Comparison > Healthcare > SYK vs DXCM
The strategic rivalry between Stryker Corporation and DexCom, Inc. shapes the healthcare medical devices landscape. Stryker operates as a diversified medical technology giant, focusing on implants and surgical equipment. DexCom specializes in continuous glucose monitoring systems, emphasizing innovation in diabetes management. This analysis pits broad-based industrial strength against targeted technological innovation. I will determine which trajectory offers the superior risk-adjusted return for a diversified portfolio in this evolving sector.
Table of contents
Companies Overview
Stryker Corporation and DexCom, Inc. are pivotal players in the medical devices industry, shaping healthcare delivery worldwide.
Stryker Corporation: Diverse Medical Technology Leader
Stryker Corporation dominates as a medical technology powerhouse, generating revenue through its MedSurg and Orthopaedics segments. It sells implants, surgical equipment, and neurotechnology products used in joint replacements, spinal therapies, and minimally invasive procedures. In 2026, Stryker focuses on expanding its global footprint and innovation in surgical navigation and implant technologies to enhance patient outcomes.
DexCom, Inc.: Continuous Glucose Monitoring Innovator
DexCom, Inc. leads the diabetes management device market with its continuous glucose monitoring (CGM) systems. Its core revenue stems from integrated CGM products like DexCom G6 and G7, which replace traditional glucose testing. The company emphasizes advancing CGM accuracy and real-time data integration, collaborating with tech firms to extend digital health applications in 2026.
Strategic Collision: Similarities & Divergences
Both companies excel in medical devices, but Stryker prioritizes broad surgical and implant solutions, while DexCom specializes in diabetes monitoring technology. Their competition centers on innovation and market penetration within specialized healthcare niches. Investors should note Stryker’s diversified portfolio versus DexCom’s focused growth in a high-beta, tech-driven segment.
Income Statement Comparison
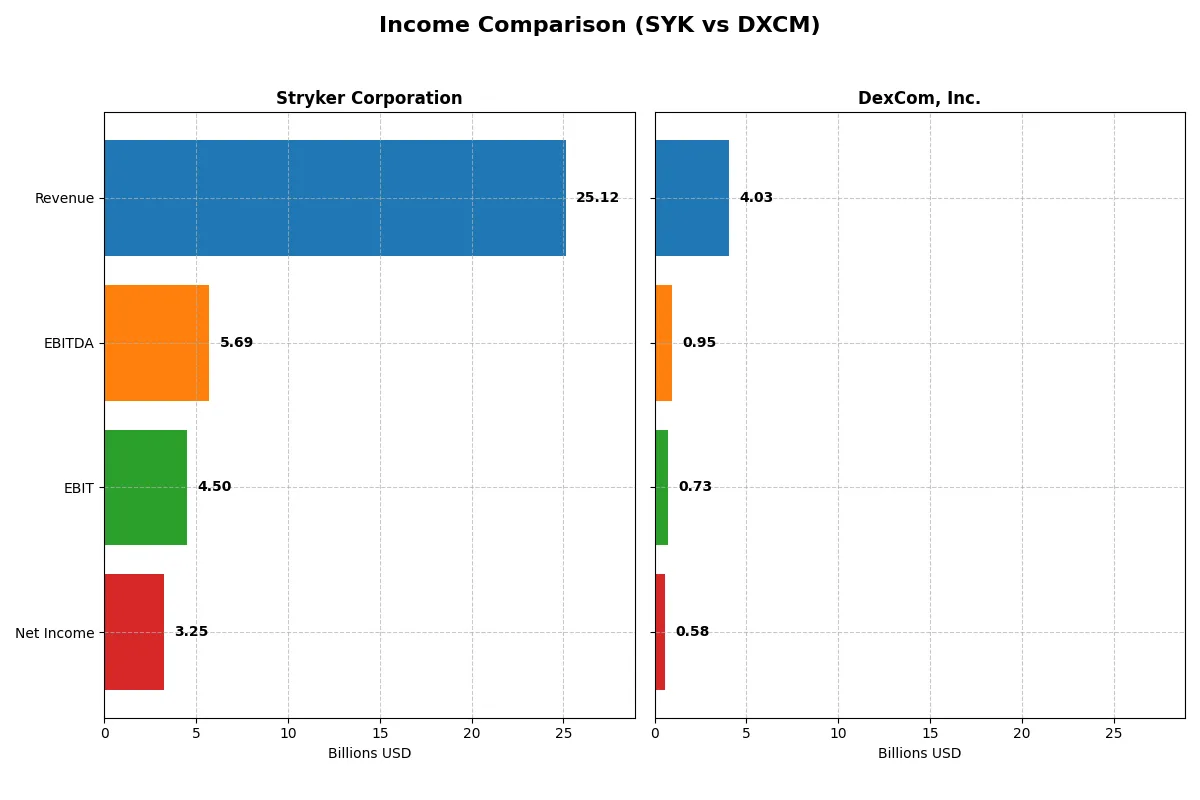
The following data dissects the core profitability and scalability of both corporate engines to reveal who dominates the bottom line:
| Metric | Stryker Corporation (SYK) | DexCom, Inc. (DXCM) |
|---|---|---|
| Revenue | 25.1B | 4.0B |
| Cost of Revenue | 9.7B | 1.6B |
| Operating Expenses | 9.8B | 1.8B |
| Gross Profit | 15.4B | 2.4B |
| EBITDA | 5.7B | 946M |
| EBIT | 4.5B | 728M |
| Interest Expense | 0 | 19M |
| Net Income | 3.2B | 576M |
| EPS | 8.49 | 1.46 |
| Fiscal Year | 2025 | 2024 |
Income Statement Analysis: The Bottom-Line Duel
This income statement comparison reveals which company delivers the most efficient and profitable growth amid evolving market conditions.
Stryker Corporation Analysis
Stryker drives strong revenue growth, reaching $25.1B in 2025, up 11% from 2024. Net income rose to $3.25B, although net margin slipped slightly to 12.9%. Gross margin remains robust at 61.4%, reflecting efficient cost control. Operating income growth of 15.7% signals solid momentum and operational discipline.
DexCom, Inc. Analysis
DexCom’s revenue surged 11.3% to $4.03B in 2024, doubling since 2020. Net income climbed to $576M but net margin declined to 14.3%. Gross margin stands at 60.5%, comparable to Stryker’s. However, EBIT dropped 0.4%, indicating some pressure on operating efficiency despite healthy top-line gains.
Margin Resilience vs. Rapid Expansion
Stryker outpaces DexCom in net income growth (63% vs. 17%) and maintains stronger margin expansion over five years. DexCom boasts faster revenue growth (109% vs. 47%) but struggles with margin contraction. Investors focused on stable profitability may prefer Stryker’s proven operational leverage, while those favoring high revenue momentum might consider DexCom’s growth profile.
Financial Ratios Comparison
These vital ratios act as a diagnostic tool to expose the underlying fiscal health, valuation premiums, and capital efficiency of the companies compared below:
| Ratios | Stryker Corporation (SYK) | DexCom, Inc. (DXCM) |
|---|---|---|
| ROE | 14.48% | 27.40% |
| ROIC | 7.37% | 10.20% |
| P/E | 41.38 | 54.61 |
| P/B | 5.99 | 14.97 |
| Current Ratio | 1.89 | 1.47 |
| Quick Ratio | 1.21 | 1.28 |
| D/E | 0.66 | 1.23 |
| Debt-to-Assets | 31.06% | 39.90% |
| Interest Coverage | 0 (not reported) | 31.58 |
| Asset Turnover | 0.52 | 0.62 |
| Fixed Asset Turnover | 6.48 | 2.88 |
| Payout Ratio | 39.56% | 0% |
| Dividend Yield | 0.96% | 0% |
| Fiscal Year | 2025 | 2024 |
Efficiency & Valuation Duel: The Vital Signs
Financial ratios serve as a company’s DNA, uncovering hidden risks and operational strengths that raw numbers alone cannot reveal.
Stryker Corporation
Stryker shows solid profitability with a 14.48% ROE and a favorable 12.92% net margin, indicating efficient operations. However, its valuation appears stretched, with a high P/E of 41.38 and P/B of 5.99. Dividend yield is modest at 0.96%, reflecting a cautious shareholder return strategy amid steady reinvestment.
DexCom, Inc.
DexCom delivers robust returns with a 27.4% ROE and a strong 14.29% net margin, signaling operational excellence. Its valuation is more stretched, marked by a 54.61 P/E and 14.97 P/B, indicating market confidence but elevated risk. DexCom pays no dividend, focusing on aggressive growth and R&D reinvestment.
Valuation Stretch vs. Operational Power
Stryker balances operational efficiency with moderate valuation risk, while DexCom offers higher profitability at a more demanding price. Investors seeking stable returns may prefer Stryker’s measured approach. Growth-focused investors might lean toward DexCom’s aggressive expansion despite its premium valuation.
Which one offers the Superior Shareholder Reward?
I compare Stryker Corporation (SYK) and DexCom, Inc. (DXCM) on dividend yield, payout ratios, and buybacks. SYK pays a 0.96% dividend yield with a 40% payout ratio, supported by strong free cash flow coverage (85%). DXCM pays no dividend but reinvests heavily in R&D and growth. SYK also runs a significant buyback program, enhancing shareholder returns sustainably. DXCM’s buybacks are minimal, reflecting its growth focus. Historically, SYK’s balanced distribution strategy offers a more reliable total return in 2026, combining income and capital appreciation. I conclude SYK provides superior shareholder reward due to its sustainable dividends and active buybacks.
Comparative Score Analysis: The Strategic Profile
The radar chart reveals the fundamental DNA and trade-offs of Stryker Corporation and DexCom, Inc., highlighting their core financial strengths and valuation challenges:
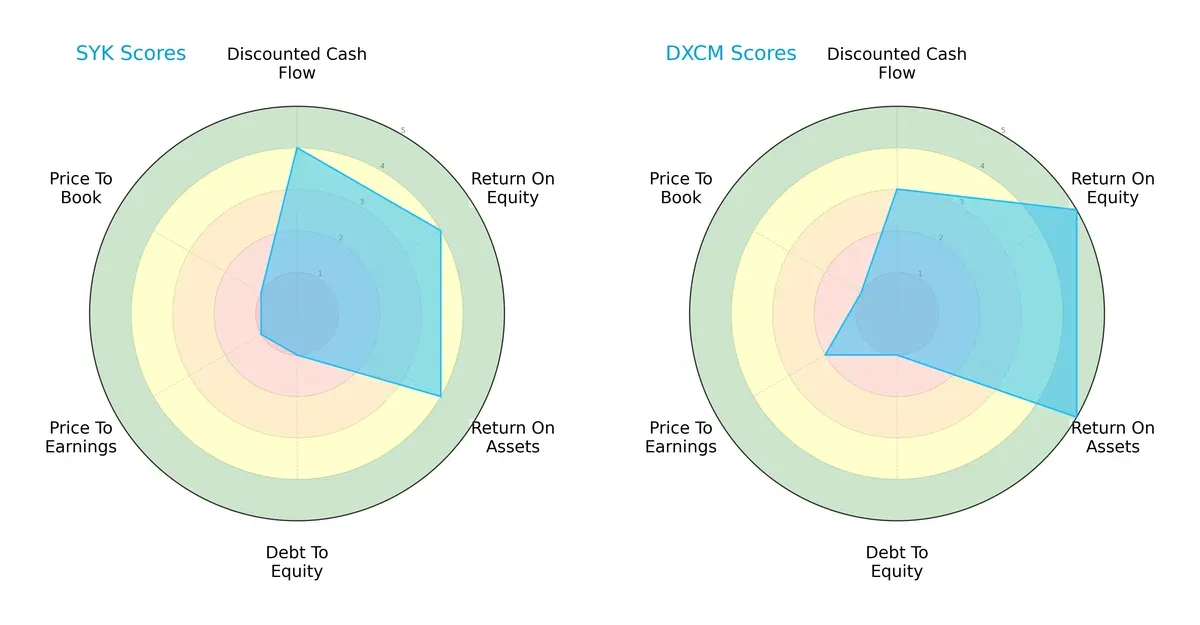
Stryker shows a balanced operational profile with strong DCF, ROE, and ROA scores at 4 each, but suffers from weak debt management and valuation metrics (all scored 1). DexCom excels in profitability with top ROE and ROA scores of 5, yet shares the same weaknesses in debt and book valuation. DexCom leverages operational efficiency, while Stryker relies more on cash flow projections.
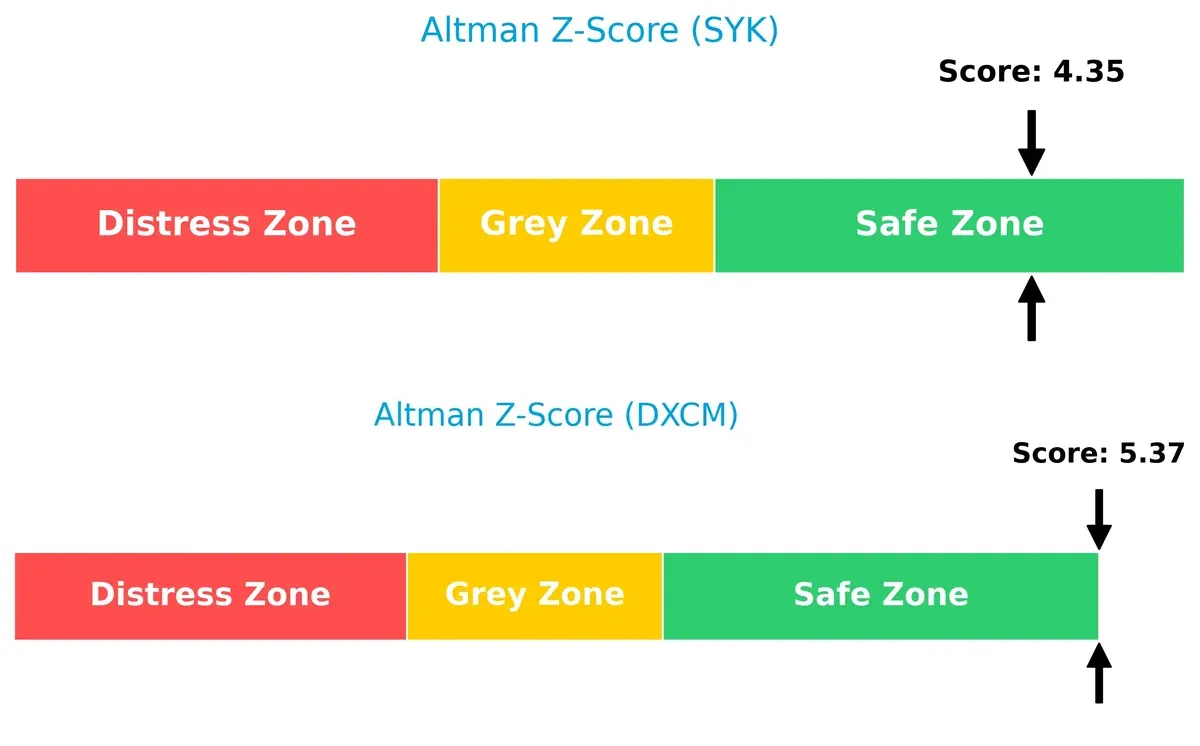
Bankruptcy Risk: Solvency Showdown
DexCom’s Altman Z-Score of 5.37 surpasses Stryker’s 4.35, both firmly in the safe zone, underscoring superior solvency and lower bankruptcy risk for both firms in this market cycle:
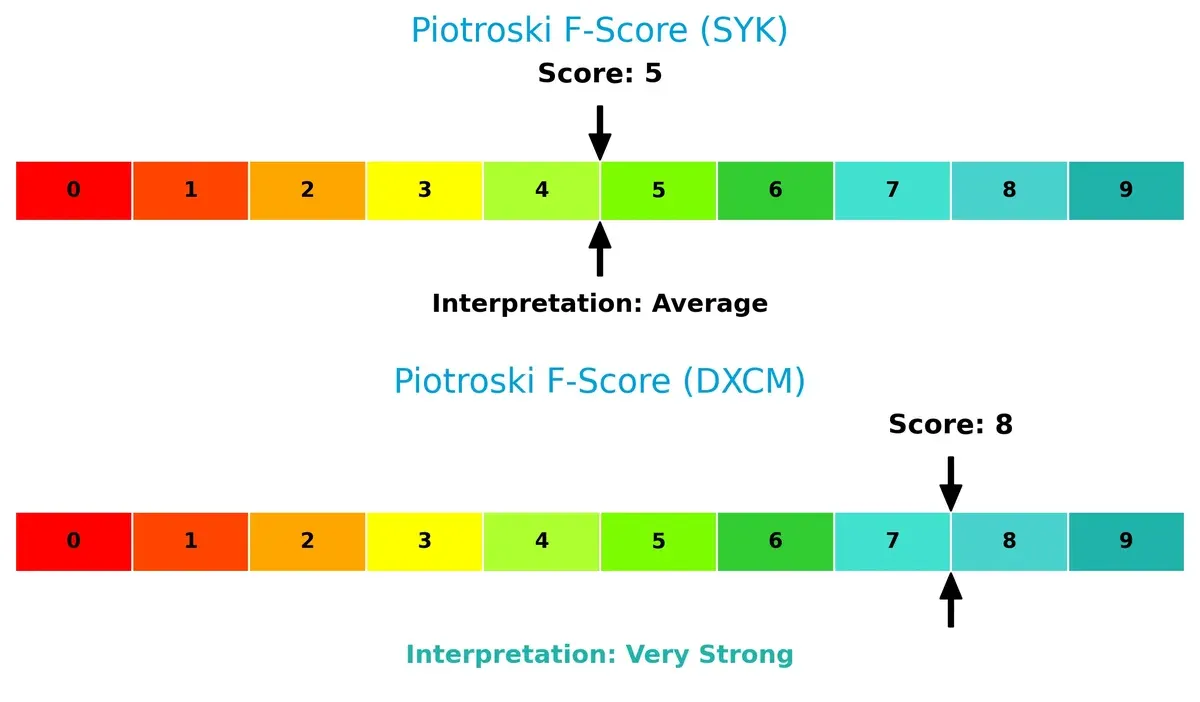
Financial Health: Quality of Operations
DexCom’s Piotroski F-Score of 8 signals very strong financial health, whereas Stryker’s 5 marks it as average, indicating potential red flags in internal metrics for Stryker compared to DexCom’s robust operational quality:
How are the two companies positioned?
This section dissects Stryker and DexCom’s operational DNA by comparing revenue distribution and internal dynamics. The goal is to confront their economic moats to identify the most resilient competitive advantage today.
Revenue Segmentation: The Strategic Mix
This visual comparison dissects how Stryker Corporation and DexCom, Inc. diversify their income streams and reveals where their primary sector bets lie:
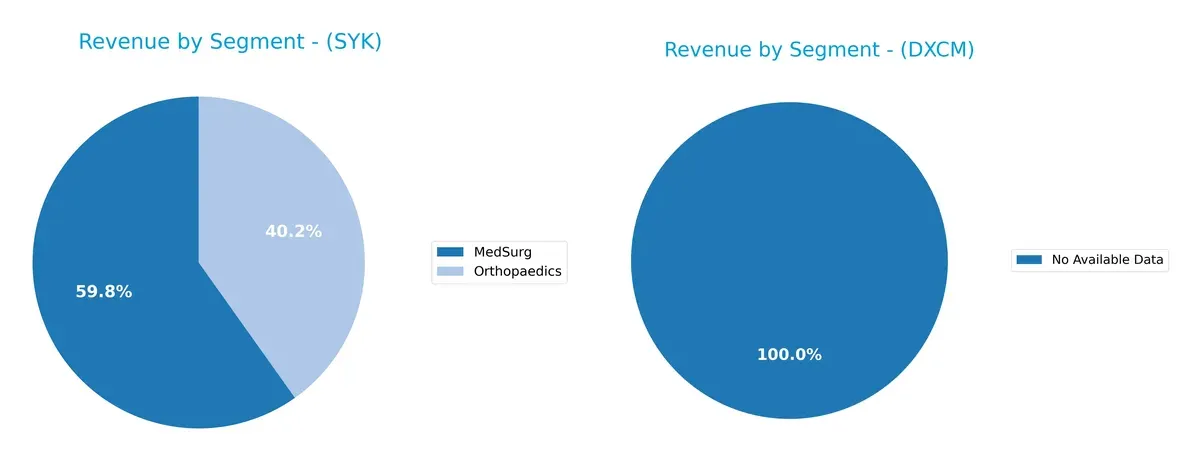
Stryker dominates with two robust segments: MedSurg at $13.5B and Orthopaedics near $9.1B in 2024. This mix shows strong diversification within medical devices. DexCom lacks available data, so I cannot assess its segmentation. Stryker’s balanced revenue anchors its ecosystem lock-in and reduces concentration risk, contrasting sharply with the unknown profile of DexCom. This strategic breadth supports resilience amid healthcare market cycles.
Strengths and Weaknesses Comparison
This table compares the Strengths and Weaknesses of Stryker Corporation and DexCom, Inc.:
Stryker Corporation Strengths
- Strong diversification across MedSurg and Orthopaedics segments
- Favorable net margin at 12.92%
- Solid current and quick ratios indicating liquidity
- High fixed asset turnover at 6.48
- Significant global presence with $16.9B US and $5.6B foreign revenue
DexCom, Inc. Strengths
- Higher profitability metrics with net margin 14.29% and ROE 27.4%
- Favorable ROIC at 10.2%
- Strong interest coverage of 38.32
- Good quick ratio at 1.28
- Growing US and Non-US revenue base with $2.6B US sales
Stryker Corporation Weaknesses
- Unfavorable valuation multiples with PE 41.38 and PB 5.99
- Dividend yield below 1%
- Neutral leverage with D/E 0.66 and debt to assets 31%
- ROIC slightly below WACC at 7.37% vs 7.56%
DexCom, Inc. Weaknesses
- Unfavorable valuation multiples with PE 54.61 and PB 14.97
- Higher leverage with D/E 1.23
- WACC at 10.19% exceeds ROIC of 10.2% marginally
- No dividend yield
- Neutral current ratio at 1.47
Both companies exhibit strengths in profitability and liquidity but face challenges with high valuation multiples. Stryker shows broader diversification and stronger global scale, while DexCom excels in return metrics but carries higher leverage. These differences highlight contrasting strategic priorities and risk profiles.
The Moat Duel: Analyzing Competitive Defensibility
A structural moat is the sole barrier protecting long-term profits from relentless competitive erosion in any industry:
Stryker Corporation: Diversified Medical Device Moat
Stryker’s moat stems from its broad product portfolio and strong brand in orthopedics and surgical equipment. It shows stable margins but declining ROIC warns of weakening capital efficiency. Expansion into neurotechnology markets could either deepen or strain this moat in 2026.
DexCom, Inc.: Innovation-Driven Network Effects
DexCom’s competitive edge lies in its continuous glucose monitoring ecosystem, creating high customer switching costs. Its ROIC is rising, signaling improving capital returns. The rollout of next-gen CGM tech and digital integrations offers strong growth and moat expansion potential.
Verdict: Diversification vs. Network Innovation
Stryker’s wide product diversification offers a broad moat, but declining ROIC signals risk. DexCom’s narrower but growing moat from network effects and innovation appears deeper and more durable. I see DexCom better positioned to defend and grow its market share in 2026.
Which stock offers better returns?
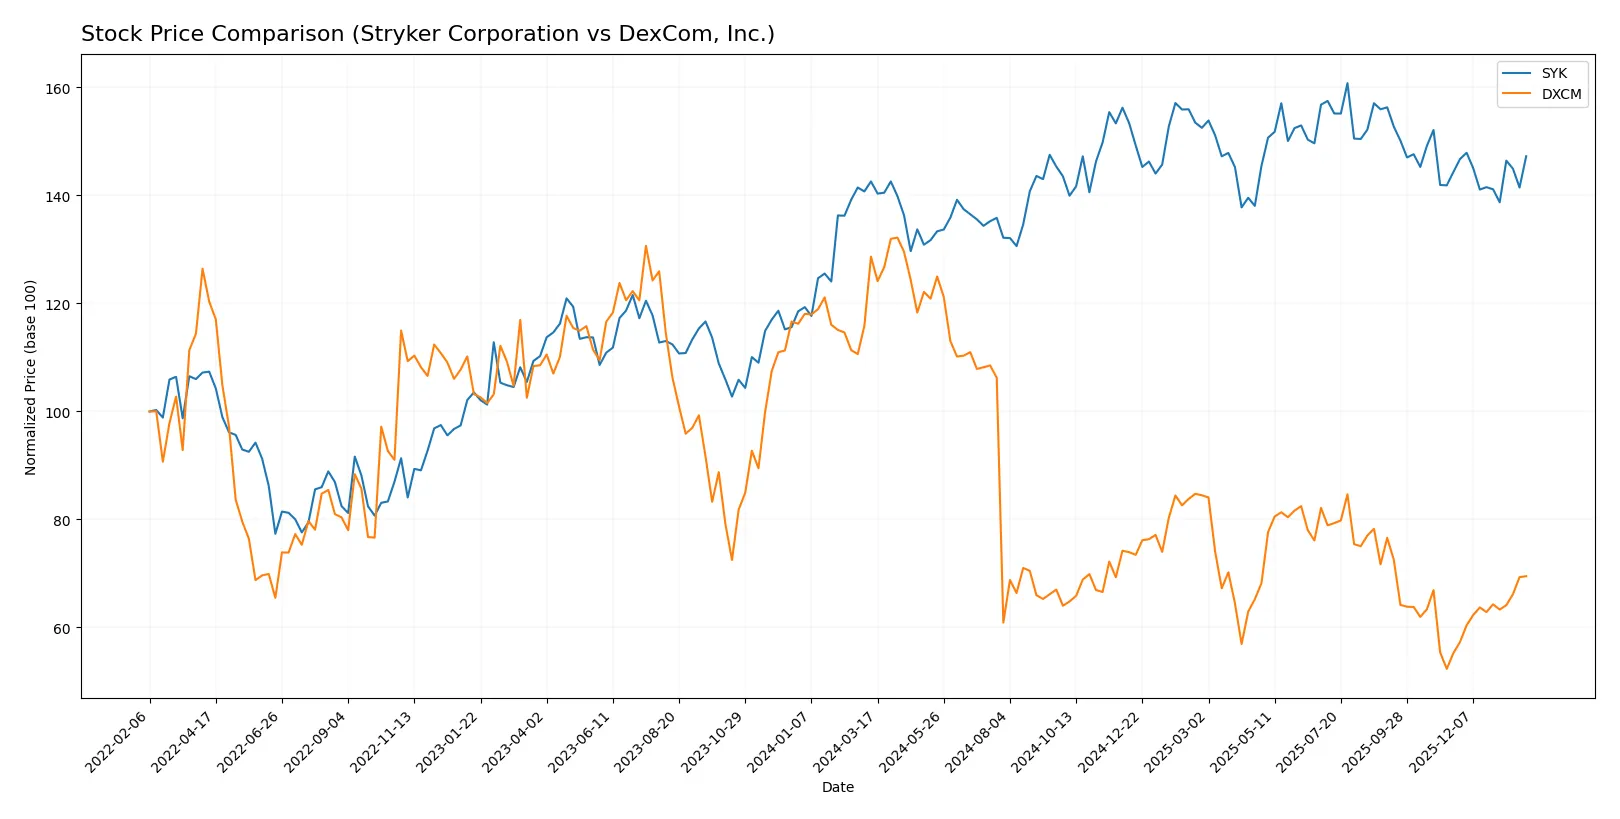
Over the past year, Stryker Corporation’s stock showed moderate gains with decelerating momentum, while DexCom, Inc. experienced a steep decline followed by a recent sharp rebound.
Trend Comparison
Stryker Corporation’s stock rose 3.27% over the past 12 months, marking a bullish trend with deceleration in price gains. It ranged between 325.43 and 403.53, showing moderate volatility.
DexCom, Inc.’s stock fell 46.0% over the same period, signaling a clear bearish trend with accelerating losses. It hit a low of 55.0 and a high of 138.93, reflecting substantial volatility.
DexCom, Inc. underperformed Stryker over 12 months despite a recent 25.8% rebound, while Stryker maintained steady positive returns throughout the year.
Target Prices
Analysts present a cautiously optimistic target consensus for both Stryker Corporation and DexCom, Inc.
| Company | Target Low | Target High | Consensus |
|---|---|---|---|
| Stryker Corporation | 390 | 465 | 421.64 |
| DexCom, Inc. | 71 | 99 | 84.55 |
Stryker’s consensus target sits about 14% above its current price of 370, signaling moderate upside potential. DexCom’s target consensus is roughly 16% higher than its current 73 price, reflecting room for growth amid sector volatility.

Don’t Let Luck Decide Your Entry Point
Optimize your entry points with our advanced ProRealTime indicators. You’ll get efficient buy signals with precise price targets for maximum performance. Start outperforming now!
How do institutions grade them?
Stryker Corporation Grades
The following table summarizes recent analyst grades for Stryker Corporation:
| Grading Company | Action | New Grade | Date |
|---|---|---|---|
| Needham | Maintain | Buy | 2026-01-30 |
| BTIG | Maintain | Buy | 2026-01-30 |
| Bernstein | Maintain | Outperform | 2026-01-09 |
| Citizens | Upgrade | Market Outperform | 2025-12-19 |
| Truist Securities | Maintain | Hold | 2025-12-18 |
| Citigroup | Maintain | Buy | 2025-12-11 |
| Wells Fargo | Maintain | Overweight | 2025-11-14 |
| Truist Securities | Maintain | Hold | 2025-11-14 |
| BTIG | Maintain | Buy | 2025-11-14 |
| Needham | Maintain | Buy | 2025-11-14 |
DexCom, Inc. Grades
Below is the summary of recent analyst grades for DexCom, Inc.:
| Grading Company | Action | New Grade | Date |
|---|---|---|---|
| Barclays | Downgrade | Underweight | 2026-01-12 |
| Bernstein | Maintain | Outperform | 2026-01-09 |
| Mizuho | Maintain | Outperform | 2025-12-17 |
| Citigroup | Maintain | Buy | 2025-12-11 |
| Morgan Stanley | Upgrade | Overweight | 2025-12-02 |
| Morgan Stanley | Maintain | Equal Weight | 2025-11-10 |
| Argus Research | Maintain | Buy | 2025-11-07 |
| UBS | Maintain | Buy | 2025-11-03 |
| Barclays | Maintain | Equal Weight | 2025-11-03 |
| Truist Securities | Maintain | Buy | 2025-11-03 |
Which company has the best grades?
Stryker Corporation consistently receives buy and outperform grades, with fewer downgrades. DexCom shows mixed ratings, including a recent downgrade. Stryker’s stronger consensus might reassure investors seeking stability in analyst opinions.
Risks specific to each company
The following categories identify the critical pressure points and systemic threats facing both firms in the 2026 market environment:
1. Market & Competition
Stryker Corporation
- Strong market cap of $141B supports leadership in diversified medical devices. Faces intense competition in orthopaedics and neurotechnology.
DexCom, Inc.
- Smaller $29B cap but dominates CGM niche. Faces competitive threats from emerging diabetes tech and regulatory approvals.
2. Capital Structure & Debt
Stryker Corporation
- Moderate debt-to-equity ratio of 0.66; interest coverage is infinite, indicating low financial risk.
DexCom, Inc.
- Higher debt-to-equity of 1.23 signals elevated leverage risk despite solid interest coverage of 38x.
3. Stock Volatility
Stryker Corporation
- Beta of 0.9 suggests lower volatility compared to market, providing stable returns.
DexCom, Inc.
- Beta of 1.48 indicates higher stock volatility, increasing investment risk amid market fluctuations.
4. Regulatory & Legal
Stryker Corporation
- Operates globally in regulated medical device markets, subject to approval delays and litigation risks.
DexCom, Inc.
- Faces stringent FDA scrutiny for CGM devices; ongoing innovation requires regulatory compliance vigilance.
5. Supply Chain & Operations
Stryker Corporation
- Broad manufacturing footprint supports resilience but complexity raises operational risks.
DexCom, Inc.
- Supply chain is critical for sensor components; disruptions could impair product availability.
6. ESG & Climate Transition
Stryker Corporation
- Increasing ESG focus with sustainable product lines and energy efficiency initiatives.
DexCom, Inc.
- Emphasizes digital health innovation but faces challenges embedding ESG fully across operations.
7. Geopolitical Exposure
Stryker Corporation
- Global sales in 75 countries expose it to trade tensions and currency risks.
DexCom, Inc.
- International growth ambitions face geopolitical uncertainties impacting market access and supply chains.
Which company shows a better risk-adjusted profile?
Stryker’s moderate leverage, lower stock volatility, and global diversification offer a safer risk-adjusted profile. DexCom’s higher debt and stock beta increase its financial and market risk. Stryker’s infinite interest coverage contrasts with DexCom’s leveraged balance sheet, signaling stronger financial stability. DexCom’s top-tier profitability scores are offset by valuation and leverage concerns. Recent data shows DexCom’s Piotroski score of 8, indicating strong fundamentals, but elevated debt remains a red flag. Stryker’s Altman Z-score above 4 confirms low bankruptcy risk, reinforcing its prudent capital structure amid competitive pressures.
Final Verdict: Which stock to choose?
Stryker Corporation’s superpower lies in its robust cash generation and operational efficiency, supporting steady growth in a mature healthcare market. However, its declining ROIC signals a point of vigilance, suggesting the need for careful monitoring of capital allocation. It suits portfolios seeking reliable, moderate growth with defensive qualities.
DexCom, Inc. commands a strategic moat through its innovative diabetes management technology and recurring revenue streams. Despite its higher leverage and valuation multiples, it offers stronger profitability and a growing ROIC trend, presenting a relatively safer growth profile than Stryker. It fits well with GARP investors aiming for growth balanced with quality.
If you prioritize steady cash flow and operational resilience, Stryker is the compelling choice due to its consistent income statement strength and market position. However, if you seek dynamic growth with improving profitability and technological edge, DexCom offers better stability in innovation and expanding returns. Both present distinct strategic appeals, demanding alignment with your risk tolerance.
Disclaimer: Investment carries a risk of loss of initial capital. The past performance is not a reliable indicator of future results. Be sure to understand risks before making an investment decision.
Go Further
I encourage you to read the complete analyses of Stryker Corporation and DexCom, Inc. to enhance your investment decisions: